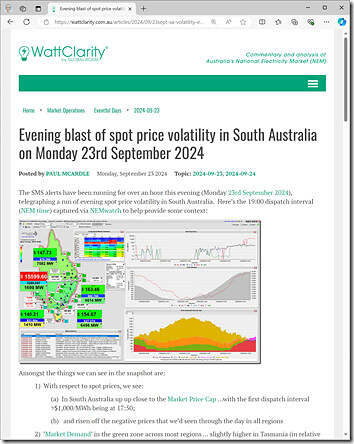
As it happened on the day, we posted about the ‘Evening blast of spot price volatility in South Australia on Monday 23rd September 2024’:
That was almost 6 weeks ago, today. However since that time we’ve had our attention drawn back to the same event on several occasions:
1) In some instances we had clients asking us about what we’d seen happening at the time;
2) In some instances we’ve had that instance featured in a bit of a Case Study to assist in training new clients in how to use our ez2view software.
… so I thought it might be worth providing a bit more of a record here in this Case Study Part 2 (calling that first article Part 1) … and Part 3+more which will follow.
(A) Recapping at a high level
The snapshot from NEMwatch at the 19:00 dispatch interval (NEM time) in the contemporaneous article highlighted some of the broader contributing factors:
1) Constraints on the Heywood interconnector limiting further imports from VIC
2) Limited production from VRE, by virtue of:
(a) The volatility proceeding well past sunset – so removing solar PV (both Small Solar and Large Solar) from the equation; and
(b) Low wind production across South Australia at the time.
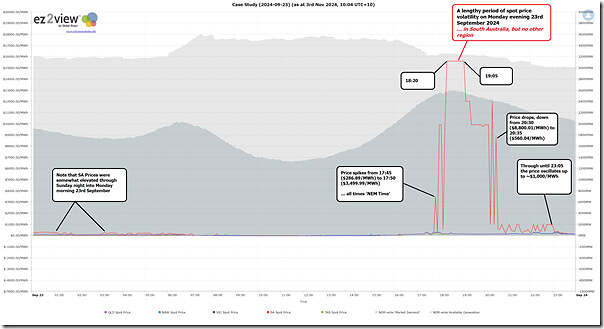
But it’s probably worth starting with this chart from the ‘Trends Engine’ inside of ez2view to sum up some other high-level parameters:
With respect to the above:
1) The pricing in South Australia:
(a) Was somewhat elevated even in the morning period;
(b) But it was evening volatility that gained most attention:
i. This began at 17:50 (NEM time) with the price at $3,499.99/MWh – up from $286.89/MWh at 17:45
ii. and ended at 20:30 (NEM time) with the price at $8,800.01/MWh – before dropping to $560.04/MWh at 20:35
iii. but, even afterwards, through to 23:05 note that the price still bounced up to ~$1,000/MWh on a number of occasions.
2) All the while prices in other regions were much more subdued.
… so moving on…
(B) Interconnector limitations
Remember that the VIC-SA interconnector (which is commonly called ‘Heywood’) is the representation of flow from the Victorian RRN to the South Australian RRN (for instance, with the dynamic inter-regional losses on the line calculated across the entire flow path, not just the cables that cross the VIC-SA border).
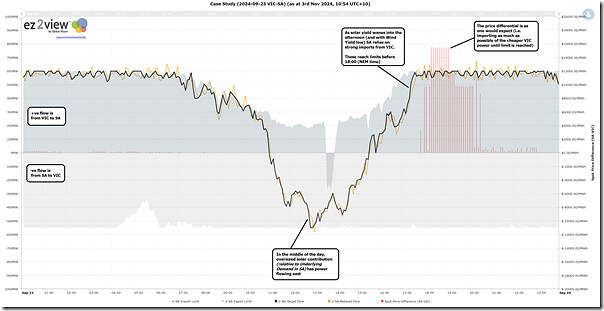
With interconnector convention being positive flow being west, we’ve again used the ‘Trends Engine’ inside of ez2view to sum up the contribution of the interconnector during the period of the price volatility in South Australia:
In summary:
1) During peak sunlight periods, because solar yield is oversized relative to ‘Underlying Demand’ (less an allowance for the remaining ‘Keeping the Lights on Services’ required to be supplied by generation plant), South Australia is strong on exports to Victoria:
… up to the ‘Import Limit’ (i.e. referenced to VIC) in the middle of the day
2) But during morning and evening, with solar much declined (and also due to low wind yield) the ‘lowest cost*’ outcome NEMDE sees is to minimise use of local supply options and instead import as much lower-cost generation from Victoria (and hence further afield) as possible.
(a) * i.e. this is ‘cost’ inside of the NEMDE model looking at bid prices as a direct proxy for cost (and it’s not always perfectly correlated with cost paid by end consumers)
(b) but note that the ‘Export Limit’ (i.e. referenced to VIC) is only ~600MW through this period, whereas the ‘Market Demand’ in South Australia is ~1,700MW in the NEMwatch snapshot for the 19:00 dispatch interval above.
… this means that South Australia needs to dispatch the ‘next cheapest’ supply options in South Australia to meet the gap. We sometimes use the term ‘Economic Island’ to describe this situation.
(C) Aggregate Bid Stacks
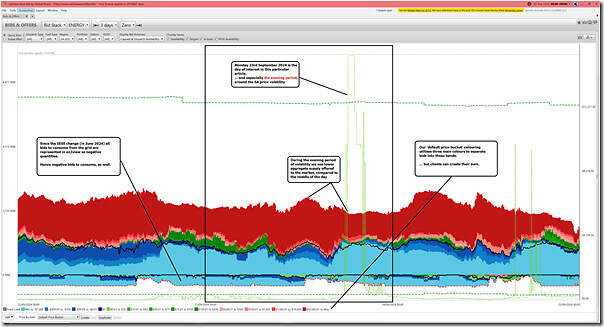
From the perspective of closing that gap, let’s now use the ‘Bids & Offers’ widget in ez2view to take a look at the supply stack on an aggregate basis:
In these trends we’ve chosen to span three days (i.e. Sunday 22nd September 2024, Monday 23rd September 2024 and Tuesday 24th September 2024) in order to highlight some differences in bids – and hence dispatch outcomes.
… if you have time, you might want to read through the linked articles for each of those days in order to understand some key differences, as background.
Now let’s break the bids down into ‘Fuel Types’ in order to see where we should be focused
(C1) Supply from VRE (Variable Renewable Energy)
A commonly used term is VRE … but we’ve also commonly called this ‘Anytime/Anywhere Energy’ to better capture the structure of incentives commonly used in its development.
(C1a) Supply from VRE (Wind Generation)
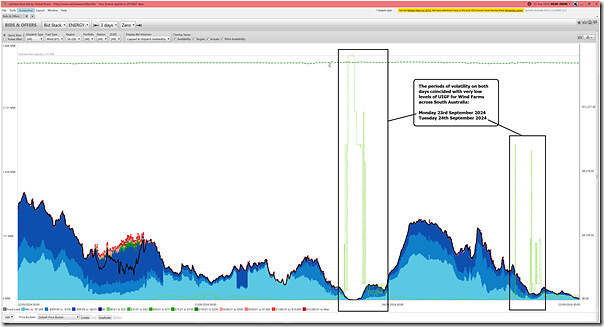
Here’s a trended Bid Stack view across all of the Semi-Scheduled Wind Farms (plus some Non-Scheduled Wind Farms that operate like Semi-Scheduled Wind Farms from a NEMDE perspective):
We’ve highlighted that the two periods of price volatility – evenings of Monday 23rd September 2024 and Tuesday 24th September 2024 – coincide with very low levels of aggregate Wind UIGF.
Clearly one contributing factor.
(C1b) Supply from VRE (Large Solar Generation)
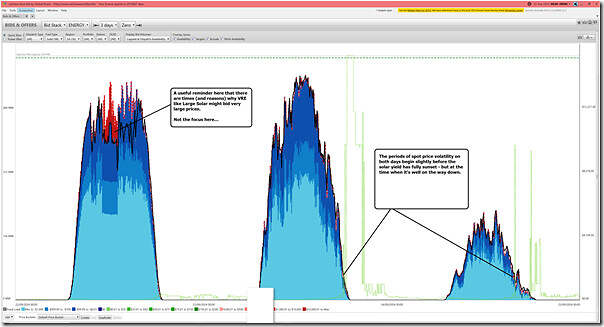
Here’s a trend of aggregate bids for Large Solar in South Australia over this three day period:
As noted on the image, the spot price volatility occurred when the late afternoon Large Solar yield had almost completely set for each evening.
(C1c) Supply from VRE (Medium and Small Solar Generation)
A quick reminder that:
1) ‘Small Solar’ (the term we use to describe rooftop PV with an installed size of under 100kW (so eligible for SRES) is only partially visible, in estimated output data.
2) ‘Medium Solar’ (the term we use to describe distributed PV above 100kW (so not visible in SRES data) but below ~20MW (so not captured in AEMO dispatch data) is even more invisible.
However the supply shape for these options won’t have been too dissimilar to the Large Solar above – so not of material consequence in much of the period of volatility.
(C2) Supply from Firming
A commonly used term is Firming … but we’ve also commonly called this ‘Keeping the Lights on Services’ to emphasise the purpose of this supply, and to also remind that it’s not just about the energy that’s supplied by this Firming Capacity.
We’ll walk through each of these in turn, in a slightly different order than normal:
(C2a) Supply from Firming (Liquid-Fired Generation)
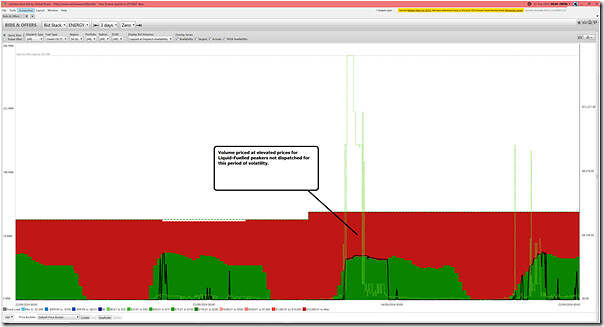
Here’s a view of the capacity of liquid-fuelled generators in South Australia:
There’s unused capacity (i.e. above the black-line trace of output) that’s priced in the deep red colour, signifying bids up towards the Market Price Cap.
(C2b) Supply from Firming (Batteries)
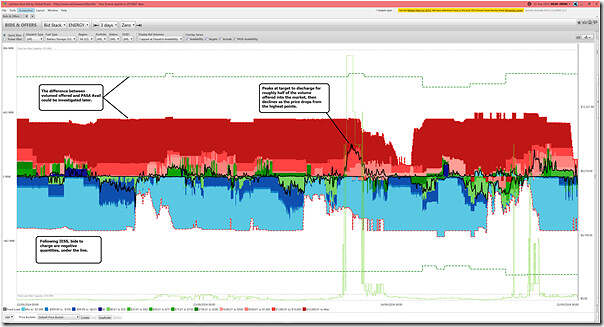
Here’s a view of the capacity of batteries (as Bi-Directional Units) in South Australia, noting that :
There’s unused capacity (i.e. above the black-line trace of output) that’s priced in the deep red colour, signifying bids up towards the Market Price Cap.
(C2c) Supply from Firming (Negawatts)
Negawatts are a supply-side (virtual) commodity created by the introduction of the WDRM in 2021 (roughly 3 years ago today). It’s been a (surprising?) disappointment to some – however to others (like me) there’s been no surprise, as it’s performed along the lines of what was expected (i.e. not much at all).
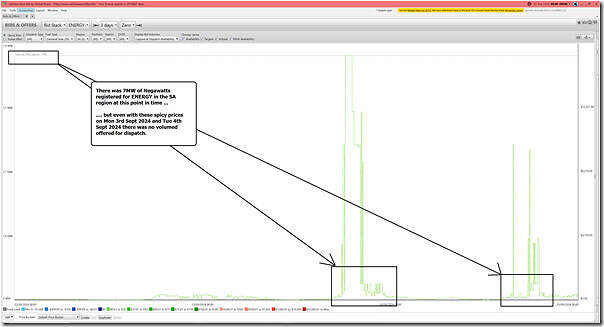
For instance, here’s the supply stack of negawatts in South Australia over those three days:
As highlighted, there was 7MW of negawatts registered for ENERGY in South Australia at this time … but none of it even offered bids for the attractive prices (Monday 23rd September 2024 and Tuesday 24th September 2024).
(C2d) Supply from Firming (Gas-Fired Generation)
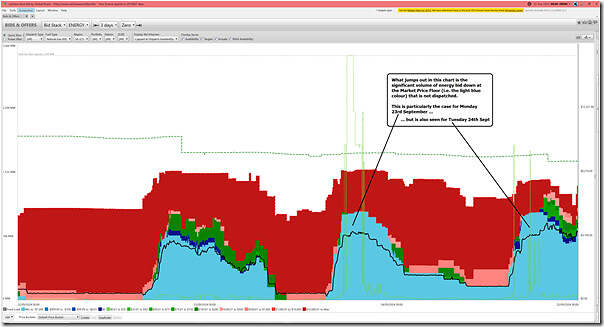
Last but certainly not least, here’s a view of trended bids for gas-fired units in South Australia over this three-day period:
What really jumps out as quite visible is the sizeable volume bid down at the Market Price Floor (i.e. down at –$1,000/MWh) which still does not get dispatched in this instance … both through Monday 23rd September 2024 and Tuesday 24th September 2024.
Now continued…
On Monday 4th November 2024 we posted ‘Reviewing 12 dispatch intervals in South Australia on Monday 23rd September 2024 ‘ as Part 3 in this evolving Case Study.


Leave a comment