Yesterday we shared ‘Curtailment of Wind Resource (i.e. Semi-Scheduled) across the NEM reaches 53.6% on Sunday 1st September 2024’.
… In that article, we noted:
(a) The quick look at Wind Curtailment had followed the earlier article (posted Monday 1st September) about ‘Curtailment of Solar Resource from (Semi-Scheduled) Large Solar across the NEM reaches 79.2% on Sunday 1st September 2024’.
(b) Which had generated quite a conversation in different parts of social media.
(c) And also in the AFR by Angela MacDonald-Smith, who’d written ‘Wild winds blow up solar farm profits’, referencing some of the content of that article.
One of the other questions that Angela had asked me was ‘which solar farms had been curtailed?’ … too which (without looking) I’d flippantly replied that it would be easier to list which ones had not curtailed
… i.e. with so much energy being curtailed I’d assumed that the number of DUIDs being curtailed would be large!
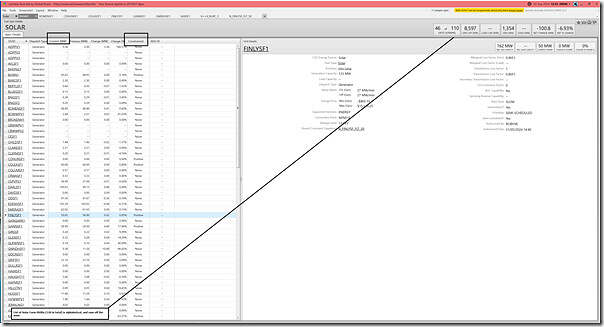
Curiosity prompted me this morning to have a closer look, so I utilised the ‘Fuel Type Details’ widget in ez2view focused on solar, time-travelled back to 12:35 on Sunday 1st September 2024 (i.e. the time of peak curtailment as noted in the chart here). Here’s a snapshot, but note that the list of DUIDs (110 in total, of which 101 were accounted for in AEMO systems at the time) runs off the bottom of the visible page:
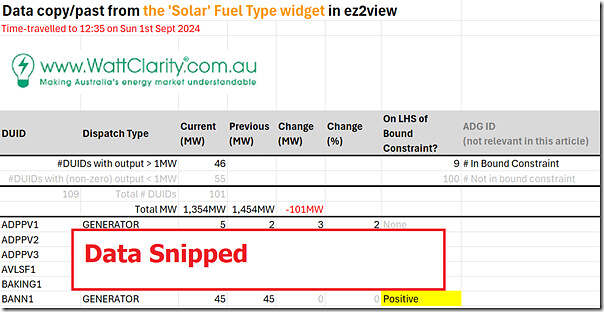
Don’t worry so much about the not seeing them all, at this point – as I’ve copy-pasted from this widget to an Excel sheet, added some auto-formatting, and have presented a longer view as an image at the end of the article for your ease of reference (remember to click on the image to open larger view in different tab).
Headline summary
But let’s just start with the headline summary for now….
From this image we see:
1) There’s 110 solar farm DUIDs in the list … of which only 101 are actually have data published at present
… I have not looked to confirm, but:
i. it’s probable the some of the other 9 are in the process of commissioning
ii. there may be data glitches in the EMMS with others meaning that there’s just ‘No Data’ at this point in time
2) Of the 101 DUIDs with data:
(a) 55 DUIDs have some output data lower than 1MW
i. i.e. because of the vagaries of physical operation and SCADA systems sometimes there are units that are notionally zero but the reality is not quite.
ii. so we’ll call these units ‘OFF’
iii. but note that that’s only just over 50% of the total
iv. so that’s less than I thought, when I gave Angela my flippant response on Monday
(b) That leaves 46 units with some kind of (i.e. non-zero) output.
(c) Not necessarily a subset of those 55 (or mutually exclusive) there are only 9 DUIDs subject to a bound constraint:
i. More specifically, they are DUIDs that are on the Left Hand Side (LHS) of a (one or more) bound constraint equation(s);
ii. Trying not to go into the gory details:
1. this means that these 9 DUIDs may be being ‘constrained down’ by those bound constraint equations
2. but its not guaranteed without more data … examples below.
PS1 … Headline Caveats
As a PS (later on Wednesday), I thought it might be useful to add these Headline Caveats:
1) The data above shows FinalMW (and not Target) for ‘Current’ (Output) and ‘Previous’ (Output)
2) Just because a Unit shows 0MW output, it does not necessarily mean it’s been curtailed:
(a) There might be no solar resource (e.g. cloud cover) or the plant could be offline.
(b) If it’s 0MW because it’s curtailed, there’s insufficient data in the table shown above (and at the bottom) for the reader to ascertain why.
(c) Some of the examples below help to illustrate the complexity of ascertaining this
3) Just because the Unit shows some output, it also does not mean it’s not been (partially) curtailed!
(a) To understand this, you’d need to understand both the Capacity (remembering these separate caveats about Capacity) and also the UIGF
(b) And, even if it has been partially curtailed, there’s complexity in understanding why.
(c) Again, see the examples below…
Four particular DUIDs
With that in mind, we take a look at 4 particular DUIDs … noting that there’s probably other DUIDs that would also make interesting Case Studies as well, I’m just trying to make this article not so long.
For those playing along with their own copies of ez2view, I have included some explanation:
1) but note I am using version 9.9.4.361 which may be more recent the version you have installed
2) it was ‘Latest & Greatest’ until recently, but was itself superseded on Monday just passed.
So let’s start up the top of the list and work down … skipping most.
BANN1 (Bannerton Solar Farm)
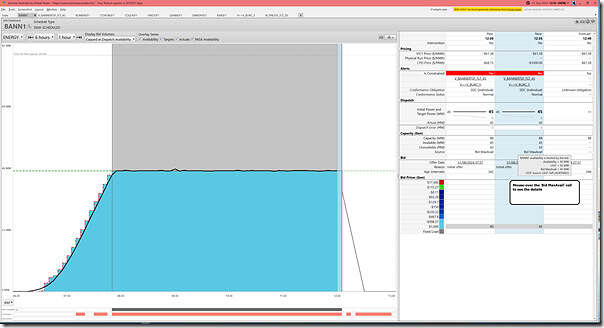
Looking alphabetically, the Bannerton Solar Farm (in VIC) is the first one in the list that’s large-size and providing some output … and also extra-interesting because it is on the LHS of (at least one) bound constraint. We can see more about this unit by clicking through to the ‘Unit Dashboard’ widget in ez2view … in this case the snapshot below shown with a mouse-over tool tip captured for other useful information:
This particular case (somewhat randomly chosen!) is an excellent illustration of two different complexities:
1) It’s an excellent case of Marcelle’s warning that ‘Not as simple as it appears – estimating curtailment of renewable generation’.
2) It’s also an excellent example of the complexity in Linton’s illustration ‘What inputs and processes determine a semi-scheduled unit’s availability’.
Let’s start at the end, by saying that I would state that this unit has been ‘constrained down’ in this particular dispatch interval … even though a strict reading of the data suggests that this is not actually the case. Let’s build it up:
1) The unit ‘as bid’ has allocated 88MW to the –$1000/MWh bid band at the RRN
(a) Not shown on this image directly, you need to click through to the ‘Bid Details’ widget to see this.
(b) But we can see that the CPD price for this unit is –$1,000/MWh … showing the impact of transmission congestion.
2) In NEMDE, however, it’s only 45MW of volume that is considered for dispatch:
(a) That’s what is shown as ‘Available’ in the column for 12:35;
(b) We see that the Source is ‘Bid MaxAvail’
(c) In the mouse-over, we see that the UIGF for the unit (supplied from the self-forecast in this case) is 63MW
3) We also see that the unit is subject to two bound constraints:
(a) The first in the list is the ‘V_BANNERTSF_FLT_45’ constraint equation which I’ve clicked through to access (not shown here):
i. that explains its purpose as being ‘Limit Bannerton Solar Farm upper limit to 45 MW to manage post contingent voltage oscillation’.
ii. Achieves this with a very simple form, being LHS (which is only BANN1 dispatch target) <= 45MW
iii. Hence my synopsis that the unit’s being ‘constrained down’ even though the dashboard above shows it as being ‘fully’ dispatched to its Availability.
(b) The other bound constraint is the ‘V>>V_BURC_5’ constraint equation … which we’ll revisit further down in this article.
4) What complicates the story further is that the unit’s had its bid limited to 45MW (also!) because of the use of that number in MaxAvail.
… so different readers might wonder which one was chicken, and which one was the egg?
BOMENSF1 (Bomen Solar Farm)
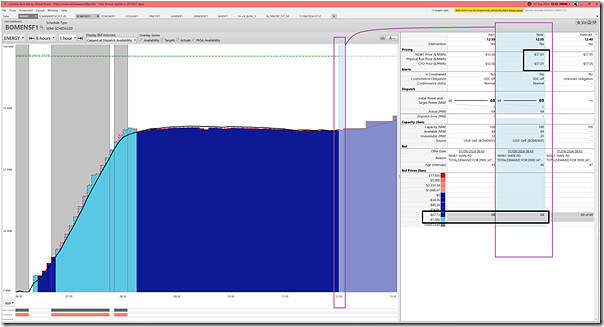
Stepping through the list we next stop at BOMENSF1 in NSW – which has output, but no constraint. Here’s the ‘Unit Dashboard’ widget in ez2view:
In this case we see that:
1) Not subject to a bound constraint, as we noted above
2) It’s dispatched at 69MW:
(a) Which is its Availability
(b) Source of the Availability is also a self-forecast
3) The reason it’s not dispatched down is:
(a) that the RRP in the NSW region is –$57.01/MWh in this Dispatch Interval
(b) but its volume is bid at –$67.73/MWh at the RRN
(c) so the Generator’s said that it would be happy to pay a bit more (presumably its own unique ‘negative LGC’) in order to keep generating.
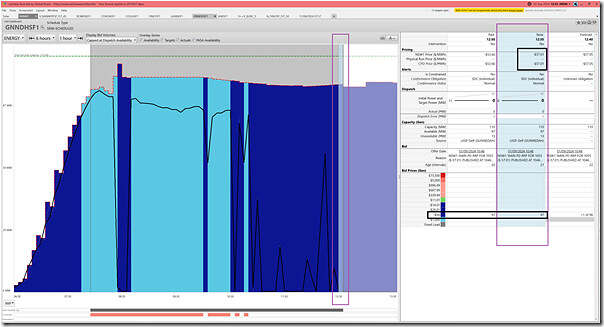
GNNDHSF1 (Gunnedah Solar Farm)
Skipping a few in the list, we’ve next selected Gunnedah Solar Farm, which:
1) is similar to BOMENSF1 in that:
(a) It’s also in NSW; and
(b) Also not on the LHS of a Bound Constraint
2) Yet different from the above in that there’s no output.
Here’s the relevant ‘Unit Dashboard’ widget in ez2view:
In this case we see the unit saying that it’s only prepared to pay (up to) $50/MWh for the privilege of generating (presumably its own unique ‘negative LGC’) … but the RRP is below that (and hence the CPD price in the absence of constraints and intervention), so it’s ‘dispatched off’ (or ‘Economically Curtailed’).
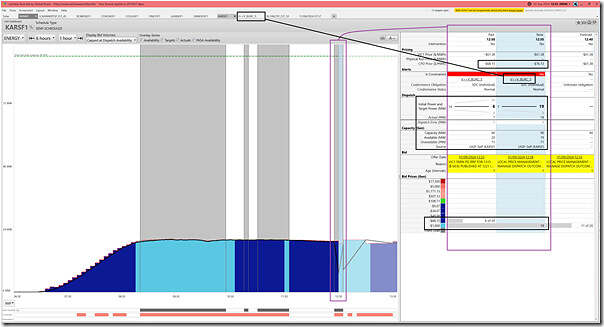
KARSF1 (Karadoc Solar Farm)
Skipping a few more in the list, we’ve next selected Karadoc Solar Farm, which:
1) Is producing some output (indeed it has ramped up, from 12:30 to 12:35); and yet
2) Is on the LHS of a bound constraint.
Here’s the relevant ‘Unit Dashboard’ widget in ez2view:
In this case we’ve highlighted both 12:30 and 12:35 in the table, because:
1) At 12:30 the unit was ‘constrained down’ … although not fully:
(a) It’s Target of 6MW was below its Availability of 20MW
(b) We note the CPD Price of –$68.15/MWh was equal to where the volume was offered in its bid.
2) But for 12:35 a rebid was submitted:
(a) Looks to be an autobidder
… the rebid reasons might suggest one of the auto-bidder vendors we identified in Appendix 22 within GenInsights21 a couple years ago.
(b) Volume was shifted down to the –$1,000/MWh bid band
(c) Which alleviated the impact of this constraint on this particular unit:
i. So we see output ramp back up
… from 7MW to 19MW, which is its Availability, which is set by its own self-forecast.
ii. And makes one wonder where the focus of the constraint has shifted
… i.e. who else has been constrained down as a result?
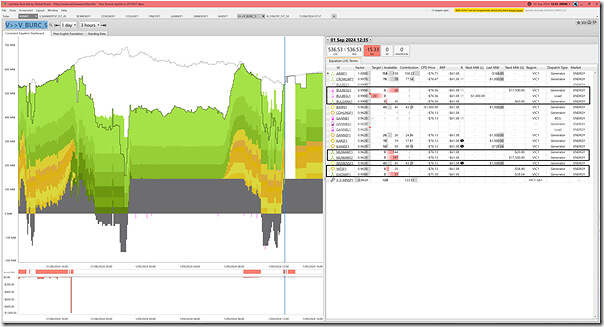
The ‘V>>V_BURC_5’ constraint equation
Clicking through to the ‘Constraint Dashboard’ widget in ez2view, we see that this is the ‘V>>V_BURC_5’ constraint equation mentioned above for BANN1
There’s a wealth of data available in this widget (and it’s only recently been upgraded for a post-IESS world) but I will only highlight a couple things:
1) The ‘Standing Data’ tab explains:
(a) the description of the constraint is
… ‘Out= Buronga to Redcliffs (0X1) 220kV line, avoid O/L Waubra to Ballarat 220kV line on trip of Kerang to Bendigo 220kV line, Feedback’;
(b) its one constraint equation in the ‘I-BURC’ Constraint Set, which:
i. relates to ‘Out = Buronga to Red Cliffs (0X1) 220kV line’; and
ii. contains many constraint equations …
iii. including the ‘V_BANNERTSF_FLT_45’ constraint equation we saw above.
2) I’ve highlighted the rows with pink colouring for ‘Available’, denoting that there’s capacity available that’s not dispatched (i.e. not covered with a grey bar that’s overlaid for Target).
3) We can see, with reference to several columns in the relevant rows that:
(a) The Bulgana Battery has bid not to be dispatched, in either direction, at this point.
(b) Bulgana Wind Farm has bid such that it would have been ‘constrained down’ … if it had not been ‘economically curtailed’ in the first place
(c) The Murra Warra Wind Farm #1 has been both:
i. Economically curtailed, first;
ii. But, if it had not been (i.e. had RRP been higher), with CPD price below ‘Next MW @’ then it would have also been constrained down
(d) In contrast, with ‘Next MW @’ up at $17,500/MWh the Murra Warra Wind Farm #2 really did not want to get a Target.
(e) Yatpool solar Farm is also bid out of the market.
(f) As is Kiata Wind Farm.
And that’s where we’ll leave these individual examples…
Full list of 110 x Solar Farm DUIDs
Here’s the full list:



Be the first to comment on "Which Solar Farm DUIDs were curtailed at 12:35 on Sunday 1st September 2024?"