A year ago (with respect to the 2023 ESOO), we’d noted that ‘The 2023 ESOO report shows coal unit EFOR is still a significant factor’.
Earlier this week (on Monday 26th August 2024) we wrote ‘Coal-fired unit performance has improved markedly from the ‘dog year’ that was 2022’. At the bottom of Monday’s article we’d written:
‘Some things to watch out for, in the ESOO…
As such, when the 2024 ESOO comes out later in the week, I’ll be interested to see:
1) Whether the EFOR (Equivalent Forced Outage Rate) for coal units has been adjusted from what was assumed in the 2023 ESOO … and, if so, how and why?
2) I’m also interested to see whether the AEMO continues with the approach taken in the past – in which it’s produced a common EFOR for all coal units in a region:
(a) such as noted here for the 2023 ESOO
(b) which, as we can see in the above, is a simplification … so those familiar with the Monte-Carlo processes used in modelling processes such as for the ESOO can think about how that might influence the results derived.’
(A) Information published by the AEMO
So it was with particular interest (when skimming through the 2024 ESOO) to note the following…
(A1) Information published in the 2024 ESOO
We need to skip to Section 3.3 (p53/177) to get to the meat and potatoes of what’s assumed in this run of the model:
‘3.3 Generator unplanned outage rates
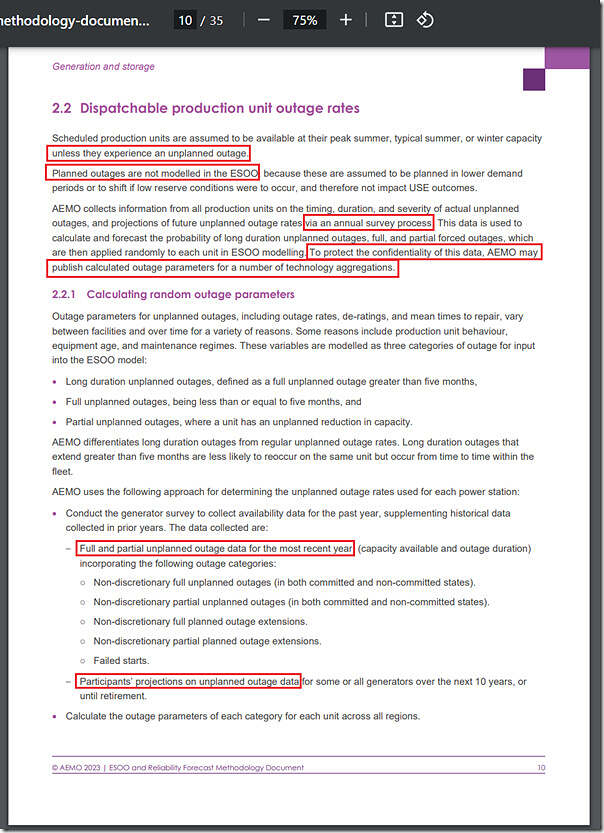
AEMO collects outage information for existing scheduled generators, including storage units, through an annual survey process. This survey collects data on the timing, duration, and de-rating of historical unplanned outages. The collected data is then used to calculate long duration (full unplanned outages greater than five months), full, and partial unplanned outage rates for each financial year and each station over the ESOO horizon. Planned outages are not modelled in the NEM ESOO; AEMO’s methodology reasonably assumes that operators will plan these in lower demand periods, and will shift maintenance events if low reserve conditions were to occur, and therefore will not be a reason for unavailability during events that will risk forecast unserved energy.
AEMO also collected unplanned outage rate projections from the operators for selected coal-fired and large gas-fired generators for each financial year over the ESOO horizon. These operator-provided projections reflect the expected change in performance as generators age, approach retirement, and undergo maintenance cycles. AEMO reviewed these projections against historical outages and consultant derived projections (footnote 73) . In limited circumstances where operator-provided projections are mis-aligned with historical and consultant derived trends, and/or are not sufficiently justified, AEMO applies consultant projections in consultation with each relevant operator.
For all other generator and storage types, the unplanned outage rates applied in the ESOO modelling were calculated from those unplanned outages observed over the last four years (2019-20 to 2023-24) as a constant projection.
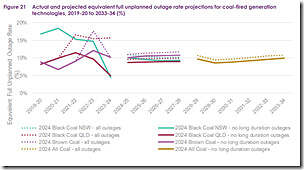
Figure 21 shows the historical and projected equivalent full unplanned outage rates for coal-fired generators (aggregated to protect the confidentiality of information provided by participants). These rates are shown with and without long duration unplanned outage rates. The projection takes into account the generators that are assumed to be included within the generation fleet available in each year, as such improvements in aggregate projected unplanned outage rates for a generation class are mostly due to the expected retirement of units with high outage rates, rather than expectations of improved performance across the asset class.
Historical coal-fired generation reliability showed performance improvement in 2023-24 compared to previous years in New South Wales, while improvements observed in Queensland are offset by increased occurrences of long duration outages.
Relative to the 2023 ESOO, unplanned outage rates for coal generators are lower than previously projected, while unplanned outage rates for gas generators are higher than previously projected. The 2024 Forecasting Assumptions Update provides detailed information on the parameters for unplanned outages for each technology (footnote 74). ’
(A2) In the AEP Elical report from 2020
Footnote 73 references the report ‘Assessment of Ageing Coal-Fired Generation Reliability’ from AEP Elical (from 20th June 2020):
… but I’ve note yet had time to refresh my memory of what’s in there.
(A3) In the ‘ESOO and Reliability Forecast Methodology Document’ from 2023
Footnote 74 references this ‘2024 Forecasting Assumptions update’ which is linked on this subsite (which was the URL referenced at that footnote):
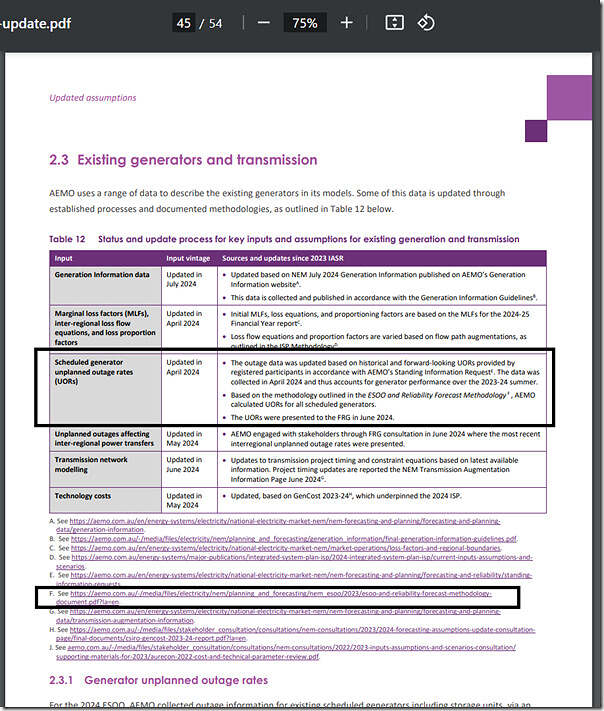
In section 2.3 of this document (from p45) we see the following:
… and section 2.3.1 continues:
‘2.3.1 Generator unplanned outage rates
For the 2024 ESOO, AEMO collected outage information for existing scheduled generators including storage units, via an annual survey process, on the timing, duration, and de-rating of historical unplanned outages. This data is then used to forecast the full and partial unplanned outage rates (UORs) for each financial year, for each generator over the ESOO horizon consistent with the ESOO and Reliability Forecasting Methodology. For small peaking plants and hydro generator technology types, technology aggregates are applied to individual stations. Where AEMO requested participants to provide outage rate projections, these projections were adopted in consultation with the station owners/operators.
Long duration unplanned outages
For the 2024 ESOO, AEMO models long duration unplanned outages (outages with a duration longer than five months) for each region and technology class, using the last 14 years of historical outage data, from 2010-11 to 2023-24, before calculating the forecast UOR.
The long duration outages used in 2024 ESOO modelling, and in other reliability assessments such as Medium Term Projected Assessment of System Adequacy (MT PASA) and Energy Adequacy Assessment Projection (EAAP) , are shown in Table 13.
Unplanned outage rate (equivalent) trajectories (excluding long duration outages)
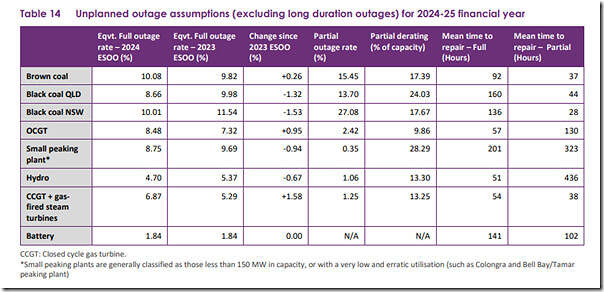
The forecast equivalent full and partial UORs by technology for 2024-25, the first year of the forecast horizon period in the 2024 ESOO, are based on participant-provided information as shown in Table 14. Relative to the values used in the 2023 ESOO, the rates have generally increased for gas-fired and brown coal-fired generators but have reduced marginally for black coal-fired and hydro generators.
The 10-year projections for the equivalent full UOR52 of all technology aggregates are shown in Figure 26, Figure 27 and Figure 28 with and without the effect of long duration outages. The annual equivalent UOR is affected by changes to assumed reliability and retirements of generators over the horizon. To protect the confidentiality of the individual stationlevel information used, UOR projections are provided for the next 10 years for technology aggregates. Due to the small number of coal plant in later years, all regions have been further aggregated to an ‘All Coal’ value to protection confidentiality. ’
Note that the Figure 26 referenced above was Figure 21 shown above from the 2024 ESOO.
(A4) In the ‘ESOO and Reliability Forecast Methodology Document’ from 2023
Table 12 above reference F points to the ‘ESOO and Reliability Forecast Methodology Document’ from August 2023. (i.e. produced in time for the 2023 ESOO, but not updated for the 2024 ESOO).
Inside that document, section 2.3 addresses ‘Dispatchable production unit outage rates’ over 3 pages, with the first (p10/35) being as follows:
On this page I have highlighted several passages. On the 3rd page (p12/35) this section concludes:
‘Note:
• Unplanned outage rates for units without participant provided projections are derived based on the most recent four years of data only. This approximates well the longer-term outage rates seen by most technologies.
• AEMO calculates outage parameters for a number of technology aggregations for the published model to avoid exposing confidential information.’
(B) Subsequent thoughts…
A couple of thoughts as a result:
(B1) No drop in EFOR assumed
After reading through the above, I thought it would be useful to compare the same figures from the prior versions of the ESOO in the following table:
| From the 2024 ESOO | From the 2023 ESOO | From the 2022 ESOO |
|---|---|---|
|
Here’s that Figure 21 (noted above) again:
|
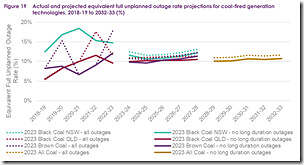
In the 2023 ESOO it was Figure 19: |
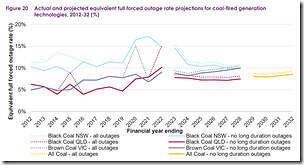
In the 2022 ESOO it was Figure 20: |
Readers should remember that they can click on each image to open in larger view in another tab … but should be able to see that:
1) In the 2022 ESOO the analysis displayed a longer range of history, and the EFOR forecast was below 10% across each region.
2) Undoubtedly part because of the awful performance of coal units through 2022, in the 2023 ESOO the EFOR stepped up, to be around 10% for all 3 regions.
3) In the 2024 ESOO we see that the assumed EFOR is largely the same as in the 2023 ESOO.
… which is interesting, given the improved performance seen in the 18 months to 30th June 2024.
(B2) The reason for region-wide averages
Additionally, the explanation above suggests that:
1) The methodology utilises information submitted confidentially by individual generators – both in terms of historical performance, and projections for the future.
2) Which is the reason why region averages are provided for EFOR.
3) Which means that (for instance) the better performing Loy Yang B gets treated the same as the Yallourn units, which are older and more challenged.
Given that the MT PASA DUID Availability data was enhanced from 9th October 2023, I wonder if this might not be a catalyst to use that data as a means for developing station-specific metrics for EFOR in future years?
(B3) Long duration outages in QLD
Above we quoted where the AEMO had written
‘improvements observed in Queensland are offset by increased occurrences of long duration outages. ’
… so that’s something we might look into further, as time permits (i.e. I can’t think of any long-duration outages beyond Callide C4 (which started 25th May 2021) and Callide C3 (which started 31st October 2022), so I wonder if:
1) The effect was just due to a rolling sampling window (i.e. the 14 years noted above); or
2) If there were other long outages I have forgotten about?
(B4) Gas units
Finally, the AEMO above makes reference to certain large gas units, which we’ve not been looking at so much to date.
‘while unplanned outage rates for gas generators are higher than previously projected. ‘
… something else for us to keep an eye on.
(C) Currently…
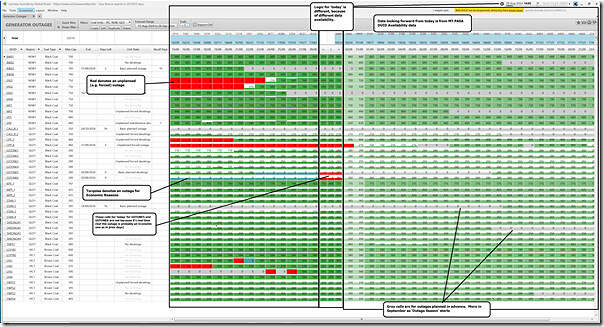
And, whilst we’re talking about coal unit performance, I thought it would be topical to share this filtered view of the ‘Generator Outages’ widget in ez2view from the 14:00 dispatch interval this afternoon:
What’s particularly notable for me is that (excepting the forced outage at Callide C4 – which only has a day or two to go) none of the the other 43 coal units operational in the NEM have forced outages currently, or have near-term schedule for forced outages.
At the risk of jinxing things, I might note that (I believe) that’s the first time I’ve seen that in the couple of years that we’ve been providing the ‘Generator Outages’ widget in ez2view!



Leave a comment