Back on 14th May 2023 we wrote the article ‘We’re not building enough replacement dispatchable capacity’.
1) That article ran in parallel with the completion of GenInsights Quarterly Update for 2023 Q1 and gave a sneak peak of some of the analysis included in that report.
2) In that article:
(a) We included a long-term trend of annual peak requirement for firming capacity
…. but note that just yesterday we posted ‘(Update of) long-term trends of (the high points of) Aggregate Scheduled Target’ to provide an updated view of this requirement
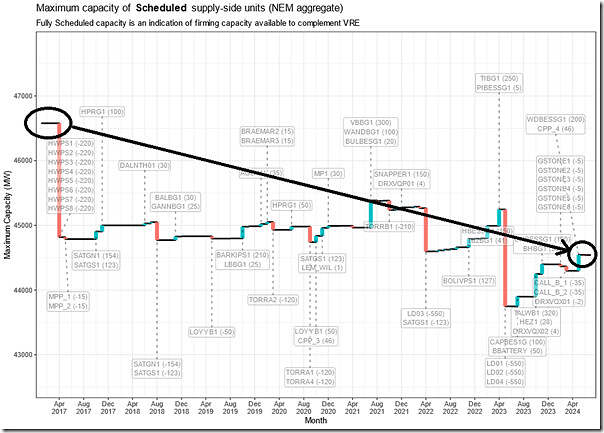
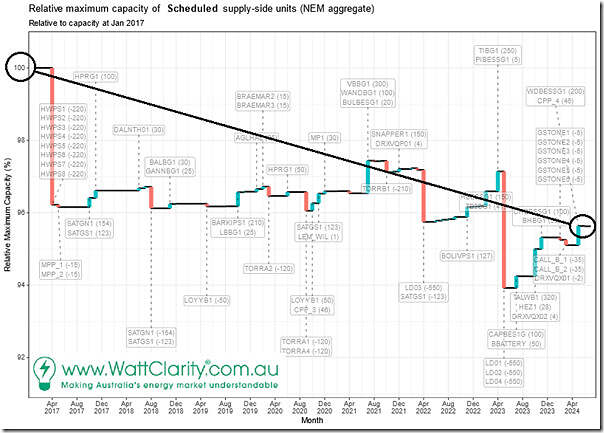
(b) From the (not yet released) review of 2023 Q1, we posted two ‘waterfall diagrams’ looking at changing amount of installed capacity on a NEMwide basis since the start of 2017 (i.e. just prior to the closure of Hazelwood):
i. In the first diagram we extended out into early 2023, so as to show the impact of the looming closure of Liddell units 1, 2 and 4 (as absolute megawatt (MW));
ii. In the second diagram we translate these changes to relative terms (i.e. based on 100% capacity starting at the start of 2017).
Preceding the article above, the Federal Government had announced the creation of the Capacity Investment Scheme … which was (at that time) fully focused on provision of Firming Capacity.
1) about a year after the commencement (on 23rd November 2023) the Federal Government announced the expansion of the scheme;
2) but it’s important for readers to note that:
(a) the vast majority of the headline expansion of the scheme (i.e. from 6GW to 32GW in installed capacity) was focused on providing another mechanism for VRE;
(b) whereas the expansion of support for Firming Capacity was much more modest than might have been inferred by some stakeholders (i.e. only 6GW to 9GW increase in support).
3) There are other thoughts by several authors posted about the Capacity Investment Scheme collated here.
(A) An updated ‘Waterfall Chart’ of installed Firming Capacity
In each edition of Appendix 4 within GenInsights Quarterly Updates we have updated the waterfall diagrams (i.e. absolute and relative) noted above, in order to give clients an updated view.
Given that over a year has elapsed* since posting the article above (hence 5 updates to GenInsights Quarterly Updates under the bridge), we thought it might be time to share some updates to these charts
* and, under the water, various energy sector ‘ducks’ have been paddling like crazy to progress various developments of Firming Capacity
(A1) Change in installed Firming Capacity to 30th June 2024 (in absolute terms)
In this updated trend, we see we’re well past the closure of Liddell … and approaching 8 years past the closure of Hazelwood:
As we see in the chart, with the ups and downs in the 7.5 years since the closure of Hazelwood, the current status is that we’re down ~2,000MW of firming capacity (i.e. more than what we lost when Hazelwood closed) as at 30th June 2024.
(A2) Change in installed Firming Capacity to 30th June 2024 (in relative terms)
In relative terms, we see that we’re down (over) 4% of the installed capacity base of Firming Capacity in the post Hazelwood world:
(B) Looking forward to projected additions and withdrawals (three different perspectives!)
In more recent editions of Appendix 4 within GenInsights Quarterly Updates we have extended these ‘waterfall diagrams’ into the future to take a look at where we’re projected to land – taking into account both:
1) Looming retirements of coal (and other thermal) assets; and
2) Additions of new forms of firming capacity.
However, it’s important for readers to understand that there are (at least!) three different perspectives about what type of projects-in-development should be included in these forward projections. Through this article we hope readers will become more aware of the pros (and cons) of each of the following three perspectives … and some readers might like to suggest 4th and 5th perspectives in the comments below as well.
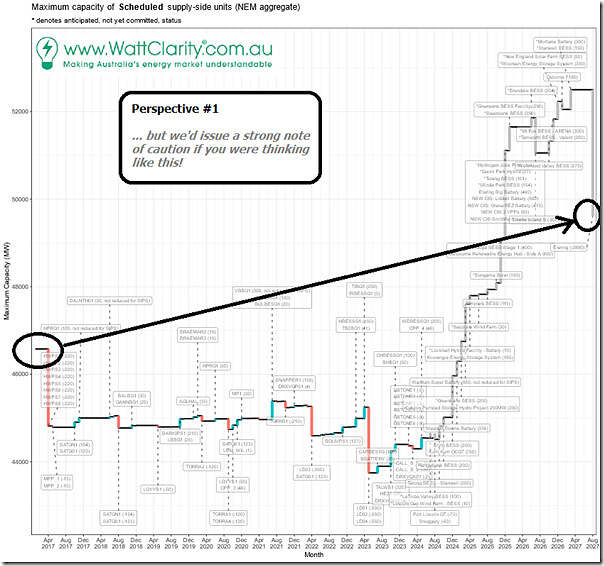
Perspective 1 = that some might like to use
Extending the projection out to the (new, delayed closure of Eraring date in 2027) we could (and indeed, some others will) produce a chart looking like this:
When presented with a view like this:
1) readers can clearly see a net increase of ~3,000MW of installed over 11 years (from 2017 to 2028);
2) so might conclude that everything’s hunky dory … or at least that we’re on the right track.
However we’d issue a strong note of caution – including for reasons outlined below.
Perspective 2 = isn’t it more realistic to just consider additions that are (fully) Committed?
Keen eyed readers on the chart above will note that it includes (on the additions side) a number of different projects that have been named in various support mechanisms (such as in the Capacity Investment Scheme) but which have not (yet?) met all of the AEMO’s criteria to be deemed (fully) Committed.
1) The AEMO uses the term ‘Anticipated’ for these projects
2) It’s been reported in other locations that there are phantom projects that have existed in spreadsheets for long periods of time:
(a) which have some form of Government support established in principle
(b) but with no sod being turned in the years that have followed.
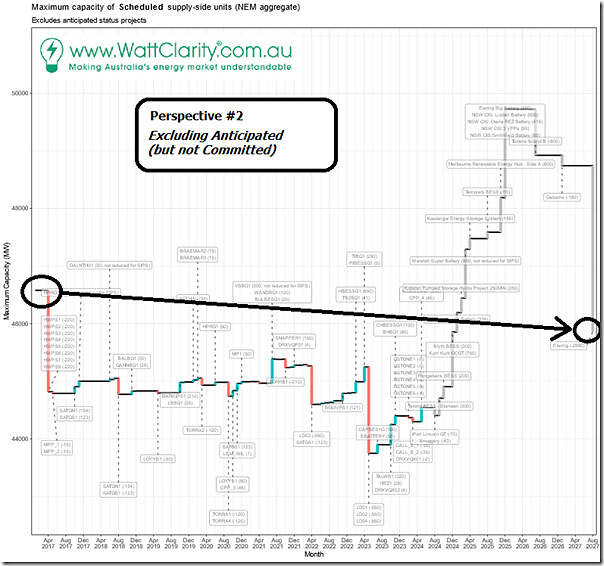
So we wonder what the projection above would look like if we excluded those (i.e. Anticipated, but not Committed) projects:
Clearly there’s a difference between Perspective #1 (increase of ~3,000MW) and Perspective #2 (drop of ~500MW).
That’s not to say that either perspective is ‘wrong’ … just hoping to illustrate that each projection could yield a different narrative (especially if it were to be handed down on a tablet from on high, passed around, and then viewed by a devotee two or three steps removed from the messiah).
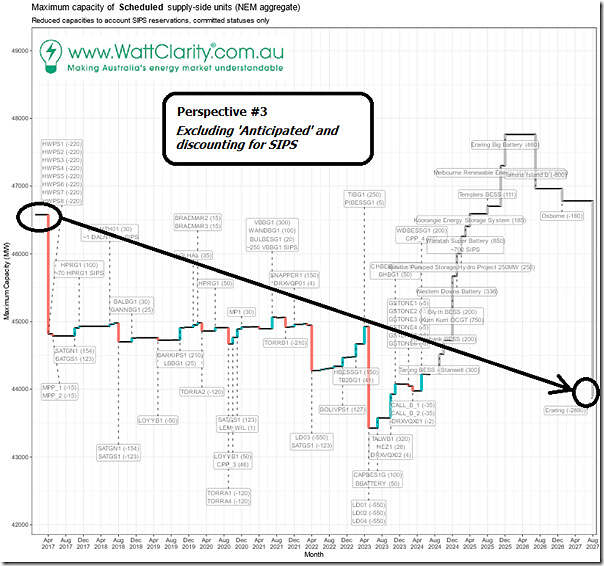
Perspective 3 = what assumption should be made about SIPS?
But wait, there’s more…
On 24th March 2024 we published ‘A focused look at operations at Victoria Big Battery (VBB) on Tuesday 13th February 2024’, containing some key considerations:
1) In the article in which we showed how the Victorian Big Battery (which has a notional Maximum Capacity of 300MW) only exported a maximum of 55MW through the major disruption to the Victorian grid on 13th February 2024.
2) To be clear, this happened even when AEMO was instructing Load Shedding (i.e. Actual LOR3) through periods of the afternoon.
3) The reason for this appears to be:
(a) Not a lack of charge in the battery; but rather
(b) Because the other (unused) capacity was specifically reserved for the purpose of a System Integrity Protection Scheme (i.e. SIPS)
4) Readers should be crystal clear that they should definitely not infer from this that anyone associated with the battery did anything ‘wrong’!
5) Rather …:
(a) I highlight this example to wonder what capacity should be assumed from a Reliability Perspective at any of the (growing) number of batteries across the NEM that are being built in part because of a large reservation of some capacity for different forms of SIPS?
(b) Surely it would be logical (and prudent) to exclude (from the installed capacity of the battery) any share of that capacity specifically reserved for SIPS?
So that is what we have done in the chart below presented as Perspective #3 (i.e. layering on what we did in Perspective #2):
… and what a big difference that makes!
Compared to Perspective #1 (which suggests an increase of ~3,000MW) we see a reversal in Perspective #3 (a decline of ~2,500MW … or by more than we lost when Hazelwood closed).
So would it be true to conclude that we’re still not building enough replacement Firming Capacity?
(C) Questions for later in the week…
Tomorrow (on Thursday 29th August 2024) we expect that the AEMO will release its 2024 ESOO.
Amongst the things we’ll be looking to understand when we plunge into the ESSO include:
1) The extent to which AEMO separates from its modelling the requirements for VRE (which is really about energy production) and Firming (which is about Capacity and Insurance)?
2) If Firming is separately discussed, what AEMO has to say about the level of requirement?
3) Specifically, which of the three perspectives is closest to what the AEMO promotes as the ‘base case’ view of the future development of Firming Capacity?


Firming capacity is classified by AEMO as shallow (less than 4 hours energy storage), medium (4 to 12 hours) and deep (over 12 hours). The Capacity Investment Scheme is primarily enabling shallow energy storage.
The government owned deep storage projects of Snowy 2.0 Pumped Hydro (2,200 MW) and Borumba Pumped Hydro (2,000MW) are unlikely to make their indicated full operational dates of December 2028 and September 2031. A Final Investment Decision is yet to be made on Borumba PH yet AEMO has classified it as an anticipated project for the ISP.
Its not just IF we have enough firming capacity its also IF there is sufficient medium and deep storage and what IF medium and deep storage is not operational by 2030 when the Capacity Investment Scheme has enabled another 23,000 MW of Variable Renewable Energy.
A question:
Last week the Victorian Government published its Cheaper, Cleaner, Renewable: Our Plan for Victoria’s Electricity Future which included “nation-leading storage targets of at least 2.6 gigawatts (GW) by 2030 and 6.3GW by 2035. Curious to know what are the medium and deep energy storage projects that will be operational in Victoria by 2028 ie by the time the 1,450 MW Yallourn power station closes?