
Wind generation has been back in the spotlight in recent weeks, and for two very different reasons.
On the public front, several proposed wind projects have run up against growing community pushback – most visibly through a recent Four Corners episode (“The Wind Wars”), and also via a widely circulated Conversation article in which a group of academics raised biodiversity concerns about a number of Queensland proposals.
On the operational front, the existing wind fleet across the NEM has been dealing with a pronounced ‘wind drought’ since April – something we’ve been tracking closely here on WattClarity, with subsquent coverage from the AFR and RenewEconomy.
These two threads aren’t directly connected in the short term, but they do need to be thought about together as the transition deepens, particularly with today’s release of the AEMO’s 2024 Integrated System Plan.
Taking a closer look at Q2 wind performance might offer a useful, real-world glimpse into the challenges emerging for our power system mid-transition.
Operational pressures on the energy system this winter
Throughout Q2 we’ve seen several episodes of supply–demand tightness in the electricity market. Prolonged wind lulls have been a clear contributor, but they haven’t been the only factor: colder weather has lifted heating demand, hydro output has been relatively low, and coal generation is up.
The combination of the last two factors suggests there may also have been some upward pressure on emissions this quarter. Our annual analysis of Q2 outcomes in the coming weeks will explore the economic impact of these factors in more detail.
The gas market has also faced a squeeze, culminating with the AEMO issuing a ‘Risk/Threat Notice’ for the east-cost gas system last week. As with the electricity market, multiple factors are in play — and others such as David Close have offered perspectives on the structural issues in gas production and storage (i.e., beyond GPG). Paul has also outlined several upstream and downstream caveats for gas supply in his analysis here.
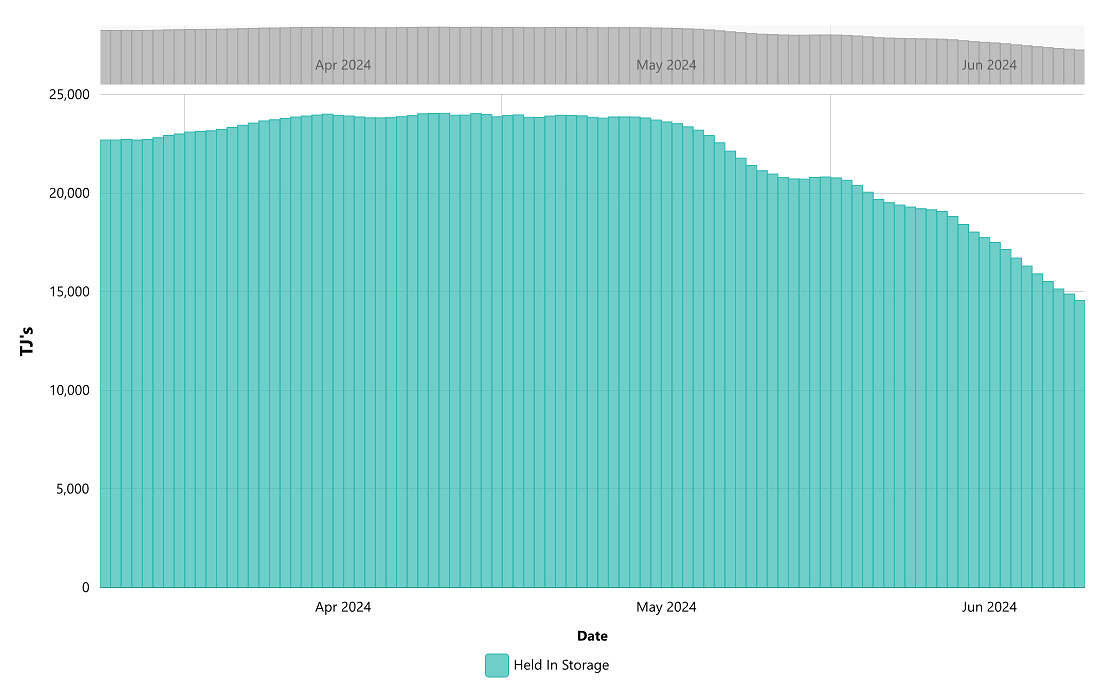
Storage levels at the Iona Underground Gas Facility have fallen sharply since mid-May compared to last winter. Lower-than-expected output from the Longford gas production facility has also contributed to the AEMO issuing a gas system ‘Risk/Threat Notice’.
Source: AEMO
Understanding this season’s wind lulls
Taking inspiration from Paul’s ‘worm’ charts – in the video below I’ve animated a rolling 3-day cumulative trend of total production, and have also added spatial data to track production by location (also shown on a 3-day rolling cumulative basis).
There are two reasons why I’ve chosen to analyse the data in this manner:
- to highlight the fluctuating nature of yield from the NEM’s wind fleet as it is currently composed, but also;
- to underscore the challenges in satisfying volume, spatial, and ramping requirements – for gas and/or long-duration storage – in a future grid that will eventually depend on VRE to function. A challenge that is hard to imagine will be solved by the current fleet of ‘big’ batteries, which all have a duration of ~2 hours or less.
A view of the 3-day rolling cumulative wind generation trend shows four distinct wind lulls over a span of 2.5 months.
Data source: NEMreview
The animation attempts to show two different dimensions of data at the same time (i.e. space and time), so I’d recommend that viewers make use of the pause button to better understand both dimensions at each point.
There are many moving parts in a system-wide view, but I’ve attempted to annotate four distinct wind shortages over Q2 (where the rolling total dipped below a 15% capacity factor for consecutive days), with approximate dates:
- Wind Lull #1 (13th April to 20th April): Underperformance of wind farms in VIC, NSW, and parts of SA.
- Wind Lull #2 (13th May to 18th May): Underperformance of wind farms in SA and VIC.
- Wind Lull #3 (22nd May to 28th May): Underperformance of wind farms in VIC, SA, NSW, and parts of TAS.
- Wind Lull #4 (5th June to 11th June): Underperformance of wind farms in QLD, SA, and TAS.
The occurrence of successive wind lulls, reinforces the conclusions published in a WattClairty piece two years ago by Geoff Bongers, Nathan Bongers and Andy Boston – how seasons of low wind and solar will influence what system we need to design for.
In order to help our readers compare this to ‘typical’ wind production, the capacity factors for all semi-scheduled wind farms for last calendar year (on a monthly basis) are shown in the chart below. This chart was included in our recent presentation to the Clean Energy Council back in May.
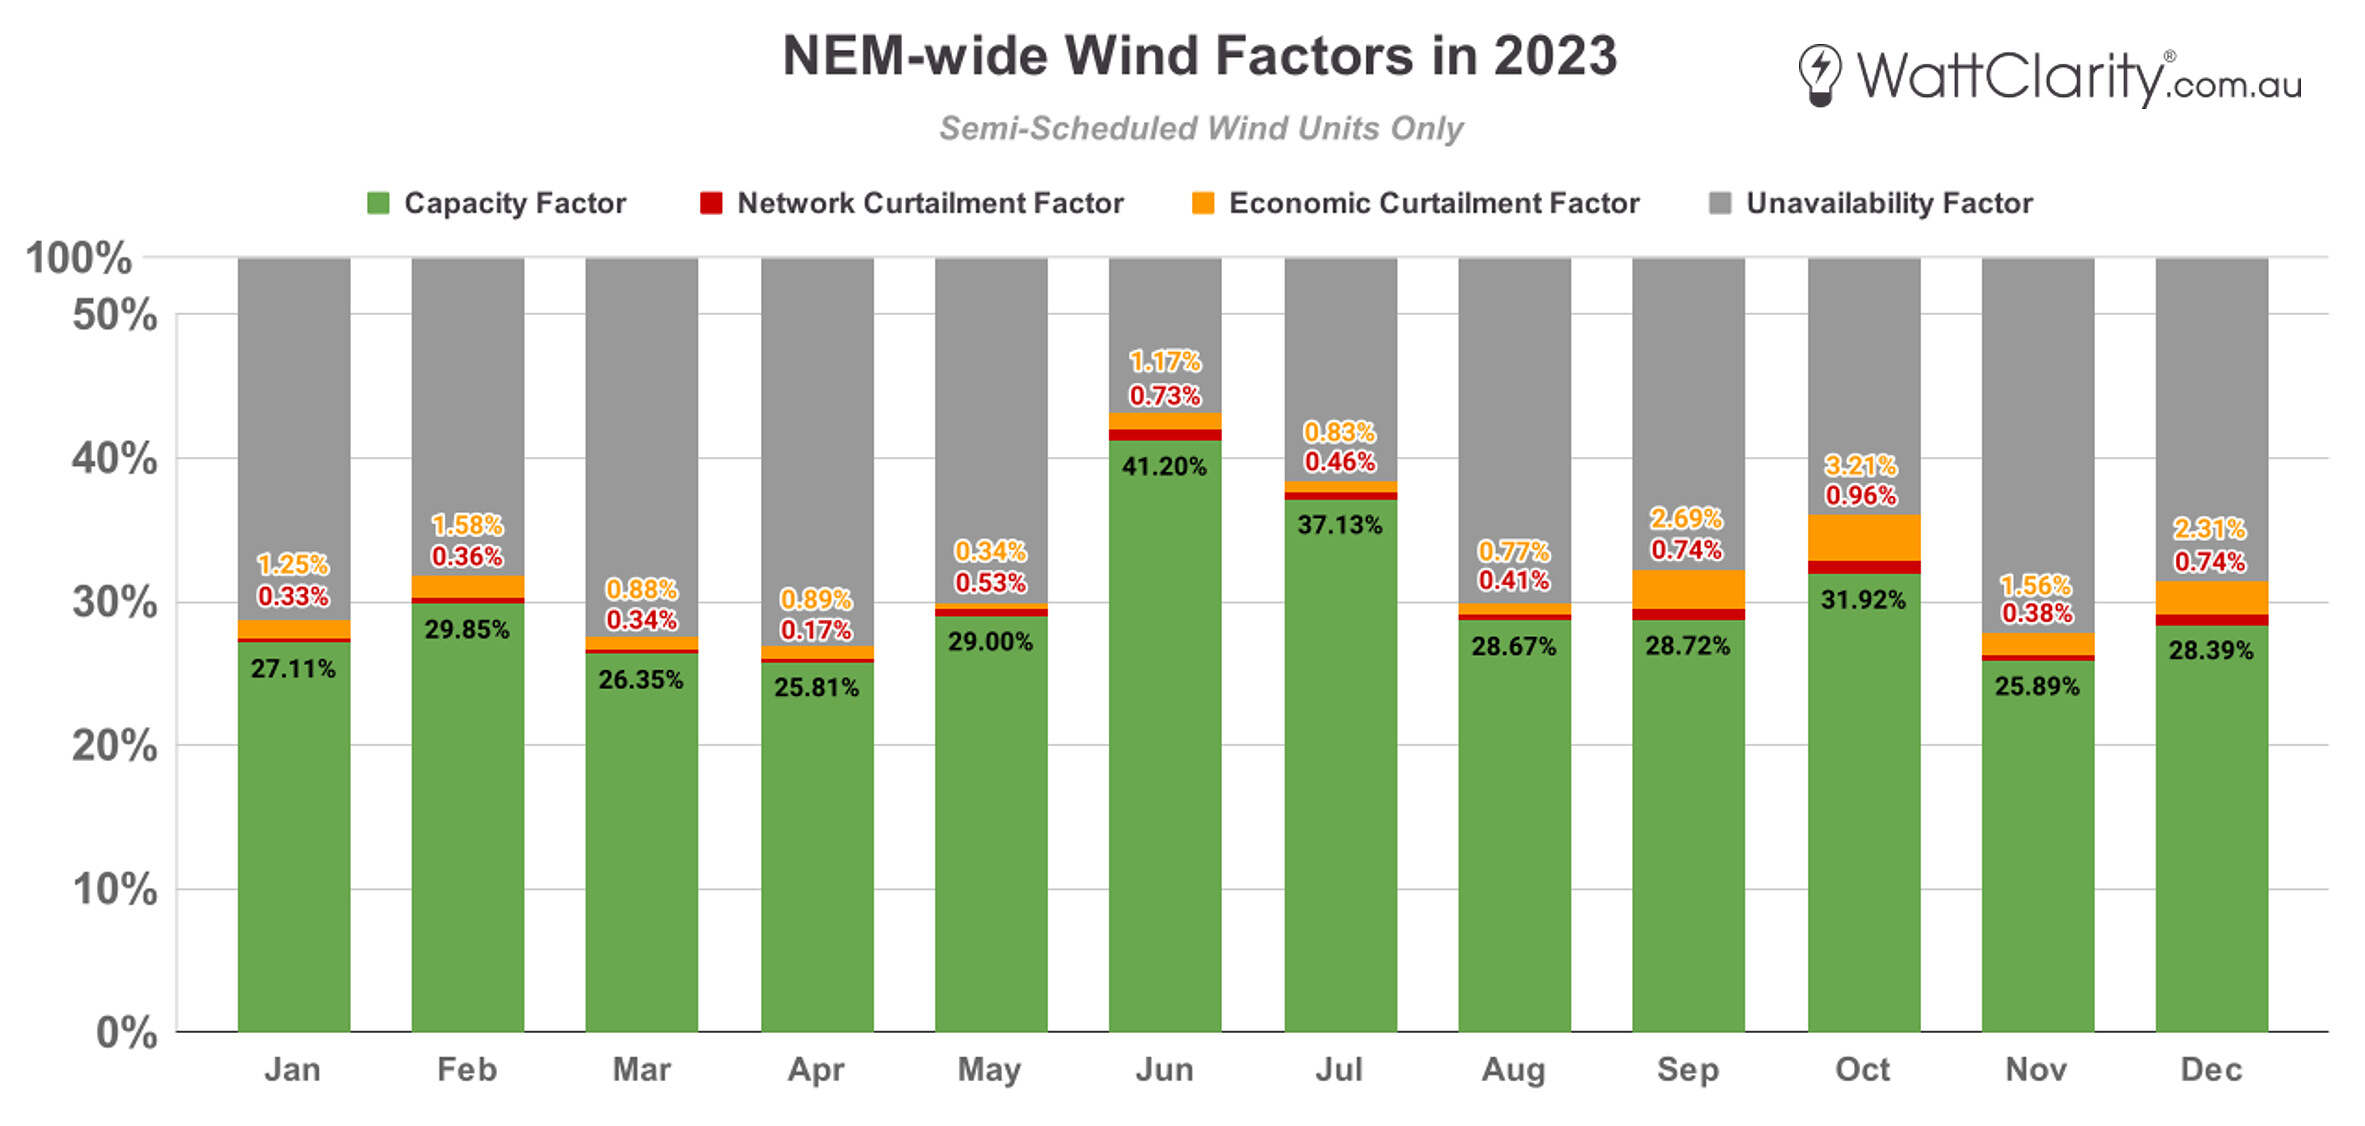
For comparison, fleet wide capacity factors in 2023 were markedly higher in April (25.81%), May (29%) and June (41.2%), compared to what we just saw in Q2 2024.
Source: GSD2023
I’ll also note that the earlier animation in this article only covers production (i.e. output) and not availability (a better reflection of available wind resource). Transmission outages and other network constraints have also been impacting wind production, particularly in NSW, perhaps most notably on May 8th – although that individual occasion did not coincide with the wind lulls mentioned above. Paul has covered other reasons why wind output may have been suppressed in a longer article posted last Saturday.
Key Takeaways
With wind making headlines for the wrong reasons in recent weeks, I hope this analysis offers some finer detail on how these lulls have actually unfolded. I’ll finish with two brief takeaways from my vantage point.
- We’re still at a point in the transition where we should prepare for the ‘dunkel’ and the ‘flaute’ separately. ‘Dunkelflaute’ is a german phrase now synonymous with periods of simultaneously low solar and low wind production. It has loose translation into English as ‘dark’ (Dunkel) ‘lull’ (Flaute). Whilst there are significant challenges when both happen simultaneously, Q2 has given us some evidence that each separately are still important in their own right.
- Wind resource diversity has system-wide value. However, as we’ve written about ad nauseam — don’t mistake this for saying that this diversity will solve all of the challenges.
Most years in the non-summer months, we typically have two periods of low wind output combined with low solar output which last around 5 days. However this year has been different as it has been low wind output combined with low rainfall on top of a drought in Tasmania, meaning much less hydro output from there. Conditions from a year like this are one of the most challenging to solve in a future 100% RE grid as the typical projected storage and up scaled RE won’t solve it.
There are several factors that will assist, but resolve the problem. Victoria needs much more utility scale and rooftop solar in the mix of RE generation. It will require a significant over build of solar due to the poor performance during the winter months, but this appears to be one of the cheapest options.
A doubling of capacity of the QNI flows into NSW is potentially a good solution, but not cheap and complex on the NSW side of the connection. The addition of BESS at multiple points would be required to increase the carrying capacity of the existing links in addition to upgrades of substations. This of course assume QLD continues to build out VRE sufficient to have excess.
Additional wind and solar in Northern NSW is another option, but of course this is where there is great resistance to this, particularly wind.
None of that fixes the problem ofhe wind not blowing across the NEM at pwriods when solar isn’t producing.
The fact that we have over 11GW of wind energy capacity and it was producing just 88MW shows oversupply of capacity doesn’t fix the fundamental flaw of renewables meaning you can’t guarantee output.