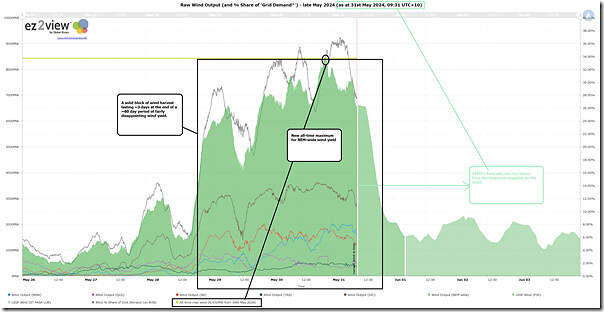
Late on Tuesday, the weather gods pulled the plug at the bottom of the bath that was holding the stubborn high pressure system blocking wind patterns across the NEM for much of April and May 2024. The increasing gurgling sound coming as that system drained away was the sound of increasing wind harvest patterns:
1) began on Tuesday 28th May; and
2) gained a boost on Wednesday 29th May and
3) reached a new all-time maximum point late on Thursday 30th May;
4) before declining – gently at first, with the forecast for this afternoon (Friday 31st May) to be a steep fall in output.
That leaves a solid block of output spanning ~3 days at the end of a ~60 day period that was notably disappointing in terms of yield. We can see this in this trend here from the ‘Trends Engine’ within ez2view:
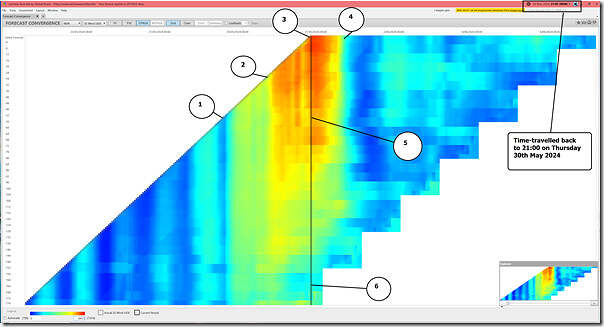
Another representation of the same wind yield pattern is this colourful grid view from the ‘Forecast Convergence’ widget within the ez2view software, which we’ve time-travelled back to the 21:00 dispatch interval on Thursday , which was the dispatch interval at the end of which the new all-time maximum point was set:
Remember that this widget allows the user to ‘look up a vertical’ in order to see ‘that other dimension of time’.
I’ve annotated this image with 6 numbers – with 4 points matching the notes above and the other two points being as follows:
5) Late on Tuesday 28th May, the AEMO’s ST PASA forecasts for NEM-wide UIGF for Wind was that the capability to produce power from wind would be ramping up to a maximum of around 7,000MW late on Thursday evening 30th May 2024. Indeed, if you trace your finger down that vertical to the start of the brighter colours, you can see why it was Monday 27th May morning that we were able to write ‘There might be a sustained burst of wind generation to finish off the month of May 2024’. So:
(a) Roughly three days out, AEMO had some foresight that we were going to see a ramp up in wind yield;
(b) And as at Tuesday 28th May, the forecast yield capability (7,000MW) was only 1,400MW below what the yield actually turned out to be.
(c) So perhaps some stakeholders might think ‘not too bad’, in terms of a forecast.
6) However if we wind back another ~4 days to early Friday morning 24th May (i.e. ~7 days before the peak in wind on Thursday 30th May 2024):
(a) we see that the AEMO forecast for aggregate wind yield capability would be roughly ~2,200MW (so down in the ‘blue’ zone).
(b) so a massive miss by ~6,200MW of what the yield was going to be, 7 days in advance.
Now different readers will have different perspectives of what the above picture means for the predictability of the wind resource … with perspectives perhaps different as a result of the different hats that they might be working (e.g. concerned about system reliability and/or security, or focused on particular commercial merits/risks relating to particular projects (either VRE or firming).
… glass half full, or glass half empty?


General scale predictions of wind are fine as can be seen from my comment on your article from Wednesday 29 May now being realised. Just this morning we have already seen 3GW of wind capacity reduction between 8am and 11am.
The reality is that wind and solar are unreliable. You can’t have a system where you just randomly start producing 3 Hazelwood equivalents of power and then 2 days later it all just dissapears.
We are on the precipice of collapse of the NEM because of how volatile the energy generation mix is so everyone is producing to ensure the lights stay on, which drives up wholesale costs which flow o to retail costs.
Given there is almost no storage in the market yet, I think you are grossly overstating the problem.