On Tuesday we noted that the ‘NEM-wide wind lull stretches extends to a full week (Tue 16th April 2024), and has another week to go!’, which followed from Monday’s article about ‘Low wind production on Monday morning 15th April 2024’.
1) That’s led to a bit of discussion online
2) Looking at the ‘Forecast Convergence’ widget in ez2view now (no image included here), it seems AEMO’s more recent ST PASA and P30 predispatch forecasts have NEM-wide Wind UIGF picking up sooner than earlier forecasts.
So the lull might be shorter lived than was noted on Tuesday morning.
Looking back a couple weeks
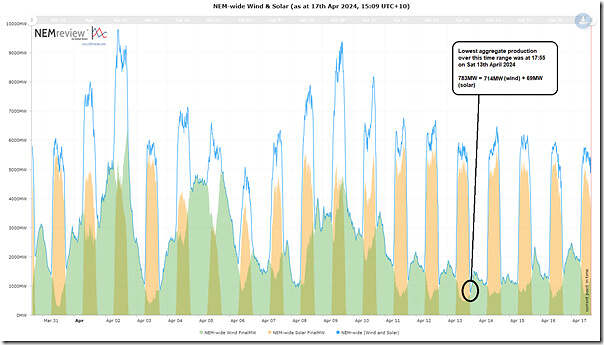
Using the NEMreview v7 application, here’s a trend of aggregate Large-Scale VRE production across the NEM:
The way it looks at the moment, the lowest point for aggregate Large-Scale VRE would be the 17:55 dispatch interval on Saturday 13th April 2024. Note that:
1) This looks to be the lowest aggregate Wind + Large Solar (at 783MW);
2) But it should be clear that:
(a) The contribution from wind at the time (at 714MW) may not be the lowest in the time range; and also
(b) The contribution from solar (at 69MW, almost at sunset) won’t be the lowest in the time range.
3) Further, it should be noted that this time may not be the time of peak firming requirement (i.e. we’ll look more systematically at Aggregate Scheduled Target when we compile GenInsights Quarterly Update for 2024 Q2 in a few months).
But an interesting timepoint, none-the-less.
Drilling into 17:55 on Sat 13th April 2024
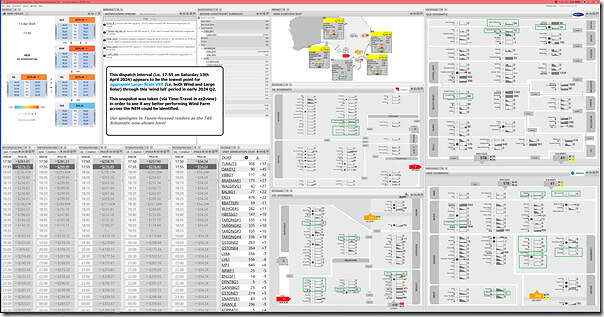
Using a large screen dashboard to ez2view, I’ve grabbed this image time-travelled back to 17:55 on Saturday 13th April 2024 with the main purpose being to see if there were any particular wind farms across the NEM that were performing with reasonable or high capacity factors:
With this one, definitely click on the image to open in larger screen view in order to be able to read!
With this display:
1) I’ve highlighted on the ‘NEM Map’ widget the contributions from each of the regions:
(a) QLD (132MW) + NSW (60MW) + VIC (198MW) + TAS (127MW) + SA (196MW).
(b) so no region had relatively high performance.
2) On the 4 x Regional Schematics shown (apologies for not also showing TAS) I have manually highlighted some of the wind farms that jumped out at me on a quick scan
(a) remember my purpose to find any wind farms that were performing well
(b) alas all of them appeared to be ‘running on fumes’.
Nothing more, at this point – but more might come later (e.g. perhaps when we’re compiling GenInsights Quarterly Update for 2024 Q2 in a few months).


Leave a comment