Let’s start this article by reminding readers of Linton’s excellent explanation about ‘What inputs and processes determine a Semi-Scheduled unit’s availability’.
Distilling from this article, there are three sources of the Availability figure that could be used within the NEMDE dispatch process (it can get a lot more complicated upstream of this, as Linton’s article shows). These three sources are tabulated below.
| When was this source introduced? | Headline | Details |
|---|---|---|
|
from 7th Aug 2023 |
MaxAvail in the Bid |
On 7th August 2023, following requests from a number of stakeholders (including Marcelle here) the AEMO implemented a small but significant change for Semi-Scheduled units, in enabling them to utilise the MaxAvail field in the standard bidding process to provide the market notice of physical limitations with respect to their Solar Farm or Wind Farm.
… there’s a growing series of articles about this change accumulating under this Category on WattClarity®. Just yesterday we published the short article ‘How many Semi-Scheduled units have taken advantage of the market change that went live on 7th Aug 2023?’.
|
|
from Sept 2019 |
A participants Self-Forecast (if they use one) |
Trials of Self-Forecasting were commenced with the coordination of AEMO and ARENA – with ARENA calling for expressions of interest on 28th March 2018 from various parties. From September 2019, suitably approved Self-Forecasts were allowed to substitute for the AEMO-developed forecasts in AWEFS and ASEFS. Since that time, we’ve been collating a number of articles written on this site under the Category ‘Self-Forecasting for Semi-Scheduled units’. |
|
31st March 2009 |
AEMO sourced information (e.g. AWEFS or ASEFS) |
This Glossary Page about the ‘Semi-Scheduled’ Registration Category provides much more detail about this category, which came into being on 31st March 2009. For the commencement of this category, the AEMO began producing an Unconstrained Intermittent Generation Forecast (UIGF) for each individual Wind Farm and Large Solar Farm that exists in the NEM for each dispatch interval: 1) In the early days this was a service that was contracted in from a third party service provider; but 2) From 23rd Nov 2022 this service was upgraded as a result of being brought in-house. |
At Global-Roam Pty Ltd, we’ve been taking an increasing interest in the operation of Semi-Scheduled units over a number of years, including:
1) Through GenInsights Quarterly Updates, including (as part of Appendix 3); and also
2) Via the Generator Statistical Digest, with the most recent issue (the GSD2023, released on 15th Feb 2024) including a focused section in Volume 1 specifically focused just on Semi-Scheduled units.
3) Plus other recent initiatives (more on them later …)
Just yesterday we published the short article ‘How many Semi-Scheduled units have taken advantage of the market change that went live on 7th Aug 2023?’. Today we take a similar look at the second leg of this three-legged stool, with respect to the adoption of self-forecasts.
Self-forecasts possible from Sept 2019
As noted above, Semi-Scheduled DUIDs have been able to utilise self-forecasts in the NEMDE dispatch process since September 2019.
Indeed, this process has been actively encouraged by AEMO and other organisations (such as ARENA).
Given the encouragement, we’ve also been taking an increasing interest in self-forecasting as one particular aspect of (hopefully!) making the Semi-Scheduled category work more effectively….
Using the GSD2023 Data extract
With the recent release of the GSD2023 on 15th Feb 2024 (just over 4 weeks ago), we’ve been presented with an easy way to take this next look at how much utilisation this new market change has been seeing from the range of Semi-Scheduled generators to whom it was directed.
A 49% (actual) participation rate, through 2023
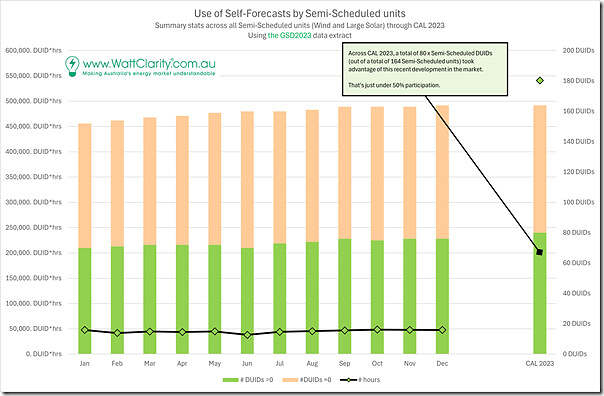
In this first chart we highlight (in green) the number of Semi-Scheduled DUIDs that utilised self-forecasts in the NEMDE dispatch process through each month of 2023:
Whilst each month is shown (on the left), the annual aggregate for 2023 is shown on the right of the chart. This highlights that, through all of 2023:
1) 80 x Semi-Scheduled DUIDs had self-forecasts used in dispatch for at least part of the year; which means
2) There were 84 x DUIDs remaining that did not use self-forecasts at all.
3) On those numbers, this was a 49% participation rate.
So we continue to look for more…
A 49% (actual) participation rate, through 2023
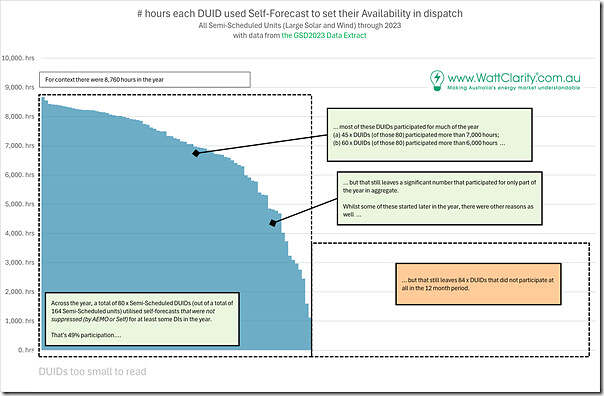
Counting up the ‘hours in use’ across all 164 Semi-Scheduled DUIDs, and sorting in descending order of application, we see the following:
In this chart there are the two blocks of DUIDs:
1) The 80 x DUIDs with some non-zero bars showing some participation; but also
2) The ‘invisible’ 84 x DUIDs on the right.
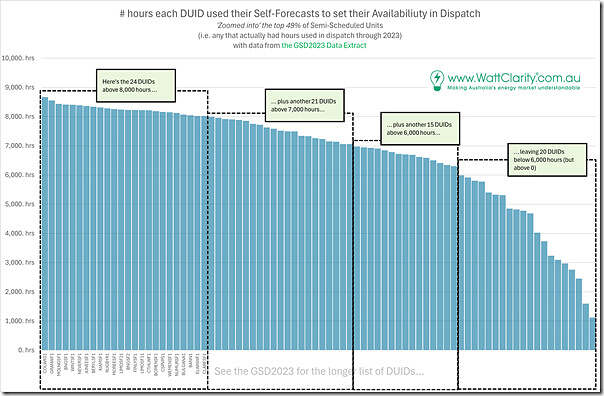
Zooming into just the 80 x DUIDs on the left we see the following:
We’ve highlighted this group in 4 bundles:
Bundle 1 = the 24 DUIDs (with names listed) with self-forecasts used in dispatch more than 8,000 hours through the year;
Bundle 2 = the 21 DUIDs (names obscured) with self-forecasts used more than 7,000 hours, but less than 8,000 hours.
Bundle 3 = the 15 DUIDs (names obscured) with self-forecasts used more than 6,000 hours, but less than 7,000 hours.
… so with Bundles 1, 2 and 3 representing 60 DUIDs (or only 37% of the total list of Semi-Scheduled DUIDs) using self-forecasts in dispatch more than 68% of all dispatch intervals in the year.
Bundle 4 = another 20 DUIDs (names obscured) with self-forecasts in use, but less than 6,000 hours
… presumably at least some of these being in commissioning, and/or having their self-forecasts in commissioning.
But reality is more complex than that…
At this point, it’s worth reminding readers of some complexities of the self-forecasting process (and in assessing self-forecasting performance) as described by Linton in his article “Delving deeper into dispatch availability self-forecasting performance” on 14th April 2023.
In particular we will highlight here that, whilst an organisation might submit a self-forecast for a dispatch interval (or actually might submit multiple … though that’s a whole other can of worms), that does not guarantee that it will be used in dispatch. Indeed, there can be quite a difference, as we show below, because:
1) The self-forecast might be self-suppressed … and that this might be:
(a) by the vendor (more about them later),
(b) by the generator, or
(c) by the generator’s agent (e.g. an organisation like Overwatch Energy Pty Ltd, of which we have been a shareholder since 2019)
2) The self-forecast might also be suppressed by the AEMO.
… in Linton’s article, he explains how this works.
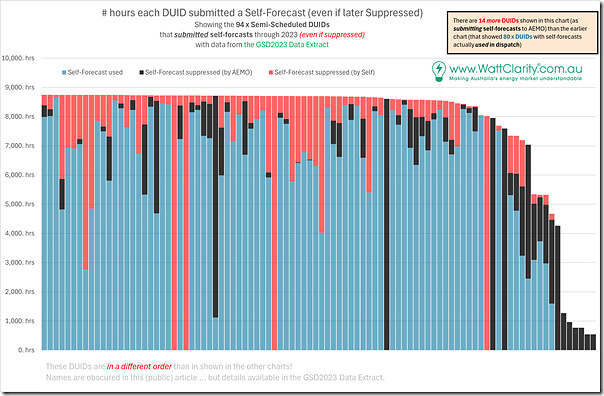
We can clearly see in the improved sort order below that only a subset of self-forecasts actually make their way through to the dispatch process. This is shown for calendar 2023 in this expanded sorted chart here (again from the GSD2023 Data Extract):
Readers should be sure to note that:
1) There are 14 more units listed in this chart than in the two sorted charts above
2) The sort order is different than that shown in the charts above;
3) In this case there is a higher number of units who have been consistently submitting self-forecasts (i.e. 76 x DUIDs submitting for more than 8,000 hours in 2023) than there were with self-forecasts actually being used (i.e. only 24 x DUIDs with self-forecasts used more than 8,000 hours).
… that’s only 32%! (i.e. 24/76)
4) We can clearly see that there are some units who have been ‘AEMO suppressed’ for a significant percentage of the year:
(a) 3 x DUIDs were AEMO suppressed for 100% of the dispatch intervals they submitted through the year … despite submitting for more than 7,000 hours!
(b) Another 6 x DUIDs were also AEMO suppressed for 100% of the dispatch intervals submitted through the year:
i. where submitting less than 1,300 hours (right hand end of the chart)
ii. without looking further, these would seem to be commissioning?
5) On top of this, there have been instances where units have been significantly ‘self-suppressed’ for a significant percentage of the year:
(a) 4 x DUIDs were AEMO suppressed for 100% of the dispatch intervals they submitted through the year … despite submitting for more than 7,000 hours!
(b) Many more self-suppressed for a significant percentage of (a large number of hours in which they submitted) self-forecasts.
There’s clearly more pieces to this puzzle!
Reasons for self-suppression become murky …
We’ve written before about some practices that a number of NEM stakeholders see as dubious, in relation to the selective use of self-forecasts.
With this new data set in the GSD2023, we’ve enabled clients to drill into more detail of the extent to which self-suppression was used, and whether this was in periods in which Semi-Dispatch Cap flag status was TRUE or FALSE. That’s one other dimension of analysis.
But that’s enough here for now …


Leave a comment