Late in the day, on Thu 29th Feb 2024, I constructed my own derivation of ‘Underlying Demand’ to be able to note that that ‘NSW Underlying Demand peaks at 15,100MW at 15:00 (NEM time) on Thu 29th Feb 2024′.
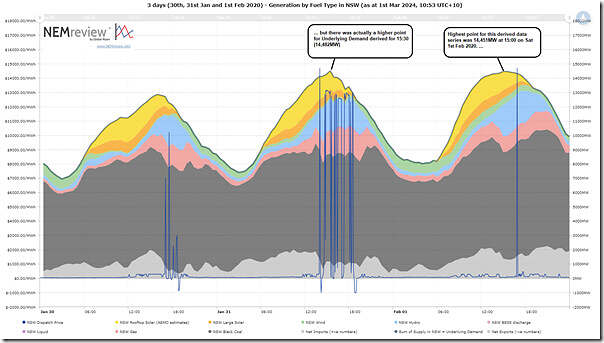
Curiosity has gotten the better of me again today, so I’ve wound the clock back to 1st February 2020 (which saw highest demand measured by ‘Market Demand’ during summer 2019-20). Using the same query construct in NEMreview v7 I’ve prepared this view of trended Underlying Demand for Thu 30th and Fri 31st January and Sat 1st February 2020:
Those with a licence to the software can open their own copy of this query here.
From that chart we see that:
1) On Sat 1st Feb 2020 the highest point for Underlying Demand was 14,451MW at 15:00;
2) But there was actually a higher point on Fri 31st Jan 2020 (14,481MW at 15:30):
(a) this occurs with a spike in some of the underlying data.
(b) this spike has not been investigated.
Either way, these points were below that derived for Thu 29th Feb 2024.


Leave a comment