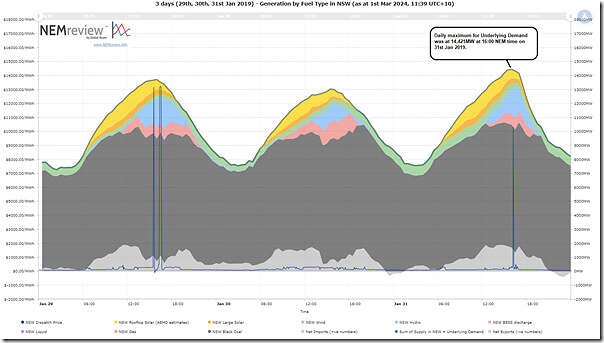
As we have earlier done for 30th and 31st January and 1st February 2020, in this article we’ve reused my own derivation of ‘Underlying Demand’ to take a look at what happened with demand by that measure back on Thursday 31st January 2019, because that’s when there was a high point for ‘Market Demand’.
Here’s the three day trend, produced using NEMreview v7:
As per prior articles, those with a licence to the software can open their own copy of this query here.
From that chart we see that the highest point was at 14,421MW for the half hour ending 16:00 (NEM time) on Thursday 31st Jan 2019.
This point was below that derived for Thu 29th Feb 2024.


Leave a comment