
This post constitutes penance for a somewhat contrary LinkedIn comment I made on Paul’s earlier post “NEM-wide demand has been quite low through summer 2023-24 (at least to date)”. For ease of reading, I have copied my comment in here:
“The summer has been unusual with some very high maximum demands in Qld and a few solid days in NSW but nothing to speak of in the southern regions. So, few days of high peak NEM-wide demand.
But if you focus on average underlying consumption, or energy used, across the NEM for Nov-Jan – including supply from rooftop PV – then this summer has seen the highest level for at least six years, up by more than 4% on 2022-23. The duck’s belly might be growing fatter but its tail and beak aren’t dropping.”
If nothing else, our different takes emphasise the many varying ways used to measure and characterise “demand” in the NEM (this article contrasts just two – but there are more).
Paul highlighted the fact that this summer has so far yielded few days with high NEM-wide “Market Demand”, specifically focussing on maximum levels for this measure in any five-minute dispatch interval.
I countered by claiming that NEM-wide consumption (or average demand) of electricity – including energy produced by rooftop solar installations – has reached its highest level for at least the last six November-January periods, in effect saying that “NEM-wide demand has been quite high through summer 2023-24 (at least to date)”.
This being the NEM, both these apparently opposing views can be simultaneously correct. A bit like Schrödinger’s Cat being both dead and alive.
Definitions – boring but necessary
I’ll focus on two specific demand measures:
| Operational Demand | This is the “official” version of grid-level demand published by AEMO.
It’s a half-hourly average of output from (almost) all large-scale grid-connected generators (which AEMO can measure directly), but it doesn’t include production from the millions of small-scale rooftop solar installations (“distributed PV”) which also supply the energy consumed by households and businesses. It also subtracts any energy consumed by “market scheduled loads” (pumped hydro and large-scale batteries), effectively making it net grid-level supply. |
| Underlying Demand | This is obtained by adding onto Operational Demand AEMO’s estimates of half-hourly rooftop solar production, yielding an estimate of total supply “from both ends of the grid”.
It’s necessarily an estimate, since there is no way to physically measure actual production from those millions of solar systems. AEMO’s small-scale solar estimates use extrapolation of measured real-time output from suitable samples of systems to produce an aggregate value for each region of the NEM. Others on WattClarity have written about the opacity of rooftop PV data before – such as Paul here in December 2019 (noting that the APVI estimates changed after that point to be more closely aligned to the AEMO estimates, though still not the same). |
Paul’s post focussed on “Market Demand” which differs only slightly from operational demand in that:
- it excludes production from a few large(-ish) grid-connected generators whose output is not controlled via central market dispatch (“non-scheduled” generators), and
- it’s determined every five minutes as part of the market dispatch process, and
- it’s calculated at the start of the dispatch interval (as the target for what market generators need to collectively meet), whereas operational demand is a ‘backward-looking’ half hourly measurement.
For most practical purposes operational and market demand track very closely although the actual values of maximums and minimums always differ because of their slightly different bases.
On the other hand, “Underlying Demand” can exhibit quite different trends and levels from its grid-level cousins because it tries to account for the increasing amount of electricity consumption that is supplied by rooftop solar (about 11% for the NEM as a whole over calendar 2023).
As a more holistic measure, underlying demand tells us about how much energy consumers of electricity (excluding market scheduled loads) are actually using. Grid-level demand (operational or market) is equally important, but for different reasons, as it dictates requirements on the large scale supply side of the market.
So has demand this summer been low, or high?
Paul was right
Definitions out of the way, here’s a view of half-hourly operational demand on the top three “summer” days over each of the last nine years – I’ve defined “summer” very broadly as running from November through March, since high demand days can occur in the outlying months. The days selected are the three with the highest daily maximum demands for each year.
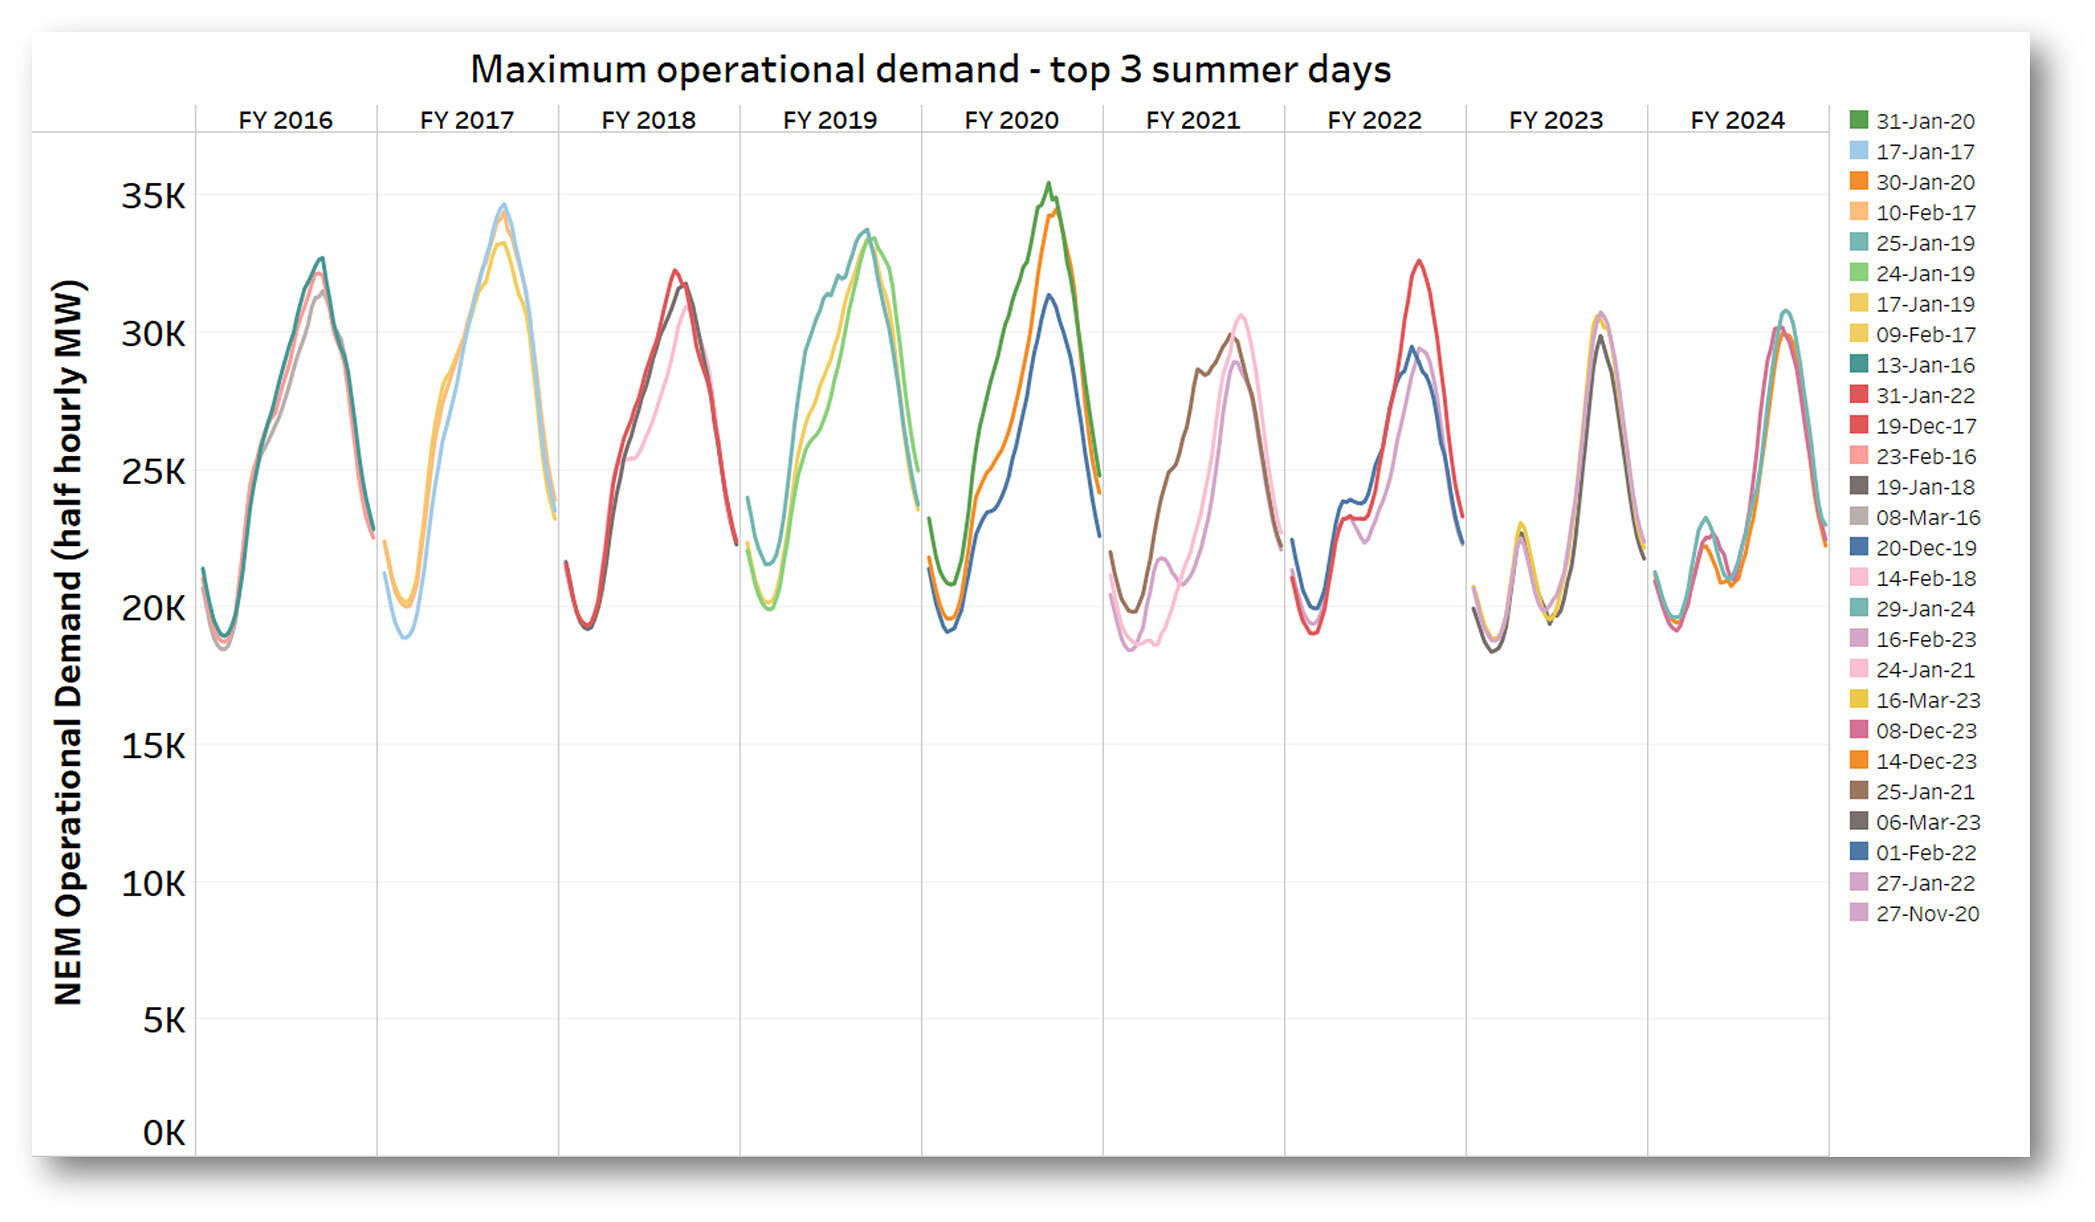
This tends to support Paul’s claim about this summer (to date) having “quite low” NEM-wide grid-level demands, with half-hourly operational demand sneaking over 30 GW on only a couple of days, compared to pre-pandemic summers where NEM-wide operational demand peaks exceeded 32 GW, reaching a maximum of 35.4 GW back on 31 January 2020 (just before storms came through and tumbled the Heywood interconnector).
There may well have been higher operational demand peaks in prior years – I haven’t checked.
I was right too
But if we look through the “total consumption” lens of underlying demand, and average that across summer months (which correlates with total electricity used rather than short-term peaks in demand), we get a different result.
Remember that a megawatt (MW) is a rate whereas a megawatt-hour (MWh) is a measure of volume (such as consumption).
- I have shortcut the process of calculating consumption by showing average demand (whereas Paul focused on peak demand in his article) …
- You’d need to multiply by 2,208 (the number of hours from 1st November to 31st January inclusive) to translate the average megawatt readings in the chart below to the total consumption (in MWh) over the period, but this would not change the relativities.
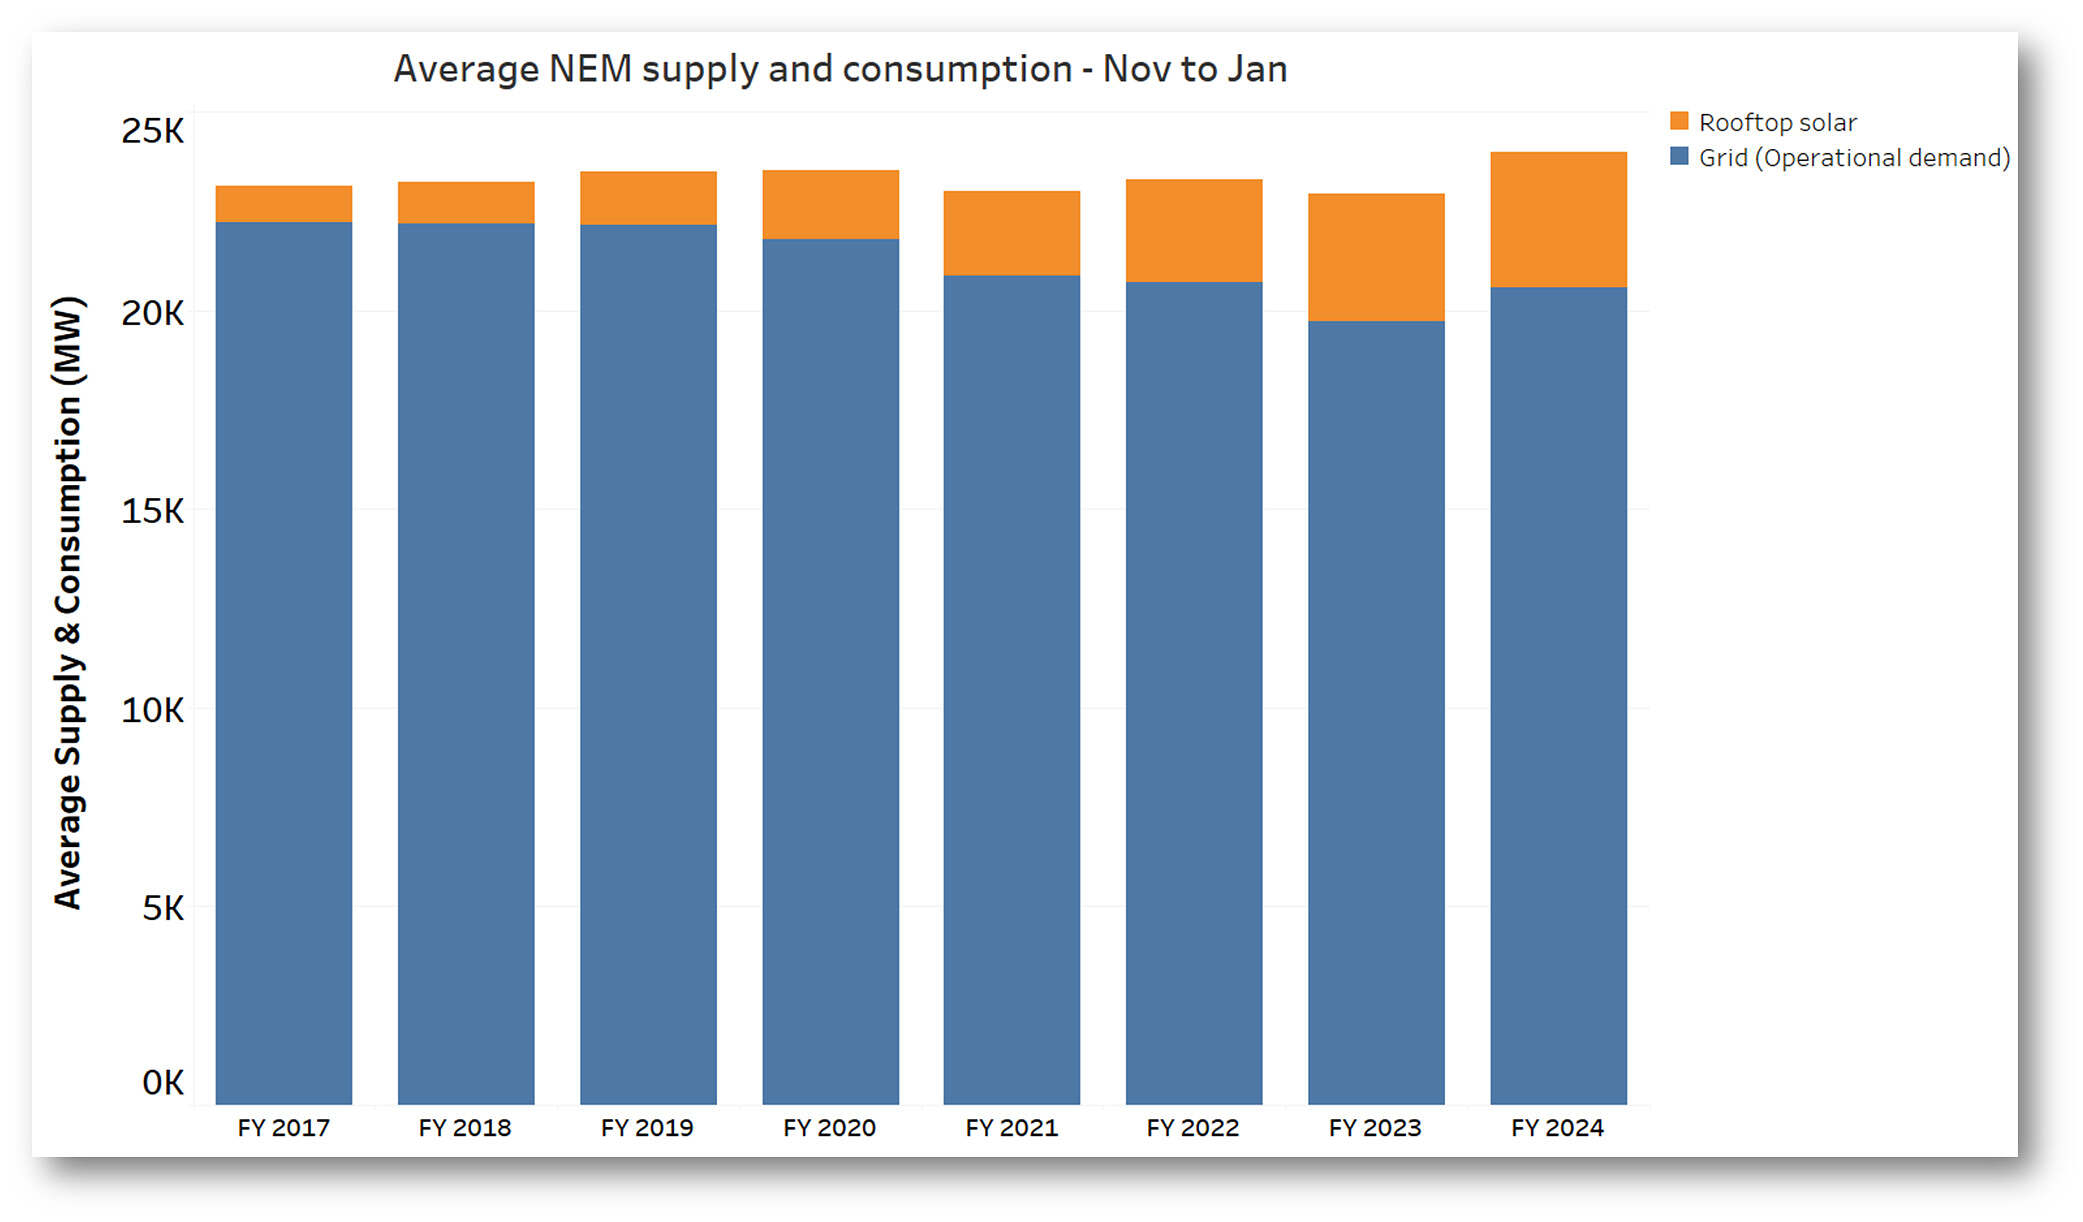
I can only readily go back to 2016/17 for this measure as AEMO’s half-hourly rooftop solar estimates begin in May 2016. I’ve also restricted the months averaged to November-January so that we’re comparing 2023/24 on a consistent basis with prior summers.
This shows us that while average operational demand (the blue component) hasn’t been high this summer – in fact the second lowest level for the last eight years – the continued growth of rooftop solar output means that this summer (so far) is comfortably in the lead for consumption (or average electricity demand).
A shandy chaser
I’ll finish by looking at a blended measure – using Paul’s “daily NEM-wide maximum” metric but applied to consumption – underlying demand – rather than grid-level demand. This reveals what peak levels of total electricity use have been doing, including that part of the peak met by rooftop solar. The absolute peaks here are quite a bit higher than those for grid-level demand shown a couple of charts back – so rooftop solar is knocking off a significant slice of summertime peak consumption that would otherwise have to be supplied from the grid.
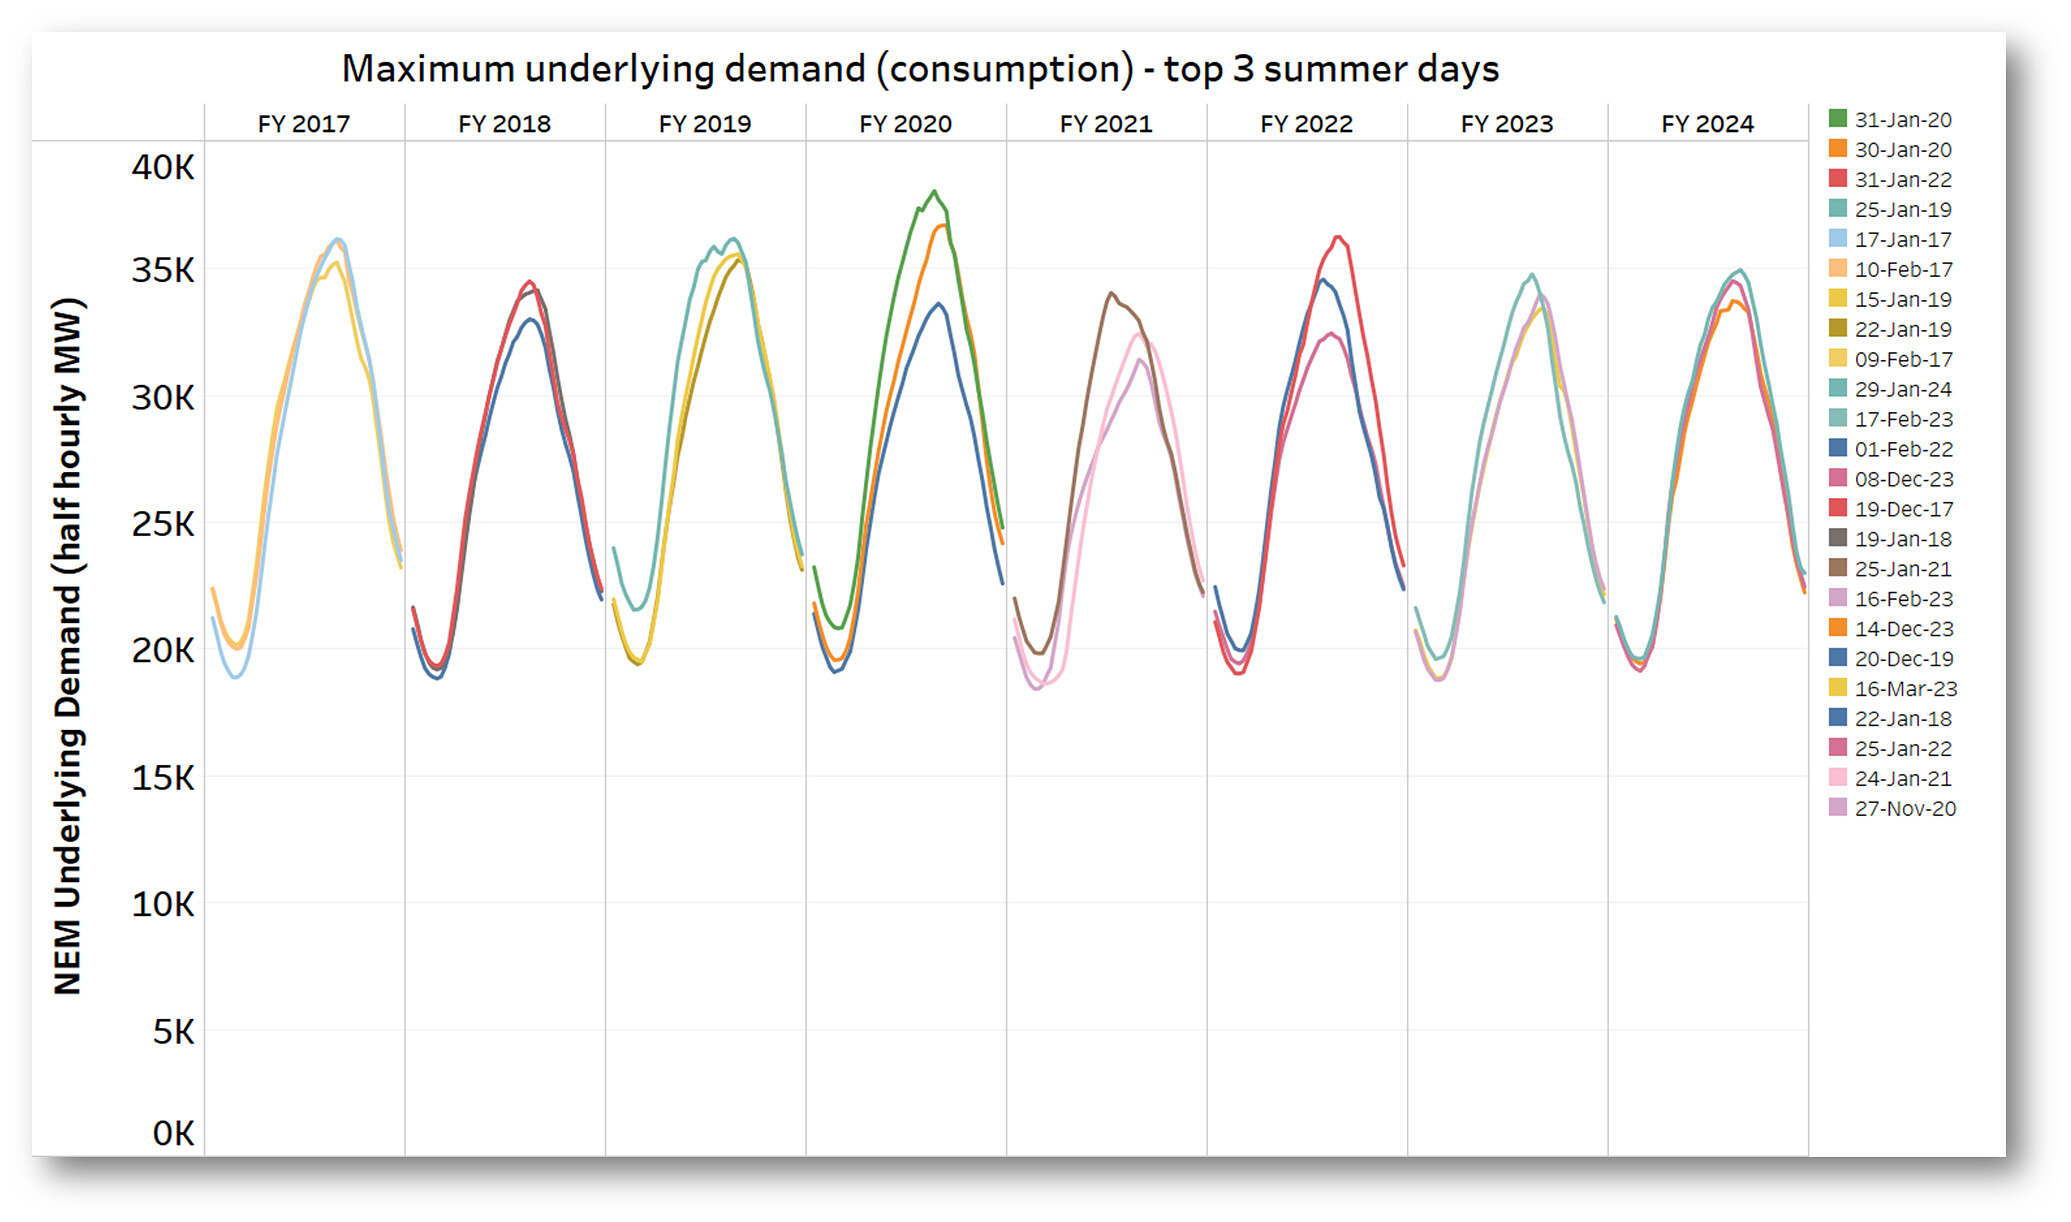
The quick take out from this shandied measure is that the maximum levels of underlying demand seen so far this summer are pretty much in the middle rank of recent years. Kind of an average – or quantum superposition – of Paul’s and my own conclusions.
=================================================================================================
About our Guest Author
 |
Allan O’Neil has worked in Australia’s wholesale energy markets since their creation in the mid-1990’s, in trading, risk management, forecasting and analytical roles with major NEM electricity and gas retail and generation companies.
He is now an independent energy markets consultant, working with clients on projects across a spectrum of wholesale, retail, electricity and gas issues. You can view Allan’s LinkedIn profile here. Allan will be occasionally reviewing market events here on WattClarity Allan has also begun providing an on-site educational service covering how spot prices are set in the NEM, and other important aspects of the physical electricity market – further details here. |
As the price has increased over the years there would be some reduction in demand at the margins as some people will economies. That would moderate the increase in demand that we expect from population growth.
Another type of demand management is the closure of firms on the margin of survival in energy-intensive industries. The result is deindustrialization that is happening bigtime in Britain and Germany!
https://newcatallaxy.blog/2023/07/18/lets-all-follow-germany/
Considering “operational demand” and “underlying demand, what is the data at “Annual generation capacity and peak demand – NEM” showing us? 2024 peak is looking low in this data which agrees with the analysis presented here. From that data, the peak demand was in 2010-2011, it is difficultto tell by looking so i downloaded the csv data to Excel. 2019-20 came close but fell short of 2010-11 by a considerable amount. Depending on what the overall peak is for 2024, I would say there is a downward trend in this data, flat at best.
There are other charts too. For example, “Annual electricity consumption – NEM” which paints a similar picture, and this one shows a significant downward trend from 2010.
These are all nice and pretty graphs. The real question should be “What is happening with the NEM to cause prices to rise at close to 100% over a period of flat or falling demand?”
There’s ample analysis published on drivers of NEM prices – a good place to start is AEMO’s Quarterly Energy Dynamics reports at https://www.aemo.com.au/energy-systems/major-publications/quarterly-energy-dynamics-qed
But a major factor in the long term increase in NEM prices (from the 1999-2012 period) is the increasing linkage and exposure of generation costs – specifically fossil fuels – to international energy prices. Another factor has been the retirement of ageing coal-fired capacity. Replacing old, fully depreciated capacity with new generation of any form is generally going to require higher prices to justify the new investment.