Today (Thu 29th Feb 2024) promised to be one with tight supply-demand balance … and it did deliver some excitement, including:
1) a high point for demand in NSW, whether you measure it by ‘Market Demand’, or try to estimate ‘Underlying Demand’).
2) and plenty of volatility in NSW and QLD.
etc…
Coincident with anticipations of what might happen, on Wednesday evening Angela Macdonald-Smith and Samantha Hutchinson wrote about ‘Power market in the dark as negotiations over Eraring drag on’ in the AFR:
In that article and with respect to forecasts for today, they write (with respect to the Eraring Power Station, which is slated to close in 2025):
‘A squeeze on the NSW power grid forecast for Thursday amid a blast of late summer heat has underscored the vital role the generator, on the Central Coast, still plays.
Thursday’s heat represents one of the first serious tests to the state’s energy infrastructure during what is regarded as a milder-than-usual summer.’
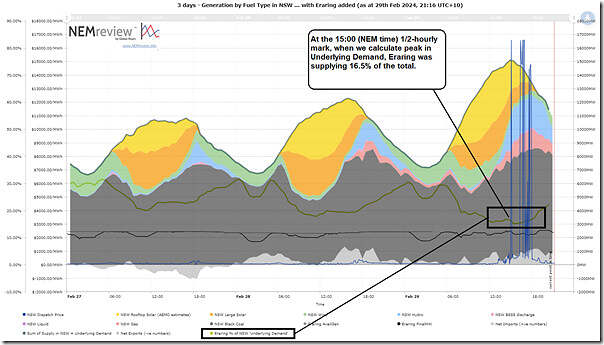
Noting this (but also remembering that I’d flagged some possible concerns with 3 of 4 Eraring units in relation to today) I took the chart prepared in our NEMreview v7 software for the preceding article, and added in Eraring Power Station to see …
Eraring supply of Underlying Demand was a low of 16.5% at time of peak demand
Into this chart I added three new data series:
1) Aggregate output of the 4 x Eraring units, which extends through to the ‘now’ point of the chart because I chose to use FinalMW and not Target;
2) Available Generation for the 4 x Eraring units, which stops at 04:00 because that’s the end of the ‘next day public’ data set; and
3) The percentage ratio of Eraring output to Underlying Demand … again on a half-hourly basis keeping in line with the methodology for how I calculated Underlying Demand.
Here’s the updated chart:
Likewise, those with a licence to the NEMreview software can open their own copy of this separate query here.
From this chart we can see a few things:
1) Output from Eraring is fairly consistent across the three days
… dropping somewhat below Available Generation for the 4 x units at times when ‘Grid Demand’ is lower (i.e. at night, or in the middle of the day).
2) We can see the contribution from Eraring to meeting (much more variable!) Underlying Demand in the region ranges from high points somewhat above 30% (e.g. at times of low demand) down to a low point:
(a) That is always above 15%; and
(b) Which was 16.5% at the 15:00 half hour period which we calculated was peak in Underlying Demand.
3) We can’t see data for Available Generation beyond 04:00 this morning at present, but we can see the output of Eraring was a little more variable throughout all daylight hours today. We won’t really know why that was the case until we can see the ‘next day public’ data – but I could speculate that it might be a combination of any of these…
(a) Capability of the unit (i.e. Available Generation) affected by higher ambient temperatures ?
i. remembering that almost all types of technology are affected by high ambient temperatures …
ii. hydro being one exception where the data does not support short term limitations – albeit the longer term implications in terms of drought conditions.
(b) It might have been the capability of the unit was affected in some other way (i.e. not related to temperature)?
(c) It might be that there were constraints (external to the unit) that affected output in some way?
(d) Or it might have been commercial behaviour?
(e) Something else?
I’ve leave the chart there, but also worth noting that …
… the above does not consider other essential services
Readers should keep in mind that this quick analysis only covers ‘Energy’ – it does not cover the grab-bag of other services we loosely labelled ‘keeping the lights on services’ when we spoke about the emerging schism way back when we wrote the GRC2018 a number of years ago now. Some of these include:
1) The (now 10) different FCAS commodities.
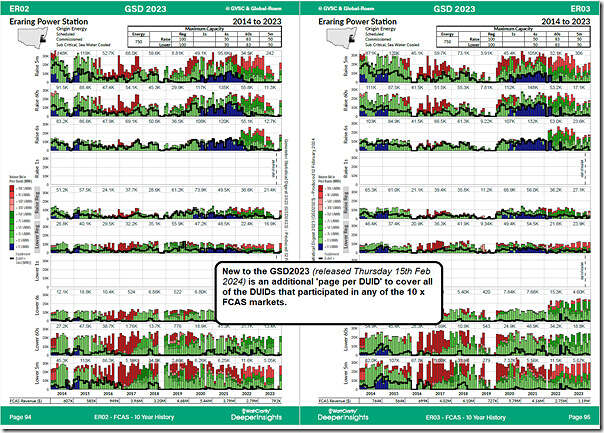
… On this note I took the opportunity to open up the recently released GSD2023 to look at two of the FCAS-specific pages for two Eraring units (ER02 and ER03 on interposing pages) and see that they have been a consistent participant in 8 x FCAS markets over the past 10 years:
2) Firmness and long-term energy storage:
… although challenged during winter 2022, which was just another reminder of how we wrote about the escalating risks of ‘the rise of ‘Just in Time’’ in Key Observation 5/22 within GenInsights 21, just over 2 years ago now.
3) Inertia;
4) System strength;
… remember that it was only on 20th February 2024 (i.e. 9 days ago) when we received the AEMO notice about ‘System Strength Requirements in NSW’ … which could see times of significant challenge with a closure of Eraring (without replacement by syncons or something of the sort).
etc…
Not sure I have seen (in analysis with respect to) ‘can Eraring close as currently earmarked’ these sorts of ‘keeping the lights on services’ considered. Have I missed something?
Seems a very tall order (perhaps some think a tall tale?) to expect all of this to be replaced sufficiently for Eraring to close as currently scheduled on Mon 18th Aug 2025 (i.e. just under 18 months time).
What would Darryl Kerrigan say? Perhaps …
‘Tell them they’re dreaming?’


And that perhaps only the worst performing / highest cost to maintain unit at Eraring will switch off ‘some time’ after 18 Aug 2025, rather than all four being switched off on 18 Aug 2025, i.e. Eraring will stage the closure of it’s four units from August 2025, over perhaps even years.
assessing the wisdom of recent agreement re NSW and Origin requires an analysis of what the renewable energy contributions actually are, and how much projected input is likely to be realised, what other measures are available to the Gov to secure renewable energy ( including regulation and legislatory measures regarding investment, taxation etc) and how the grid itself can manage energy collection and distribution. I am keen to to see all that put together.