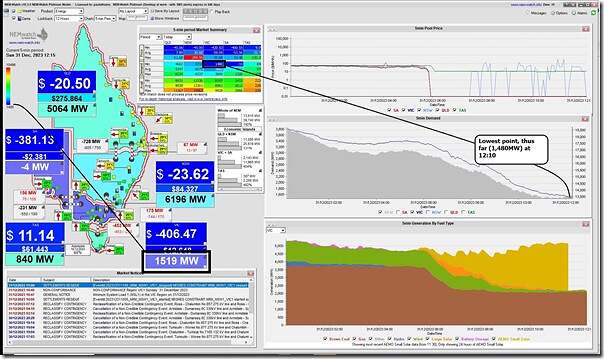
Following today’s earlier Part 1 article about the unfolding situation in Victoria, here’s a snapshot from NEMwatch at 12:15 with ‘Market Demand’ in Victoria down at 1,519MW … though 5 minutes earlier it had been 1,480MW (at 12:10):
Remarkable to think that that level would already be 244MW below what had been set (1,725MW at 10:45 on 12th Nov 2023) as the ‘lowest ever’ point at that date … and forecast to go considerably lower today, as well.
The level of ‘Market Demand’ in South Australia is negative today … and prices in both regions well below ‘negative LGC’.
(A) Supply from Rooftop PV, Coal … and no room for anything else
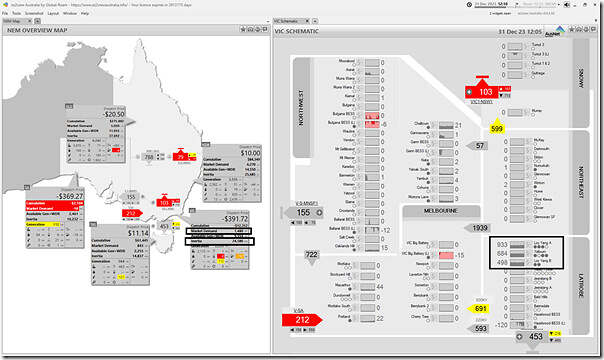
Worth also including this snapshot from ez2view at 12:10 to help readers understand that the only two local supply sources in VIC at this point are:
1) the rooftop PV juggernaut, and
2) eight of ten brown coal units all running down close to what must be ‘minimum load’ …
Prices in VIC and SA are dissuading anything else from running.
Interestingly, in the VIC Schematic on the right we see that the ‘Scheduled Load’ sides of the batteries* are running at this dispatch interval – but are not running steadily … perhaps because they are already full, or perhaps because of FCAS requirements?
* see Bulgana BESS (-6MW) and Ballarat BESS (-12MW) and VBB (-15MW) and Hazelwood BESS (-120MW).
(B) Inertia on the edge
… those same 8 x coal units would be the dominant source of the 24,580MW.s of inertia* shown as being produced to keep the Victorian grid stable at this point.
* remember that inertia is measured in ‘megawatt seconds’, and that Jonathon Dyson’s earlier article ‘Let’s talk about inertia’ might be useful background.
Whilst that is well above AEMO’s ‘Secure Limit’, it’s important to understand that this inertia supplied by these units is binary (supplied if running, not supplied if not running) … so should any unit come offline as a result of minimum load challenges (because of high levels of rooftop PV), the level of inertia in the grid would drop in steps.
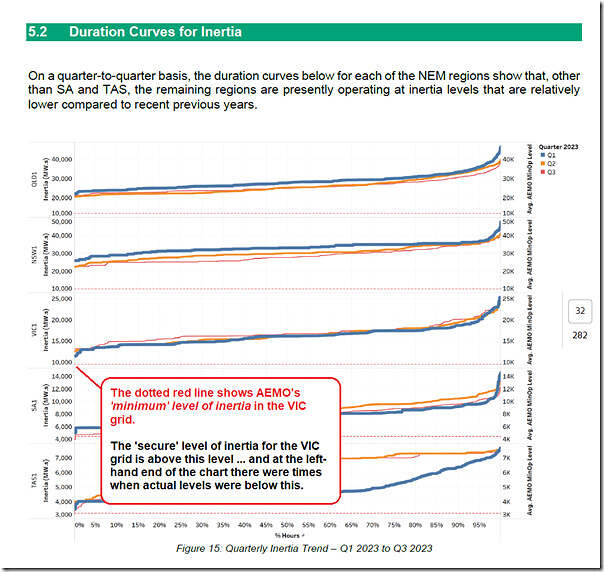
Pulling open GenInsights Quarterly Updates for Q3 2023 and we see how this compares to the duration curve for inertia seen through recent quarters:
As noted in the report, the VIC region has seen an increasing number of instances where instantaneous levels of inertia have been below AEMO’s Secure Levels. Whilst this does not automatically mean trouble, it does signal a more fragile operating state if some disruption should happen.
We’re not there (yet?) today … but if demand should drop further then some coal units might need to come offline.
Challenging times!


Leave a comment