In recent years we seem to be experiencing regular reminders that extreme weather conditions can severely damage electricity supply infrastructure – not only causing immediate disruptions to supply, but also taking days, weeks or months to fully resolve. For instance:
1) Many readers here will remember the extreme system conditions that existed through 31st January 2020 culminating in an extreme storm conditions that cut the Heywood interconnector in two, which had the effect of islanding the South Australian region from the rest of the NEM (which lasted 14 days, and many months until fully repaired).
2) Of course there was also the extreme wind conditions in South Australia on 28th September 2016 that downed transmission towers and lines, as one step along a cascading link of failures that culminated in the SA System Black.
3) That’s just two of them!
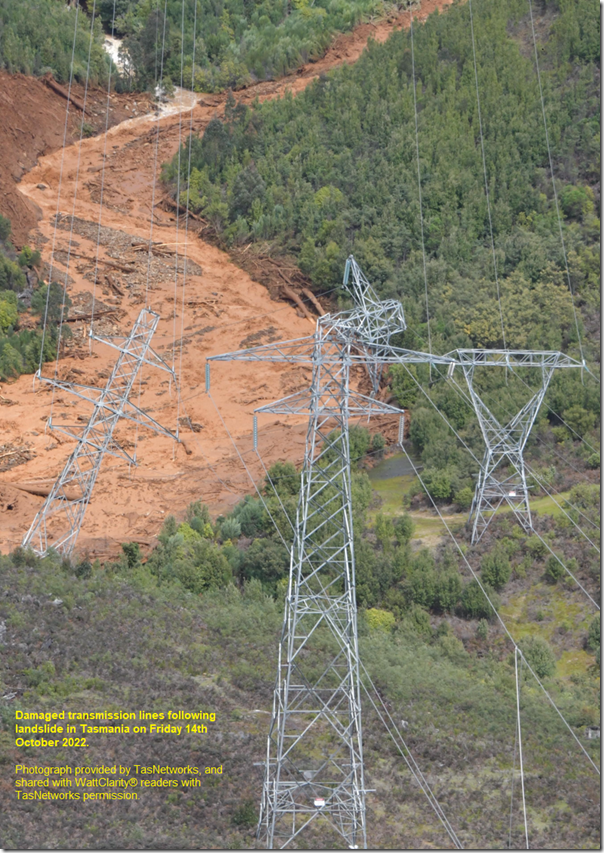
What happened last Friday 14th October 2022 in Tasmania is just the latest in the expanding series of these kinds of events. When viewing this image (shared by our friends at TasNetworks), we can clearly see the scale of the damage, and understand the reason for the disruption:
As was the case in reviewing the ‘accelerated accidental experiment’ triggered by the downed Heywood interconnector on 31st January 2020, there are several different timescales that will be of interest in exploring (via future articles here on WattClarity®) what happened in Tasmania, and the implications of this.
Of course the AEMO and others will be publishing their own reports as well, and we will be sure to reference them under this ‘Headline Event’ as a service to our readers here.
I thought for now that I’d quickly jot down some of these timescales – we will try to remember to return here progressively and link back in here future articles and pieces of analysis that immediately address
Timescale #1 = milliseconds around 09:19 on Friday 14th October 2022
I heard it noted today that Friday 14th October 2022 broke some kind of record (I think it might have been ‘wettest October day on record’ for the VIC/TAS vicinity, but don’t quote me on that one).
Perhaps some of our meteorologist readers can comment here?
In our Initial Look in the Sequence of Events of 14th October, we can see that the the initial event probably lasted only seconds or milliseconds around 09:19 NEM time (i.e. 10:19 Tassie daylight savings) on the day. Following from this initial look:
1) we’ll endeavour to do what we can to take further look …
2) … but really we’re all waiting here for the AEMO’s initial Incident Report, which will (we hope) have access to some millisecond level monitoring data not available to anyone else to help shed more light on the exact sequence of events.
In the absence of this, the speculation has abounded about the exact sequence of events.
Timescale #2 = a number of hours from 09:19 on Friday 14th October 2022
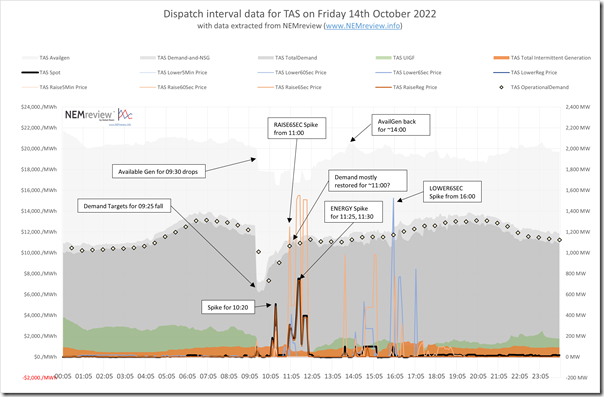
We concluded this Initial Look at the 09:35 dispatch interval (i.e. with the dispatch interval finishing only 16 minutes after the initial event):
1) We noted that we’d not even reached the point where prices really went haywire.
2) Also at this point, the ‘lost load’ had not yet been re-supplied.
As such, there is clearly another timeframe (which we might call ‘Stabilisation and Immediate Recovery’) that lasted a number of hours on Friday 14th October 2022 that will also be worth exploring in more detail. In this timeframe participant responses to stimulus from the market, and communications with AEMO and others, becomes of interest.
In the following chart we use our NEMreview v7 software to extract some of the interesting high-level data from on a dispatch interval level to have a look at the Tasmanian region for the whole of the day (i.e. Friday 14th October, based on NEM time ):
Those with the own licence to the software can access their own copy of this query here.
I’ve annotated the image with just some of the elements that jump out at me, which we will be keen to explore in more detail (as time permits!).
Timescale #3 = the hairy initial week or two with the main backbone on the ground
Keep in mind that Tasmania is currently facing a situation where its main north-south transmission backbone is split in half, and lying on the ground (and the rain continues). There are smaller supporting systems (110kV, I think) that are keeping the North and South of the state together electrically, but the fact is that the level of risk* has increased.
* useful to remember at this point that Risk is a function of Probability and Consequence.
Because of this, the Tasmanian grid is being required to run in a ‘less secure’ mode than all stakeholders would ordinarily like – which means there will be some fancy dancing going on between AEMO, TasNetworks and other relevant stakeholders to manage as best they can for a period of time. A useful guide here is that the islanding of South Australia lasted from 31st January 2020 to 17th February 2020 (i.e. 17 days):
1) This ended with the construction of a ‘temporary’ transmission link:
(a) that was intended to bridge the gap till a permanent repaid could be made; and
(b) which is probably what the plan of action would be here, as well;
2) But then also consider that the worst of the weather there ended on 31st January 2020, whereas currently Tasmania is bracing for more storms that will make any attempts to even commence repair fraught with difficulty.
Suffice to say it will probably be a number of weeks in which Tasmania is operating in this ‘less secure’ mode.
Timescale #4 = months ahead, into 2023
In the case of the repairs to Heywood, a fully scoped repair (i.e. with replacement transmission of a permanent nature) took a number of months to complete. I find now that we did not post any articles to mark the conclusion of this process, but have a vague recollection that it took many months to complete:
1) One of our readers might like to remind us all in a comment below;
2) Or (when time permits) I might do some digging to find out?
Based on my vague recollection currently, I’m expecting in the Tassie case that will be significantly into 2023 before the full repair is effected.
Timescale #5 = years and decades
We’ve noted before in recent years that ‘The NEM is becoming increasingly dependent on the weather’. Indeed, that was Theme 6 within Part 2 of the 180-page analytical component within our major GRC2018 release:
… and then this theme was further explored in various places within GenInsights21 (and now more recently in the GenInsights Quarterly Updates).
With the NEM being increasingly dependent on the weather, and with many scientists explaining how Climate Change is going to deliver increasingly frequent extreme weather events, this recent event in Tasmania is food for thought at several levels.
But that’s all, for now, on this 3rd article in the series.


Good luck with building any form of temporary 220kV transmission line in this terrain. There is a reason why even the 110kV is on steel towers. The real big one will be the loss of stable ground to build foundations in. I suggest this will take a while to sort out.