When we released the GRC2018 a couple years ago, we wrote ‘The NEM is becoming increasingly dependent on the weather’ in Theme 6 within Part 2 of the 180-page analytical component.
1) We expanded on this challenge in various ways with the more recent release of GenInsights21.
2) The 2022 Energy Crisis that has been transpiring … particularly in Q2 2022 … has also included elements of this function.
The AEMO’s recent publication (QED for Q2 2022) identified at least eight different factors contributing to the extreme outcomes seen through Q2 2022 – several of them related to the weather.
Because it’s increasingly signposted (such as in the 2022 ESOO released this week) as the way the NEM is developing, we’re increasingly looking closely through our dashboard and other tools at the ways in which the weather is increasingly playing a role in the electricity supply system.
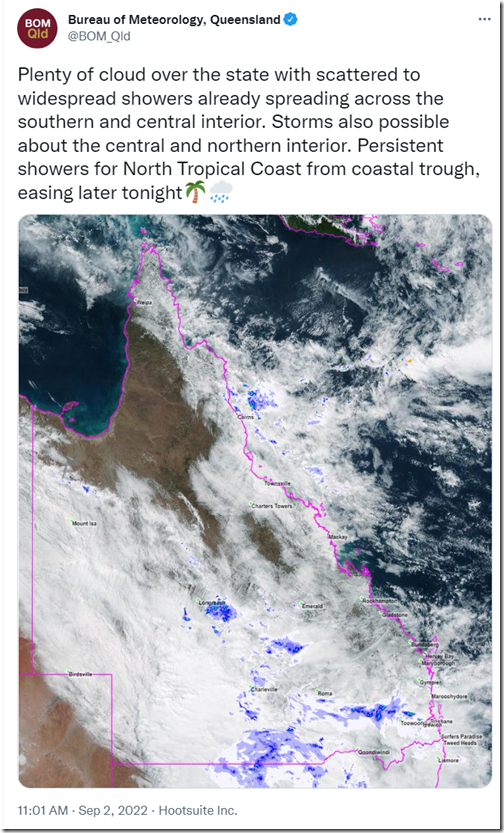
(A) Widespread cloud cover across QLD on Friday 2nd September 2022
For that reason, this tweet from BOM QLD jumped out at me:
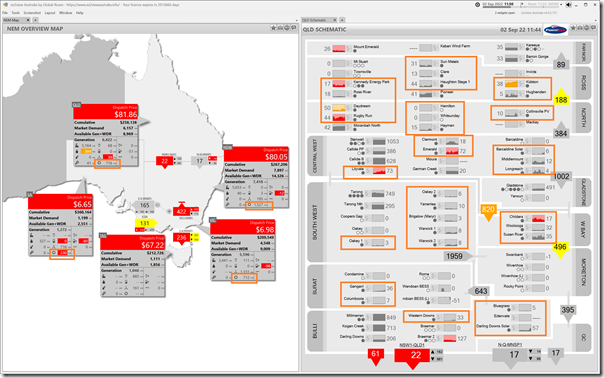
It was natural for me to wonder how that was impacting on solar production across the significant fleet of Large Solar farms dispersed across the QLD region … so I had a quick look in ez2view with this snapshot from the 11:50 dispatch interval (i.e. near the middle of the day, when we’d expect to see near maximum yield on a sunny day):
I have highlighted the Large Solar farms across the QLD region to make them clearer (might have missed some in doing it quickly):
There’s only a handful of solar farms in those ones highlighted which have an output more than 50% of their capacity at this time (e.g. Kidston, Rugby Run, Lilyvale and Emerald)
We see that the aggregate production from solar across the state at this time was just over 700MW (compared with an aggregate Maximum Capacity of 2,789MW – hence an instantaneous Capacity Factor of around 26% in the middle of the day).
However it’s not realistic to assume all solar farms are fully producing to Maximum Capacity at any single instant in time (for instance, some of the ones highlighted are still in commissioning, so unable to produce fully).
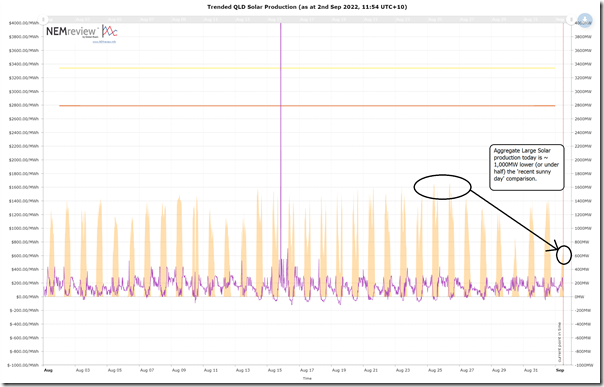
A more realistic comparison would be to compare against aggregate output on sunnier days in the same season.
Hence in the following trend (produced here in NEMreview v7) Comparing actual output since 1st August 2022 we see that aggregate harvest today is perhaps 900-1,000MW lower than the highest points of output through August 2022 … or more than 50% lower:
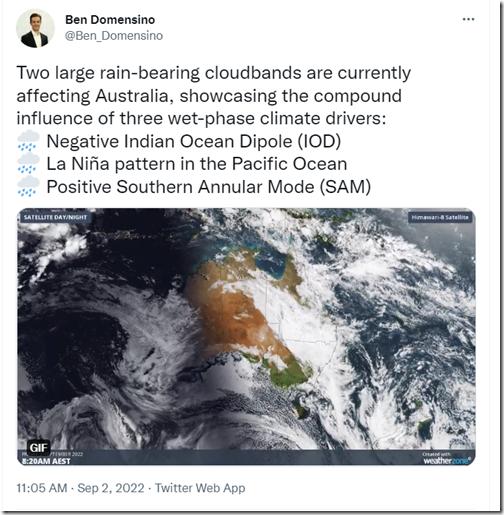
(B) Weatherzone Australia wide
The other tweet that jumped out to me was this tweet from Ben Domensino from Weatherzone:
Will be interesting to look further…


Be the first to comment on "Widespread cloud cover across QLD dampens solar production on Friday 2nd September 2022 … and broader"