As frequent readers of WattClarity® would be aware, over the past year or more we’ve been taking an increased interest in the file creation time at the AEMO of some key files in dispatching the market.
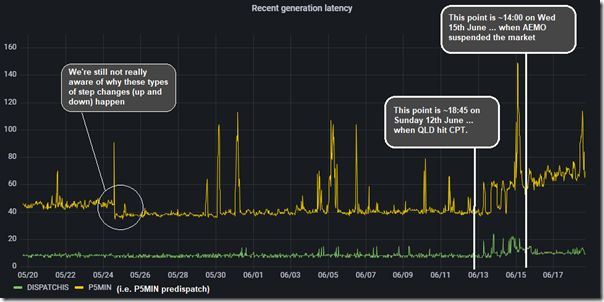
Given our increased interest we put together an internal dashboard we keep an eye on – so I thought it would be illustrative of the challenges that AEMO (and hence the broader market/system) is facing in presenting this trend of file creation latency over the past 30 days:
Remember that crucial caveat … that correlation does not mean causation, it’s curious to see such a step change increase in latency (from ~40 seconds to ~60 seconds) beginning with the commencement of Administered Pricing and then becoming much more regular with the advent of Market Suspension, and I have to wonder why that might be the case.
Worthwhile remembering two points:
(A) General background to this data, and why we’re watching it increasingly
Since our company formation in 2000* we’ve focused on development, and licensing to many different clients from a cross-section of wholesale market participants (generators, retailers, traders and some large energy users) along with a range of other stakeholders (investment banks, market bodies, equipment and services suppliers and so on).
* I’ve noted before about the common beginnings of Global-Roam Pty Ltd and ROAM Consulting Pty Ltd (now EY ROAM) … but our focus has always been on helping clients through software.
As part of this software service the value our clients gain has always included an element of value just for the data delivered … but increasingly recently we’ve seen a growth in the number of clients using us directly ‘just’ for some form of data feed:
1) We have a number of clients we help as an outsourced manager of their own Hosted MMS in Azure, complete with their private data
2) Other clients use us to access a Hosted MMS in Azure, just with public data – with a focus being either (or both) Real-time dashboarding or long-range historical analysis.
3) For other clients we have configured bespoke data feeds that most often relate to prices, but can also relate to a range of other (live updating) data feeds.
Through all of this we’ve seen a rise in the queries from clients about the latency of the data they receive … which means we’ve taken an increased interest in the latency of the data published by the AEMO (i.e. back at the source).
For instance:
1) On 15th August 2021, after puzzling about what we had been seeing for some time, we posed the question ‘Do you know what’s causing some increased latency on P5MIN data files…’ and labelled this as ‘Tripwire #4’.
Following from this question we had a number of conversations, but never really got to the bottom of an answer to that question.
2) On 16th November we wrote a second article about ‘Ongoing file creation delays in P5 predispatch data at AEMO’.
3) Worth noting in here that we also took an ‘Initial look at the latency of all rebids’ on 7th October 2021 … which is determined (at least in part) by the file creation latency at the AEMO.
4) On 4th December 2021 we saw some good news with ‘Two recent improvements (in late November 2021) by AEMO …’ – with one improvement being reduced latency in file creation.
5) On 15th February we wondered was ‘NEMDE under strain?’ in relation to an escalation in file creation times.
6) On 25th February 2022 we posted with some ‘Updated (and extended) latency statistics for P5MIN file creation at AEMO’ … including a view back to August 2018 that showed some times in the past where ‘MAX’ instances had been quite large … but that the period from July 2021 had seen a sustained rise in average and median file creation times.
7) Hence we come to this article today … and a significant step change up in the latency (unfortunately) !
(B) In relation to the Administered Pricing and Suspension
The past week in the NEM has perhaps been the most stressful time, for the greatest number of people/organisations, since the commencement of the NEM back on 13th December 2022.
(B1) General sequence of events
This situation has escalated quite quickly, as follows:
1) On Sunday 12th June the QLD region exceeded the CPT and began Administered Pricing from 18:55 that evening
2) Just under 24 hours later, on Monday 13th June the same occurred in NSW at 18:35;
3) Which was closely followed that same evening at 21:50 for SA and 21:55 for VIC.
4) This culminated with AEMO determining to suspend the NEM spot market across all regions at around 14:05 on Wednesday June 15th because if became ‘impossible to operate’.
Even since that time, there have been other developments …
(B2) Mapping to the NEMDE file creation process
I’ve annotated two events (on Sunday and Wednesday) on the chart above as bookends.
CAVEAT … remembering/reminding again that correlation does not mean causation … in the light of the increased stresses* the NEM is facing we wonder about the extent to which the 50% jump in file creation time for P5MIN is either, or both:
(a) Occurring because of the stressful conditions in the NEM; and/or
(b) Contributing to these same stressful conditions.
* with these ‘stresses’:
i. in terms of the physical grid …
ii. but also in terms of support systems (like NEMDE) and for personnel in Control Rooms and associated functions across the NEM
Can anyone help us understand more, please?


Leave a comment