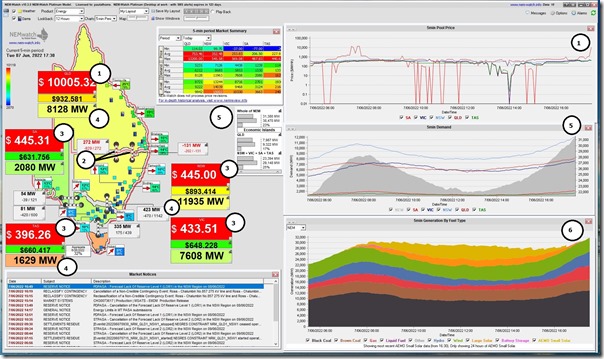
No time for anything more this evening than to pin this snapshot from NEMwatch for the 17:30 dispatch interval this evening and flag a couple things:
With reference to the numbered annotations:
1) The QLD price is climbing, and up to $10,005.32/MWh in this dispatch interval
2) Constraints are also at play:
(a) On QNI this evening it is the ‘N^^Q_LS_VC_B1’ constraint equation limiting flow north
(b) With DLINK it’s the ‘N^N-LS_SVC’ constraint equation making flow south of at least 120MW
(c) These are members of the ‘N-LS_VC1’ constraint set:
i. which is separate from the the ‘N-ARTW_85’ constraint set noted this morning…
ii. Where this one relates to an outage of the Lismore SVC (a longer-running outage that extends to the end of September); and
iii. But creates another example of how network outages are integrally involved in many volatility events.
3) These constraints are creating a QLD-only ‘Economic Island’ … but prices are well above $300/MWh in all four southern regions (raising questions about any who sold CAPS for the quarter … more later).
4) Across the regions we see:
(a) VIC and SA showing modest ‘Market Demand’ still in the green zone of historical ranges
(b) NSW and QLD have climbed out of green into yellow; and
(c) ‘Market Demand’ in TAS has climbed well above that, in relative terms, and at 1,629MW is well into the ‘orange zone’ (all-time maximum on this measure was 1,781MW)
5) Collectively this means the NEM-wide ‘Market Demand’ is above 31,000MW … which is also fairly high on a historical range (what we’d expect on a cold, dark winter evening).
6) The fuel mix trend shows:
(a) a fair bit of wind production (but – at ~4,700MW – quite well below the recent all-time maximum);
(b) solar gone to bed;
(c) hydro and gas (and even coal) ramping for evening peak in demand.


Leave a comment