
This article was originally posted on WeatherZone and is reprinted with permission.
Given that the Brisbane flooding event was very ‘up close and personal’ for us, we took particular interest in Ben’s article and appreciate the opportunity to share with our WattClarity readers here.
Over the last fortnight, eastern Australia was hit by a major rain and flooding event that affected around 1000 km of the eastern seaboard, stretching from southeast Qld down to southern NSW.
This historic rain event was fuelled by a relentless atmospheric river feeding moisture-laden air into a slow-moving upper-level low pressure system. This dynamic weather setup also featured several surface-based low pressure troughs and low pressure systems, which produced focussed areas of catastrophic rainfall in both Qld and NSW over a 10-day period.
Flooding rain arrives in Queensland
The event started in southeast Qld on February 22 and 23 when rain and thunderstorms delivered 388 mm in nine hours at Wolvi Creek, near Gympie. This deluge triggered major flooding and caused some creeks to jump by seven metres in seven hours.
More heavy rain and storms then fell over southeast Queensland between Thursday February 24 and Monday February 28, as the atmospheric river stalled and fed into a series of near-stationary low pressure troughs.
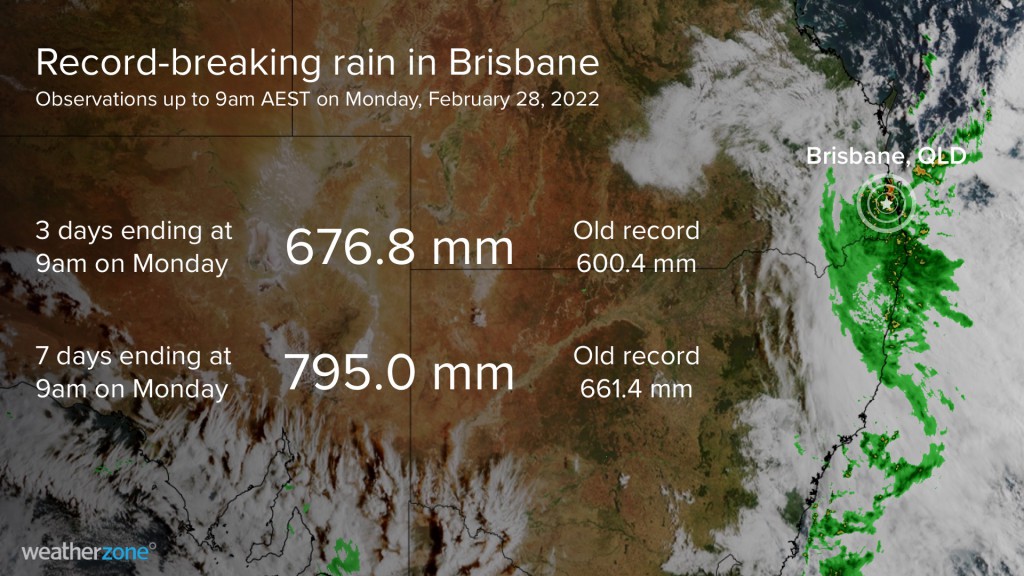
Amid this multi-day deluge, Brisbane registered three consecutive days with more than 200mm of rain, for the first time in record. This trio of days produced a total of 676.8mm during the 72 hours ending at 9am on Monday, February 28, which beat the city’s previous three-day record of 600.4 mm from 1974. Brisbane’s 795mm observed in the seven days ending at 9am on February 28 was also a new weekly rainfall record for the city. These records are significant because Brisbane has rainfall observations extending back to 1840.
Rain and flooding spreads into NSW
As the atmospheric river moved further south, the Northern Rivers region of NSW started to become inundated by unrelenting rain from Sunday, February 27. By Monday morning, rivers were overflowing, and towns were being flooded as hydrologists scrambled to anticipate how high the floodwaters would rise. This event had quickly moved into unchartered territory for some catchments.
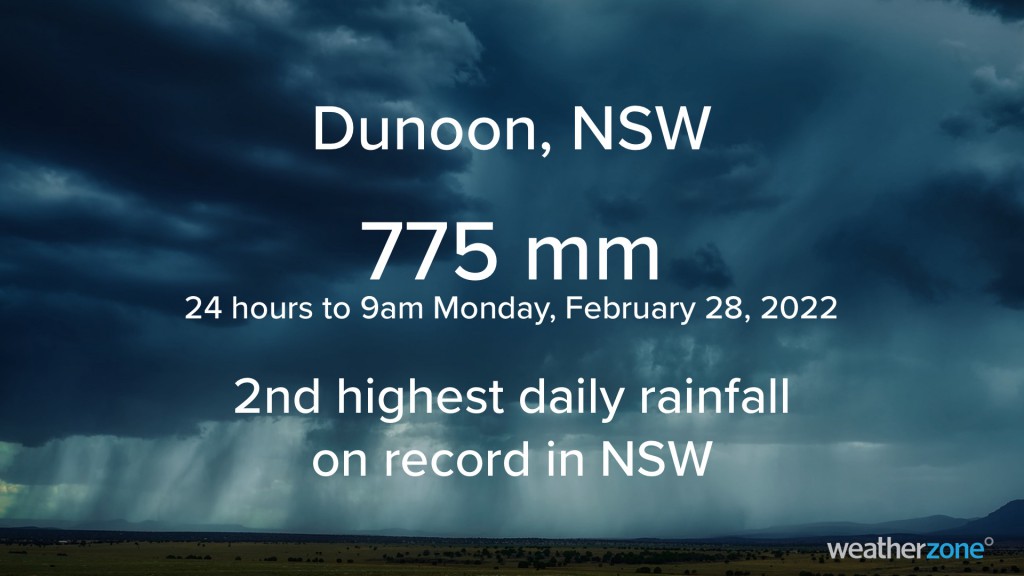
A rain gauge at Dunoon, to the north of Lismore, received 775 mm of rain during the 24 hours to 9am on Monday, February 28. This was the second highest daily rainfall ever recorded in NSW, beaten only by 809.2 mm at Dorrigo in February 1954.
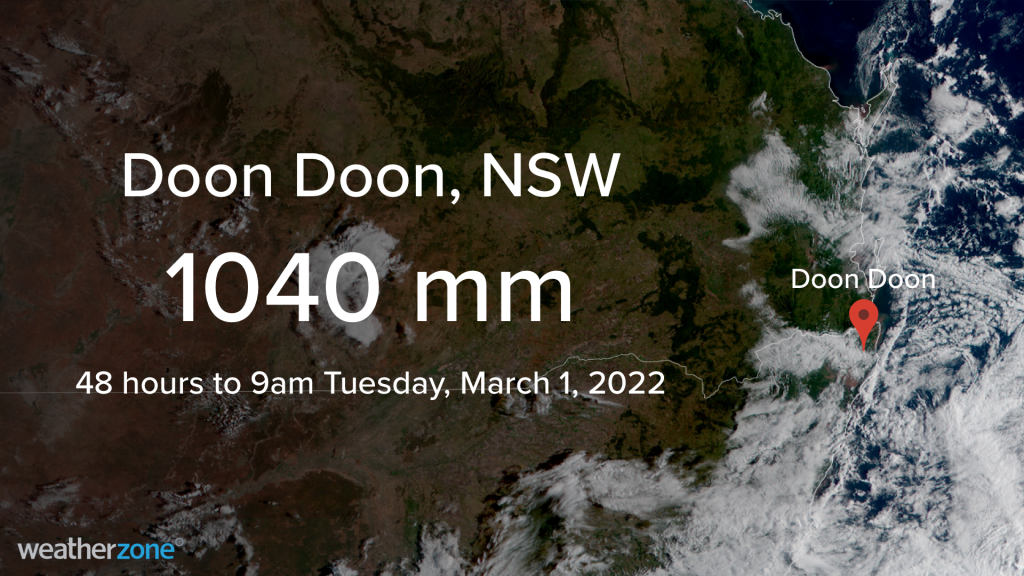
Heavy rain continued over the now-flooded Northern Rivers region of NSW throughout Monday and into Tuesday. By 9am on Tuesday, March 1, a rain gauge at Doon Doon, near Mullumbimby, had amassed 1040 mm of precipitation within 48 hours. This massive two-day total is equivalent to around 60 percent of Mullumbimby’s entire average annual rainfall.
In response to this exceptionally heavy rain, rivers reached levels never-before recorded in these parts of northeast NSW.
The Wilsons River at Lismore climbed to a height around two metres above the previous record flood level. The main river level gauge at Lismore stopped reporting before the peak of the flood, although it had already reached 14.2 metres before midday on Monday, February 28, well above the previous record of 12.27m from 1954.
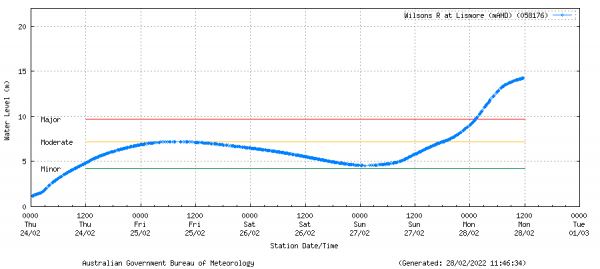
Image: Observed river level heights for the Wilsons River at Lismore up until late-morning on Monday, February 28, 2022, shortly before the gauge went offline. Source: Bureau of Meteorology
As the floodwater moved further downstream, the Wilsons River reached 7.18 metres at Woodburn. This was well above the major flood threshold of 4.2 metres and also higher than the site’s previous record from 1954.
Threat shifts to central NSW
Later in the week, the stream of heavy rain tracked down to central NSW and was enhanced by a developing low pressure system over the Tasman Sea. There were fears that an East Coast Low could drive devastating rainfall into the state’s central coast and ranges, including Sydney.
Fortunately, the low pressure system didn’t gain much strength and spared central NSW from the type of rain seen over the state’s northeast earlier in the week. However, there was still enough wet weather to cause flooding.
A rain gauge at Warragamba Dam registered 237 mm of rain during the 48 hours to 9am on Thursday, March 3. This was the middle of a four-day deluge that saw a total of 282mm hitting the dam’s gauge.
Warragamba Dam, which was already close to capacity before this rain, was forced to commence spilling in the early hours of Wednesday morning, March 2. This helped cause major flooding in parts of the Hawkesbury-Nepean River system over the following days.
How rare was this event?
There has been a lot of discussion about how rare the rain and flooding from this event was in Qld and NSW.
We already know that a number of records were broken for both rainfall and flood heights, including those listed above in this article. We can also compare observed rainfall and river level data from this event to historical records, which allows us to calculate how unlikely it was for this type of event to occur statistically. A common way to represent this event probability is to use the Annual Exceedance Probability (AEP), which simply refers to the likelihood a given rain amount or flood height will occur in any given year.
Looking at the rain that fell in Brisbane, the probability of 768.6mm falling in the city over 72 hours in any given year is between 0.5 and 0.2 percent. Put another way, this much rain is, statistically, only expected to occur once every 200-to-500 years.
In NSW, Doon Doon’s 1040 mm in 48 hours is a rainfall rate that has a 0.1 to 0.05 percent chance of occurring in any given year. This makes it fall somewhere between a 1-in-1000 year and 1-in-2000 year rainfall rate for this site.
The river levels observed in northeast NSW were also very rare.
The Wilsons River at Woodlawn, a few kilometres upstream from Lismore, peaked at 15.01 metres around 3:15pm AEDT on Sunday, February 28. According to a flood risk management study published by the Rous County Council, the probability of a 13.49 metre flood peak at Woodlawn is 0.2 percent, or a 1-in-500 year event. This week’s flood peak was 1.5 metres above that level, making it probably closer to a 1-in-1000 year flood height for that location, possibly bigger.
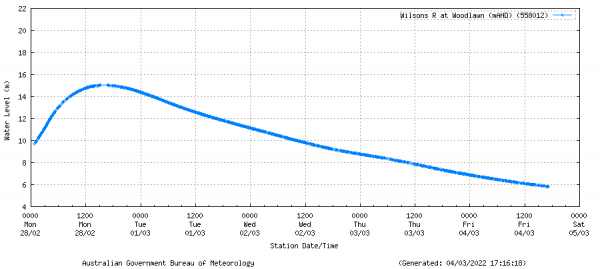
Image: Observed river level heights for the Wilsons River at Woodlawn, showing a peak around 15 metres (AHD) on Monday afternoon. Source: Bureau of Meteorology
It’s worth highlighting that these estimated return intervals are not schedules, they are probabilities. A 1-in-1000 year rain rate is not a rain rate that occurs only once every 1000 years. It is, instead, a rain rate that has a 0.1% chance of occurring at that location in any given year.
It is possible to have 1-in-1000 year rain rates in two consecutive years. In some parts of the world, climate change is making extreme rain events more frequent and intense. So, what used to be a 1-in-1000 year event in a past climate may now be more like a 1-in-100 year in the modern climate, for some places.
This rain and flood event was extremely rare and broke records in several areas. You can find a more detailed breakdown of the weather and climatic factors that contributed to this event here.
======================================================================================================
About our Guest Author
 |
Ben Domensino is a Communications Meteorologist at Weatherzone.
Weatherzone, a DTN company, is Australia’s largest private weather service and was established in 1998. Their team of highly qualified meteorologists understands the effect the weather has on the day to day operations of businesses of all kinds. They also run Australia’s most popular consumer weather website and mobile app. Weatherzone provides market-leading weather insights to more than five million Australians and over 15 industries, including energy, mining, agriculture, ports, aviation, retail, insurance, broadcast media and digital media. You can find Weatherzone and Ben Domensino on LinkedIn. |
This event needs to be put in context though. The odds of such extreme rainfall in a particular location might be 1 in 500 years, but the odds of 80% of this level occurring some where in this region of QLD and NSW is much higher. We only need to look at 2017 and 2011 for similar events. Sure the rainfall levels might have been different and the locations slightly different, but the results are not that different. Major flood damage in this region.
I think there needs to be a better way of stating the statistical probability to the region as clearly 1 in 500 years or even 1 in 100 years, doesn’t convey the risk.