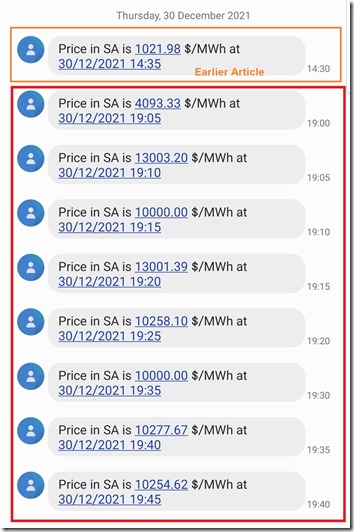
Yesterday I caught the first price spike in South Australia in the 14:35 dispatch interval.
But that was not the last one, with a steady stream of volatility seen from 19:05 (NEM Time) – as shown in this stream of volatility recorded in SMS alerts:
(SMS alerts can be configured in our ez2view, deSide® and NEMwatch (Platinum Model) products)
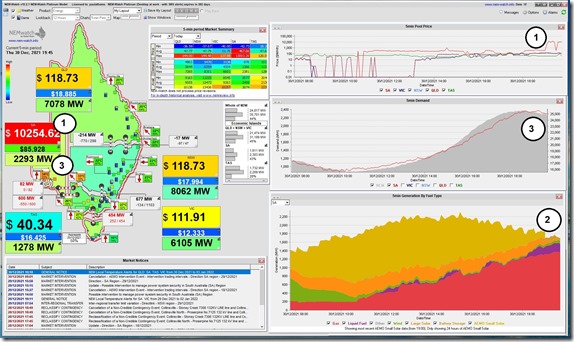
This was the last one, captured for the 19:45 dispatch interval in a snapshot from NEMwatch:
With reference to the numbering:
1) Price is elevated, and has been for some time … and virtually the whole day above $100/MWh
2) The fuel mix at this time was very fossil-fuel-heavy, with almost no contribution from wind, and the last traces of solar disappearing into the sunset. How the batteries operated is too small to be really seen clearly at this absolute scale, so we will look more closely below.
3) What particularly caught my eye was that ‘Market Demand’ in South Australia had shifted above the blues and greens (i.e. low levels) that has seemed to typify demand levels in South Australia throughout almost all of the year.
Let’s delve into both …
(A) A quick look at trended peak levels of Market Demand in South Australia
For those who have read as far as Appendix 15 in GenInsights21 over this quieter period since Christmas, you will understand what I am talking about, in terms of the rare (but still stubbornly persistent) levels of high ‘Aggregate Scheduled Targets’ on a regional basis … and even right across the NEM – and what we saw in South Australia yesterday evening seemed to be one of those occasions.
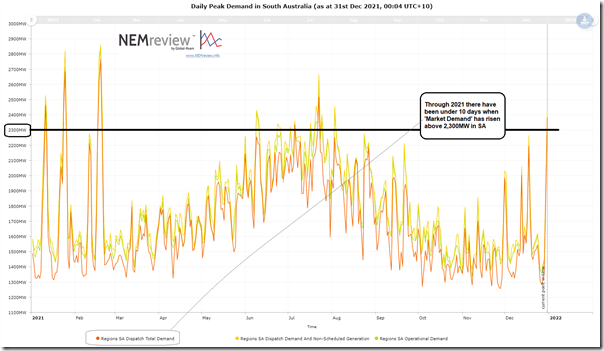
Whilst the level shown in NEMwatch above (at 2,293MW) was still a little over 1,000MW below the ‘all time maximum’ recorded some years ago now, it seemed to me yesterday evening that I’d not even seen demand up at that level all that frequently through calendar 2021 at all. So this morning I ran a quick query in NEMreview v7 to check:
Above is trended daily peak in demand – with several measures shown, but my particular interest in the ‘Total Demand’ measure that AEMO publishes, and which feeds directly into NEMDE to determine dispatch and price (and so is referred to as ‘Market Demand’ by many as a result). As noted on the image, there have only been a handful of times that ‘Market Demand’ has reached the level seen yesterday evening, through the whole of 2021 … which has implications for the future evolution of the NEM (as discussed in Appendix 15 in GenInsights21).
(B) A quick look at battery operation in South Australia
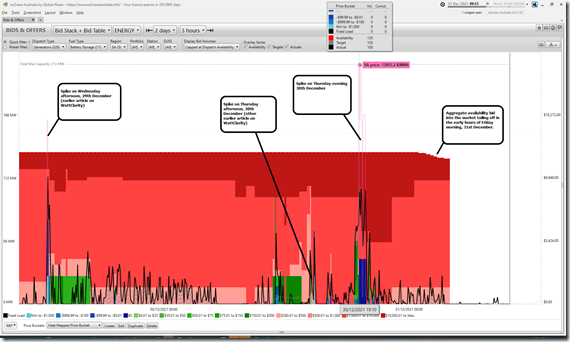
Using ez2view ‘Bids & Offers’ widget, filtered just down to battery discharge in South Australia (and spanning back 2 days to also incorporate the timing of Wednesday afternoon’s volatility) we see the following:
With respect to this trend:
(B1) Aggregate volume offered, at any price
Compared to a total Maximum Capacity of 213MW only 135MW was bid at any point over the past 2 days
(a) but that’s partly to do with the fact that ‘MaxCap’ now also includes 2 x SA Water batteries that are registered but not yet operating (that’s 8MW of the difference)
(b) The main difference is because the 150MW HPRG1 unit is only offering 80MW into the market at any price as per its contract with the SA Government.
Interestingly, the aggregate volume offered across the three batteries that are operational tails off slightly in the early hours of Friday morning.
(a) This turns out to be DALNTH01 progressively reducing the ‘MaxAvail’ volume offered into the market from 01:00 this morning.
i. With the rebid reasons always being ‘SOC Change’ or ‘SOC Change (PD)’, they are not much use to help me really understand the reasons behind it (refer to Observation 12 in Part 2 within GenInsights21).
ii. Perhaps this is in relation to the AEMO requirement that all participants restate the real capacity available at times when extreme heat is forecast … like today’s Market Notice 93491 at 10:11 which updates the temperature forecasts, and repeats what had been in prior notices:
‘AEMO requests Market Participants to:
1. review the weather forecast in the local area where their generating units / MNSP converter stations are located and,
2. if required, update the available capacity in their dispatch offers or availability submissions consistent with the forecast temperatures.
Further information is available at:
https://aemo.com.au/energy-systems/electricity/national-electricity-market-nem/nem-forecasting-and-planning/forecasting-and-reliability/projected-assessment-of-system-adequacy/nem-local-temperature-alerts ‘
(b) There’s not been a similar move at HPRG1 or LBBG1, however.
(B2) Volume in Price Bands
Understandably, most of this volume was bid above $300/MWh (i.e. pink and red) to preserve limited energy potential, shifting to blues and greens when prices were higher.
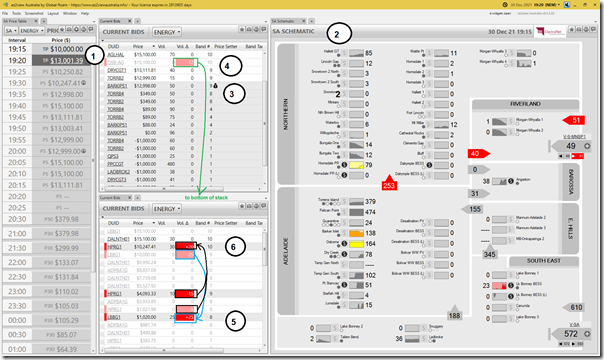
This all makes sense, at a holistic level … but I’d just like to highlight the 19:20 dispatch interval in particular, in this snapshot from a South Australian focused mash-up of 4 discrete widgets:
With respect to the numbering on the image:
1) We can see the price spiked further, from $10,000/MWh in the 19:15 dispatch interval up to $13,001.39/MWh at 19:20
2) In the ‘SA Schematic’ widget we can see the same types of things we saw earlier in the afternoon, and also noted above on the NEMwatch snapshot – such as:
(a) Almost no wind
(b) Solar sliding into sunset
(c) So many of the fossil fuel generators running … and many at high utilisation.
(d) We can also see (in the ‘$’ symbols) some bid changes at numerous plant:
i. Batteries (HPRG1, LBBG1 and DALNTH01)
ii. Fossil units (Angaston, Osborne, Dry Creek and Port Stanvac)
3) As a result of the current bid stack, we see BARKIPS1 unit is a significant contributor to setting the price. There are other contributions (including Eraring in NSW, Gladstone in QLD and also FCAS offers as well … making this one of a number of ‘Complex’ price setter examples… noting they happen a lot of the time!).
4) We see the rebid from OSB-AG is taking undispatched volume from the $15,100/MWh Market Price Cap bid band and putting it down at the –$1,000/MWh Market Price Floor.
5) Similarly, LBBG1 is shifting volume from expensive to less expensive ($10,000/MWh down to $1,020/MWh).
6) Conversely, we see HPRG1 shifting volume upwards in the price stack – from $10,000/MWh (i.e. where the price was set at 19:15) to put it higher ($10,247.41/MWh):
(a) Like DALNTH01 this unit also rebids every single dispatch interval, and the rebid reasons are almost always the same (in this case, ‘Change in Forecast Prices’ – refer again to Observation 12 in Part 2 within GenInsights21)
(b) Given where the volume had been, that it was dispatched, and that the volume was shifted higher (and remembering that it’s impossible to know any participant’s motive … but does not stop many guessing) it would be understandable it an outsider assumed that the intent had been to raise prices as a result!
(B3) What’s all this, then, about ‘Gouging the Market?’
My experience in watching the market for many years leads me to believe that:
(a) If it had been a gas-fired generator exhibiting the same behaviour, there would be many clambering to shout the loudest ‘But they are gouging the market!’.
(b) In contrast, when it’s the favoured son/daughter (HPRG1) doing this same thing, there will be nary a quibble from those same people.
Readers should very clearly understand that I’m not a fan of using that term in either circumstance. In both cases there are likely valid commercial reasons for such type of behaviour. We chose to establish a market as the means to deliver on the National Electricity Objective, so should not be surprised when any participant tries to achieve a good financial outcome for themselves.
Perhaps this example will help some realise that they might have been too hasty to use that label in other circumstances, perhaps because they did not like the Fuel Type and/or the Participant?
That’s all for now … Happy New Year, to all our readers!


Be the first to comment on "Price volatility in South Australia Thursday evening 30th December 2021"