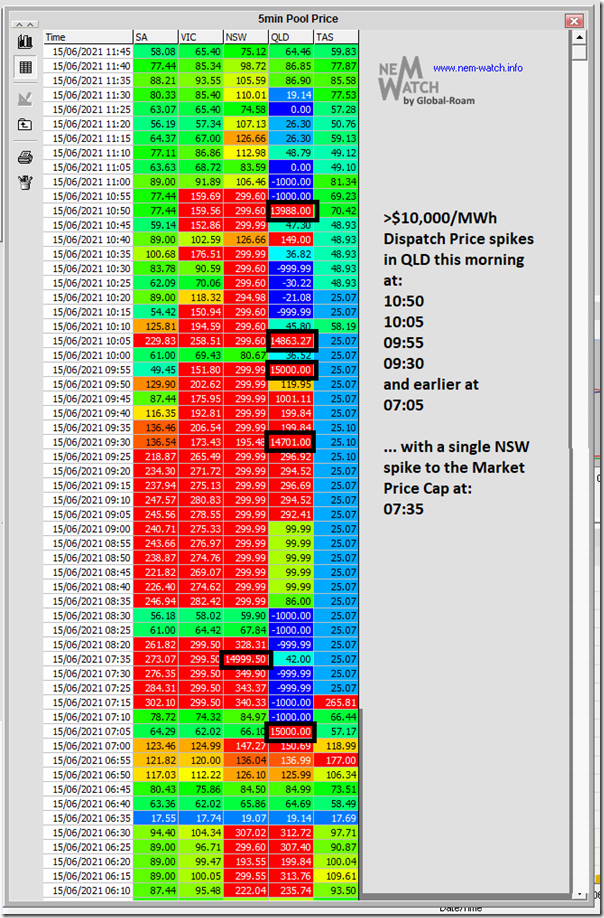
The morning pricing volatility which has become quite familiar in the QLD region in recent weeks was more persistent this morning, as shown in the coloured table snapped from NEMwatch v10 at the 11:45 dispatch interval:
As noted, there were 5 discrete instances of QLD prices above $10,000/MWh, and also a single instance of NSW dispatch price up at the Market Price Cap of $15,000/MWh at 07:35.
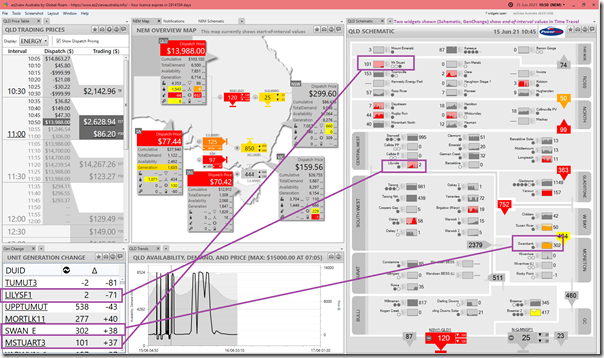
Here’s a closer look at the last spike this morning (at 10:50) via an ez2view window focused on the QLD region:
It’s been an overcast/rainy morning in Brisbane and one of the things I’ve noticed has been the up-and-down output profile of solar farms across the state:
1) Some of this has been in response to the negative prices that have followed the spikes as seen in the table above (via the 5/30 issue); but
2) That does not seem to explain all of the bouncing around…
(a) for instance, the ez2view snapshot above captures a 71MW drop in output at Lilyvale solar farm.
(b) although note that this is an end-of-interval drop in output, so not the reason for the price spike in this dispatch interval (we also see Swanbank E and Mt Stuart 3 increase in output, presumably because of increased targets).
3) To what extent is cloud cover (and/or rain) helping to deliver these fluctuations north of Brisbane?


Leave a comment