Today I’ve already posted two (seemingly unrelated) articles:
1) Peering back into 2023 Q4 I first posted ‘A quick summary of aggregate yield from Large Solar on Tuesday 28th November 2023’ as part of the number crunching for GenInsights Quarterly Updates for 2023 Q4.
2) Then I posted ‘Consultation opens (and webinar next Friday) on Design Paper for ‘Capacity Investment Scheme’’ … with the design paper having been published on Thursday 29th February 2024 (what a coincidence!).
In this third article I’ve tied both together.
Large Solar production, NEMwide on Thu 29th Feb 2024
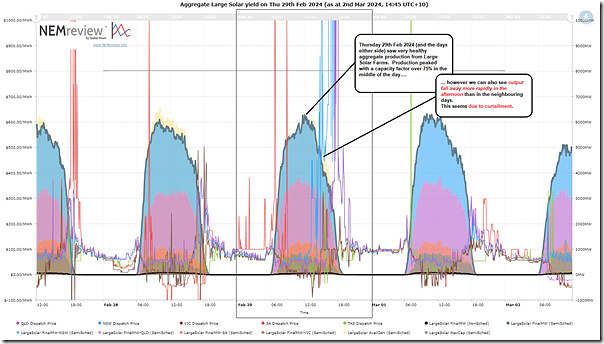
Using the NEMreview analysis template in the first article, it was a simple matter of changing the date range to provide a view of aggregate solar production across the NEM on Thu 29th Feb 2024:
Those with a licence to the software can open their own copy of this query here.
This is a very different picture to that shown for 28th Nov 2023, with aggregate production from Large Solar across the NEM peaking above 6,000MW from around 11:45 (NEM time) on the day … representing an instantaneous capacity factor above 75% … an impressive figure.
However we also note that, at the time the NSW spikes start on the day, we have a faster than ‘should have been’ decline in aggregate production through the afternoon period (i.e. from ~14:00 NEM time). We see this in the yellowed fill shape (i.e. Energy-Constrained Availability) peeking out behind the multi-colours through the afternoon period.
Large Solar production, NSW only on Thu 29th Feb 2024
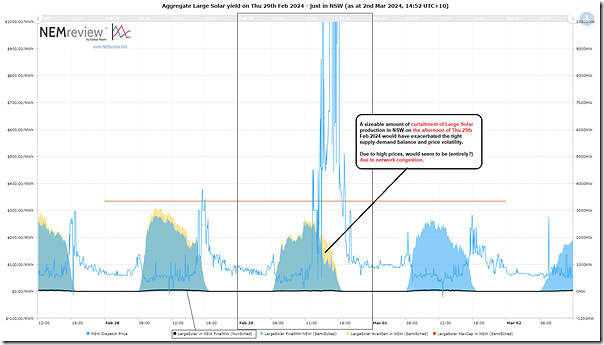
With the NSW region being the particular focus for this day, I’ve re-jigged the chart to show Large Solar just in NSW as follows:
Those with a licence to the software can open their own copy of this query here.
Obviously there is lower installed capacity in NSW than there is right across the NEM, so the numbers are lower … but it’s much clearer to see the curtailment through the afternoon, as it is much larger in relative terms.
We hypothesise that this is all due to network congestion:
1) Because prices were very healthy, so you would have been crazy to bid out of the market during the afternoon; and
2) Because we saw (here, with reference to 15:10) plenty of constraint equations bound in NSW for that particular dispatch interval … and presumably through the afternoon.


Be the first to comment on "Curtailment of Large Solar in NSW on Thursday afternoon 29th Feb 2024 exacerbated the price volatility"