On Friday evening in South Australia we saw some very volatile outcomes (which had the effect of driving the Cumulative Price up to $65,000/MWh currently) – and, as noted yesterday, this was (at least in part) due to the repair work on the damaged Heywood interconnector.
Sunday morning 14th March at 08:17 we see a different example of the impact that these repair works are having, with a rather different Market Notice 83319 issued by the AEMO:
——————————————————————-
MARKET NOTICE
——————————————————————-
From : AEMO
To : NEMITWEB1
Creation Date : 14/03/2021 08:17:29
——————————————————————-
Notice ID : 83319
Notice Type ID : MARKET INTERVENTION
Notice Type Description : Reserve Contract / Direction / Instruction
Issue Date : 14/03/2021
External Reference : PREDISPATCH – Insufficient forecast schedule demand in the SA1 Region on 14/03/2021
——————————————————————-
Reason :
AEMO ELECTRICITY MARKET NOTICE
Possible intervention to manage power system security in South Australia Region.
AEMO has detected there is insufficient forecast scheduled demand to maintain a secure operating state in the South Australian region from 1300 hrs 14/03/2021 to 1430 hrs 14/03/2021. The minimum scheduled demand is forecast to be 372 MW at 1400 hrs and the secure scheduled demand threshold is
400 MW (when SA is at risk of islanding)
AEMO may need to instruct one or more participants and/or implement an AEMO intervention event by issuing directions to one or more participants
in order to maintain power system security in South Australia. This may result in action such as the curtailment of non-scheduled wind and Distributed PV.
AEMO estimates the latest time at which it may need to intervene through an AEMO intervention event is 1200 hrs on 14/03/2021.
Manager NEM Real Time Operations
——————————————————————-
END OF REPORT
——————————————————————-
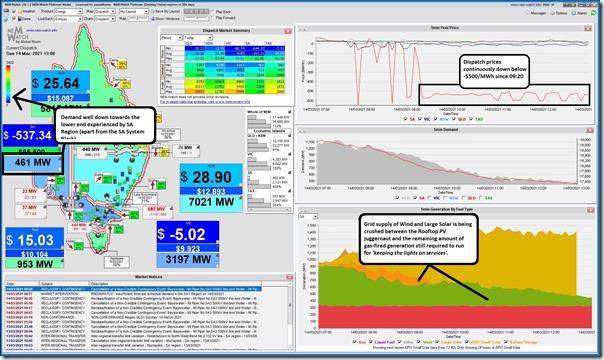
Whilst working on other things I have been keeping an eye on the long run of very negative prices in the South Australian region (down below –$500/MWh continuously since 09:20 – and sporadically before that) – seen here in this snapshot from NEMwatch v10 at 13:00 (NEM Time):
We can also see that, at this point, the ‘TOTAL DEMAND’ measure from AEMO is for 461MW in the 13:00 dispatch interval, so ~90MW* above the low point predicted by AEMO in the Market Notice above.
* apologies for referencing these gory details of the different methods for measuring demand again – but it’s important to understand that, whilst ‘TOTAL DEMAND’ is a measure that is close to the way the AEMO formally defines ‘Scheduled Demand’ it’s not exactly the same thing.
There are a couple things that are worth drawing out here:
(A) How the forecast has progressed
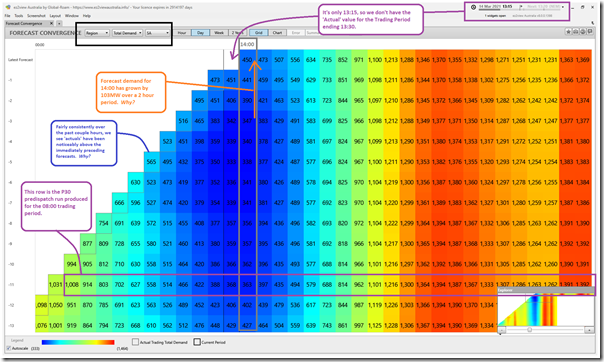
Thankfully with our ez2view v8 software application it’s very simple to look at how successive forecasts from the AEMO have progressed – we provide for this in the ‘Forecast Convergence’ widget. Here’s a view looking at successive P30 Predispatch forecasts for ‘TOTAL DEMAND’:
I’ve annotated to point out a number of things – with the key question being why the demand forecast for the 14:00 period has grown by more than 100MW over a 2 hour period. There are a number of potential reasons why this would be the case including:
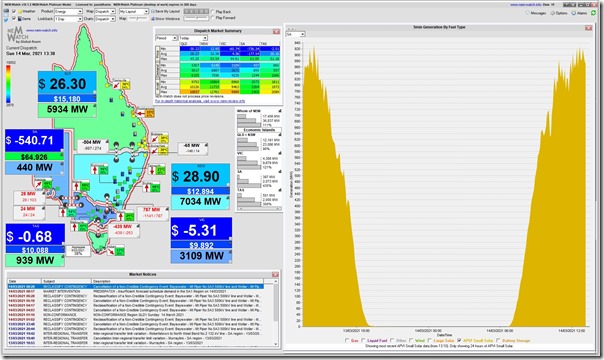
Possible reason 1) Some form of cloud cover across the SA rooftop harvest space has dampened output. The APVI estimates we receive, and add into NEMwatch v10 (snapshot 13:30), seem to indicated (i.e. by the jagged profile) that something might be happening:
Possible reason 2) Some form of market response in the Distributed Energy Resource space has reduced exports to the grid from rooftop PV, given the ongoing run of negative prices (such as some sustained orchestration of charging of household batteries). Because of the ongoing challenge of ‘the Invisible Man’ it’s really not possible to ascertain if this has been the case.
Possible reason 3) The AEMO in the Market Notice above talked about possible mandatory ‘curtailment of non-scheduled wind and Distributed PV’. Whilst there has not been any Market Notice (at this point) that might suggest this has actually happened, it should be flagged here as a possibility.
Possible reason 4) Some other change-from-forecast (e.g. temperature related) that would drive Underlying Consumption higher in SA.
Possible reason 5) No doubt there are others as well…
(B) About Interventions/Directions?
I noted above about possible Interventions to curtail rooftop PV.
It’s also pretty apparent, from the first NEMwatch snapshot above, that none of the operators of gas-fired plant in South Australia would be choosing to run their plant at such a large loss through today unless they were getting paid compensation in some way. I had a quick check, but could not pick out any particular notice that would suggest that they had been Directed (but I might have missed one).
(C) Market outcomes more generally?
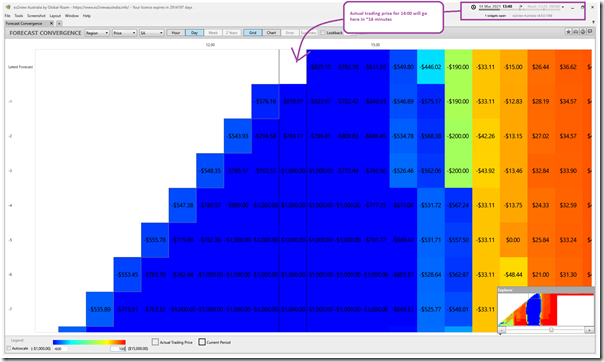
Whilst I have the ‘Forecast Convergence’ widget in ez2view open, I’ve quickly flipped to look at the evolution of (30-min) Trading Prices in SA:
By looking up verticals, we can see that the ‘actual’ trading prices (whilst still under –$500/MWh) are actually higher than they had been consistently forecast to be ahead of time … this would be at least in part because demand has turned out to be higher than forecast.
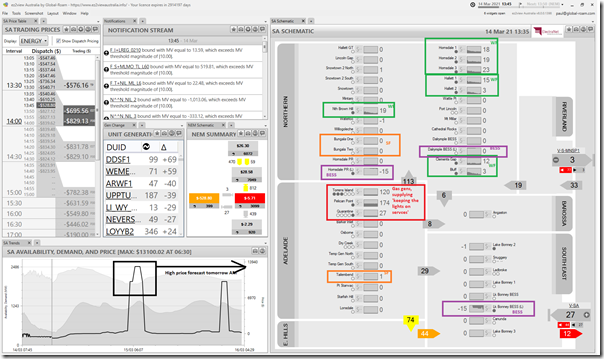
Flipping to show the ‘SA Region Schematic’ we can see which of the Wind and Solar Farms are still operating, even at these crushing prices:
Some quick notes about each:
(C1) Solar Farms
We see the three solar farms are all off – and, from the NEMwatch snapshot above, have been off since late in the 09:30 trading period.
The lateness of the curtailment does raise questions, as the 09:00 and 09:05 dispatch intervals were low, so I would have thought a decision could have been made at that time to switch off for the day?
(C2) Wind Farms
We see that most of the wind farms are off, with some exceptions:
C2a) Hornsdale 1, Hornsdale 2 and Hornsdale 3 Wind Farms
All three Hornsdale Wind Farms are still running … if I had more time, i would think more about what this might mean (as at least some of these projects are contracted to the ACT Government, I believe).
C2b) Hallett 1, Hallett 2, Hallett 4 (North Brown Hill) and Hallett 5 (Bluff) Wind Farms
The four operational Hallett Wind Farms are all running (note that Hallett 3 never was built). Note that these four are (I believe) some of those culprits that led to AGL Energy blowing away $1,920,000,000 in write-downs (which others have since mistakenly reported was related to their coal-fired assets, unfortunately).
C2c) Clements Gap Wind Farm
The Clements Gap Wind Farm is the 8th of the group that are still running, and paying bucket-loads of cash still do to so today (at least on spot).
(C3) Gas Plant
I’ve highlighted the gas plant that surely must be getting paid some compensation to continue running through the day (although I did not find a specific Market Notice on a direction).
(C4) Batteries
Also strange to note that, of the three Batteries currently in the SA grid, Dalrymple North BESS does not appear to be charging currently despite the low prices. Is it full, or is there some (FCAS-related?) reason why it’s not taking advantage of the opportunity to get paid good money to consume?
Interestingly, the current P30 forecast is that the trading price will be quite high tomorrow morning (presumably when wind is forecast to hit another lull, and solar has not yet cranked up for the day). Will see what eventuates…


I am in SA and have a solar system. My solar system was curtailed between about 2:45 tp 4 pm NEM time on the 14th March 2021. Mine is not the latest system with agent control, so I assume I was part of the 40MW reduction directed from substations. They must have raised the voltage above 453 volts. Anyone know how much they raised it to?
Sorry I meant 253 volts :–)