In a ‘normal’ summer (i.e. one influenced more by El Nino patterns) it seems that would be a more common occurrence what we saw this afternoon – but in the La Nina summer that is summer 2020-21 in the NEM, it was a rude shock to walk home from the office today in Brisbane in the heat and humidity.
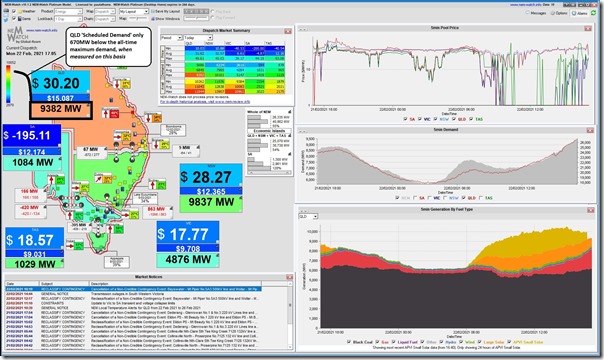
Arriving at home to start the shorter evening shift (starting to let clients know about the release of ez2view version 8, amongst other things) I noticed that the display copy of NEMwatch v10 had recorded that the ‘Scheduled Demand’ for the QLD region was up at 9,382MW for the 17:05 dispatch interval – as recorded here for WattClarity readers:
That’s well up in the ‘orange zone’ when scaled against the range of MIN and MAX levels seen over recent years. We can see at this point that the contribution from rooftop PV was waning (we see in the chart in the bottom-right that the APVI estimate had it pegged at 468MW at this time – so well down on a massive peak contribution up near 2,400MW around the middle of the day!
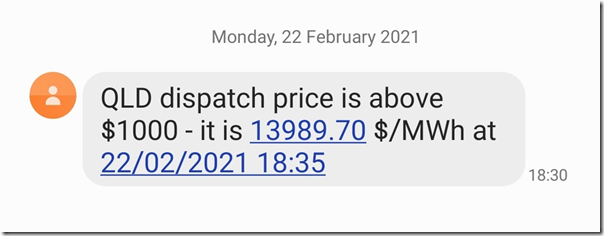
We also saw (90 minutes later) the dispatch price spike up to $13,989.70/MWh for the 18:35 dispatch interval:
At that point, the Scheduled Demand shown in NEMwatch was over the hump* and down to 9,284MW
* the Scheduled Demand peaked at 9,476MW at 17:40
In the 18:35 dispatch interval that the price had spiked, the APVI estimate had that the small-solar injection was down to 7MW whereas contribution from gas generation was up above 2,200MW (coincidentally roughly the same as what the estimated peak rooftop PV injection had been in the middle of the day).
(A) How rare was this demand excursion this summer?
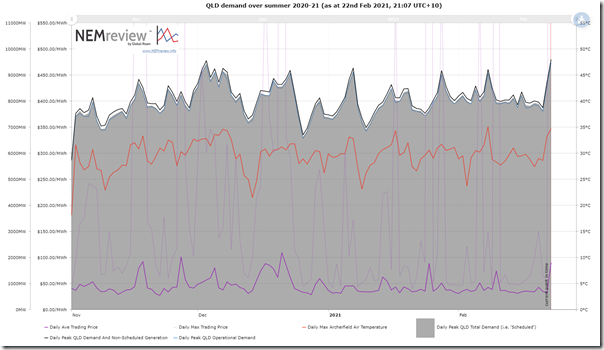
Curiosity got the better of me, so I quickly opened up this ‘daily max’ trend query in NEMreview v7 to identify the number of days through this summer period where the demand reached those sorts of levels:
As we can see:
1) Peak Scheduled Demand today was higher than on any other day this summer (with next highest being 2nd Dec 2020, right back at the start); and
2) Rising above 9,000MW was quite rare … today being only the 10th time so far this summer!
3) The peak ‘Operational Demand’ published by AEMO today was 9,473MW (AEMO talks about this measure more often these days).
(B) Comparison to the prior summer
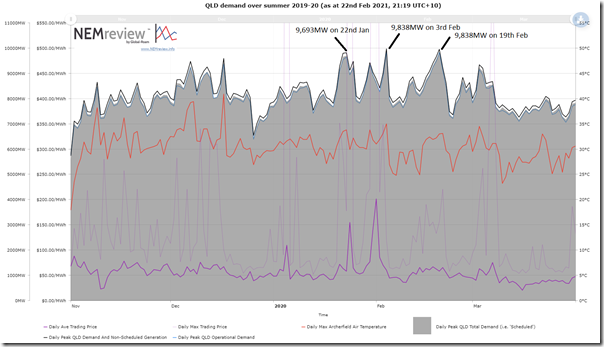
Comparing to summer 2019-20 (which was an extreme one, especially in the south) we see a clear difference (here’s the query with dates shifted and March 2020 added on):
With this chart, we can see that:
1) The highest points were noticeably higher (including 21st Jan 2020, 22nd Jan 2020, 3rd Feb 2020 and 19th Feb 2020).
2) Over the summer period, there were 15 days where peak Scheduled Demand exceeded 9,000MW (plus one on 3rd March 2020) … meaning this summer has seen 2/3 as many (and not quite as high), albeit summer’s not quite over yet.
(C) Longer-range trend
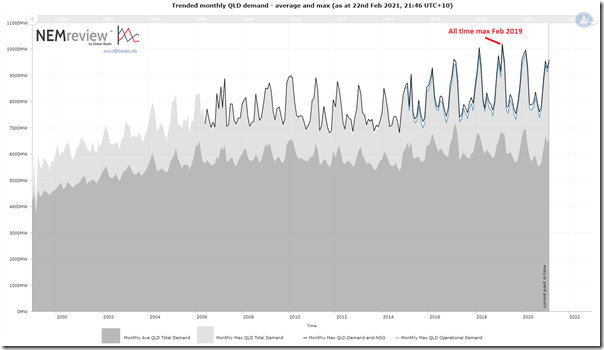
Finally, I’ve quickly thrown this query together also, to trend what’s happened over the 22 years the NEM has been in operations (all but 1999 we have been operating as well!):
We can see that peak demand for summer 2019-20 was lower than for summer 2018-19 in QLD (all-time max was 10,0052MW on Wed 13th Feb 2019) … with summer 2020-21 lower still. Note that average levels have their own (different) story.


Be the first to comment on "High temperatures drive QLD Scheduled Demand to 9,476MW (highest this summer, so far)"