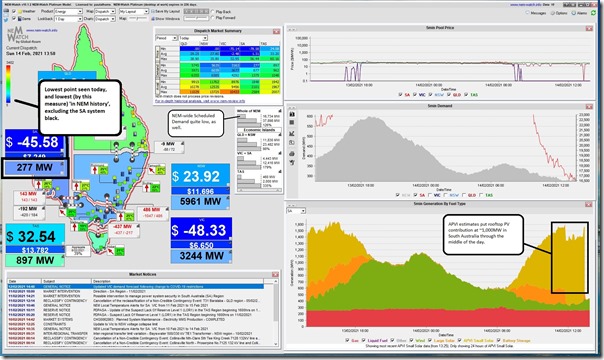
It’s still officially summer – though you would not think it was by looking at weather patterns in the southern part of the NEM, nor levels of demand. This afternoon an SMS alert I’d configured through our software (accessible in both NEMwatch and also ez2view) alerted me to a new low point for the ‘TOTAL DEMAND’ measure (at 276.65MW for the 13:50 dispatch interval (NEM time)):
I happened to be working at the time (preparing for the imminent release of ez2view version 8, amongst other things) and so was able to capture this snapshot from a display copy of NEMwatch v10 looking at the same dispatch interval:
A few quick notes on this afternoon:
(A) About the low point for demand
For those who are not familiar, here’s an article from a couple years ago discussing some of the gory details of how demand is measured in the NEM.
The AEMO talks more recently about ‘Operational Demand’ (which might be thought of as ‘Grid Demand’) whereas the ‘TOTAL DEMAND’ measure in the MMS is a closer match to ‘Scheduled Demand’ (which is a lower number, but one which AEMO has been publishing since the start of the NEM).
Without getting lost in the details, the key points are that:
1) The level of Underlying Demand was low anyway, because of the relatively mild weather; and
2) This translated to a very low level of Grid Demand (and Scheduled Demand) because rooftop PV was going gangbusters.
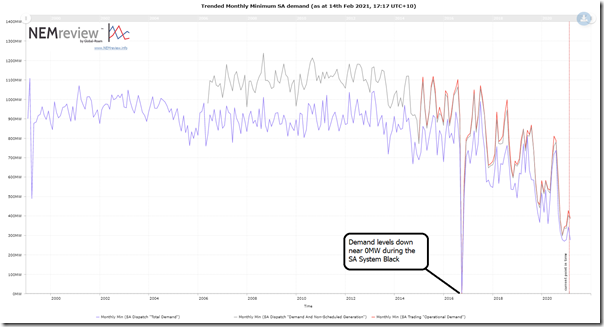
The low level achieved today (276.65MW) was only just a little more than the lowest we see happened since the start of the NEM (at 270MW at 13:10 on 7th November 2020 – only 3 months beforehand, and just before summer began), excluding September 2016 because of the SA System Black . We can see this using this pre-compiled query in NEMreview v7:
In contrast, however, we see that the ‘Operational Demand’ measure published by AEMO was significantly above the low-point published for that measure:
1) This was down at 300MW in the 12:30 trading period on Sunday 11th October 2020.
(a) You’ll see from the article linked here that the ‘TOTAL DEMAND’ figure had dropped to 278MW in the 12:20 dispatch interval, which remained the trigger level set in the SMS alert.
(b) Seems I had forgotten to bump the trigger lower on 7th November (nor did we publish an article then).
2) Coincidentally, the 11th October low point was just 11 days prior to AEMO releasing (the very timely) ‘Operational management of low demand in South Australia’.
(B) Prices negative
In what’s becoming a very frequent (and painful, for some) story, we see prices dropped below $0/MWh again in SA and VIC just after 07:00 and remained there through until this low point was reached … remaining there still even when this article is being published.
(C) About the Fuel Mix at the time
As noted on the image above, estimates of rooftop PV injections (from APVI, in this case) were that there was roughly 1,000MW being injected in South Australia through the peak of the day (and almost 5,800MW NEM-wide). However there are other stories in the fuel type mix, as well:
(C1) Gas generation steady
There was a steady injection of a little over 250MW through the day given the continued role (at least until these 4 new assets take up some of the slack) in supplying System Strength.
(C2) Low Wind production
Through the middle of the day, aggregate production across all wind farms in South Australia briefly dropped down below 100MW (contribution was up around ~180MW at the 13:50 low point in demand). We won’t know, until tomorrow, the details about who was ‘economically curtailing’ (in response to negative prices) and how much was because of a general lack of wind. I’ve also not looked specifically at the impact of constraints.
However I did note that even those wind farms that have hurt AGL Energy because of legacy PPAs (without negative price exclusion clauses) were barely producing anything at the time.
(C3) Large Solar
In the snapshot from NEMwatch v10 above, we can see that supply from Large Solar also reduced to nothing prior to 12:00.
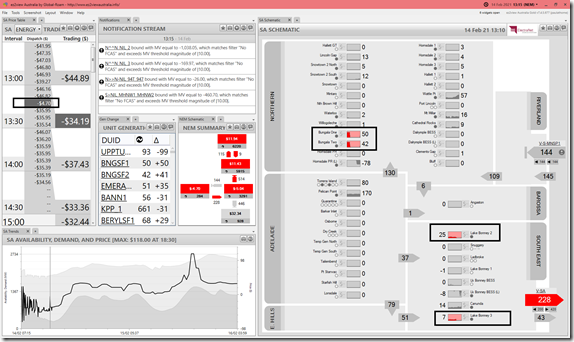
However I was a bit surprised to see a spike in output a half hour prior to the low point in Scheduled Demand for the day – this was captured better in this snapshot from ez2view, Time-Travelled back to the 13:15 dispatch interval to ensure that generation output was showed as ‘end of interval’ (i.e. Final) values:
I’ve highlighted how 4 Semi-Scheduled plant (Bungala 1 SF & Bungala 2 SF – along with Lake Bonney 2 WF & Lake Bonney 3 WF) all seem to ramp back up off 0MW coincident with a price rise (albeit to still remain just below $0/MWh). If they were expecting to run very long, that was short-lived…
Also noted that, in this dispatch interval at least, there are no constraints shown as binding on the DUIDs shown around South Australia.


Shows the need for those sync cons to come online as soon as possible. Also shows the need for the SA Government to move residential hot water to smart controlled loads.
So Syncons + automated demand response as Craig suggests will possibly see zero gas sometime next year if not 2021