
From the wealth of data in the newly-released Generator Statistical Digest 2020, this post examines the much-discussed role of gas-fired generation in the transition of the NEM’s generation sector, as ageing thermal generators leave the market and renewable generation continues to enter, driven by a mix of policy instruments and rapidly falling costs.
Lots has been said about the pros and cons of greater use of gas in the NEM as this transition proceeds. No lesser authority than the Prime Minister assures us that “there is no credible energy transition plan for an economy like Australia that does not involve the greater use of gas”. But in many of these arguments there’s been no historical review of how gas generation has been faring under the transition to date. And after all, we have already been on this journey for something like fifteen years, although it only picked up meaningful momentum over the last decade with policies like the expanded Renewable Energy Target and rooftop solar subsidy schemes driving accelerated renewable investment. Retirements of larger thermal power stations like Hazelwood in Victoria, Wallerawang in NSW, and Northern in SA only began in 2014 or so.
Having been in the industry for far too long, I recall discussions from at least the early 2000’s about gas being the “transition fuel” on the road to lowering the emissions intensity of Australia’s generation fleet. The view was that by shifting generation away from CO2-intensive coal-fired power stations to more modern and efficient gas-fired generators, the sector could at least buy time for advances in the feasibility and / or economics of much lower emissions technology – renewables of various types, carbon capture & storage etc. How has that worked out so far?
A Focus on CCGTs
All the significant new fossil-fuelled generation commissioned in the NEM since 2007 has indeed been gas-fired – about 5.7 gigawatts or roughly 10% of the NEM’s capacity. Nearly three quarters of that capacity has been “open cycle” gas turbine technology, and about a quarter more fuel-efficient “combined cycle” (CCGT) plant which pairs one or more open cycle turbines with a heat recovery steam generator to produce electricity from energy otherwise wasted in the gas turbine exhaust stream.
Because it was the gas-fired technology principally expected to mitigate emissions under that early view of the energy transition – being more efficient – I’ll focus on the NEM’s CCGT generators through the lens of the GSD, along with a couple of older intermediate-efficiency steam-cycle plants. I’ll then conclude with a few brief thoughts on what’s been driving the trends seen so far and whether they may change as the transition continues.
These are the stations I’ve looked at from the GSD2020 (highlighted entries are CCGT plants):
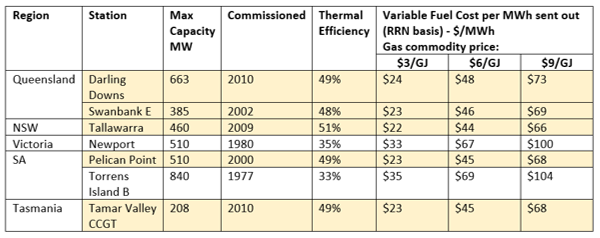
The last three columns of the table are estimates of just the short-run variable cost of producing electricity from these stations at different gas prices – with no allowances for other operating costs (fixed or variable), fixed gas transmission charges, or returns on capital invested. These are useful reference points when looking at average spot prices and unit revenues earned by these generators.
I’ll now step through the GSD’s view of ten year trends in operation of these stations as well as their 2020 operating profile:
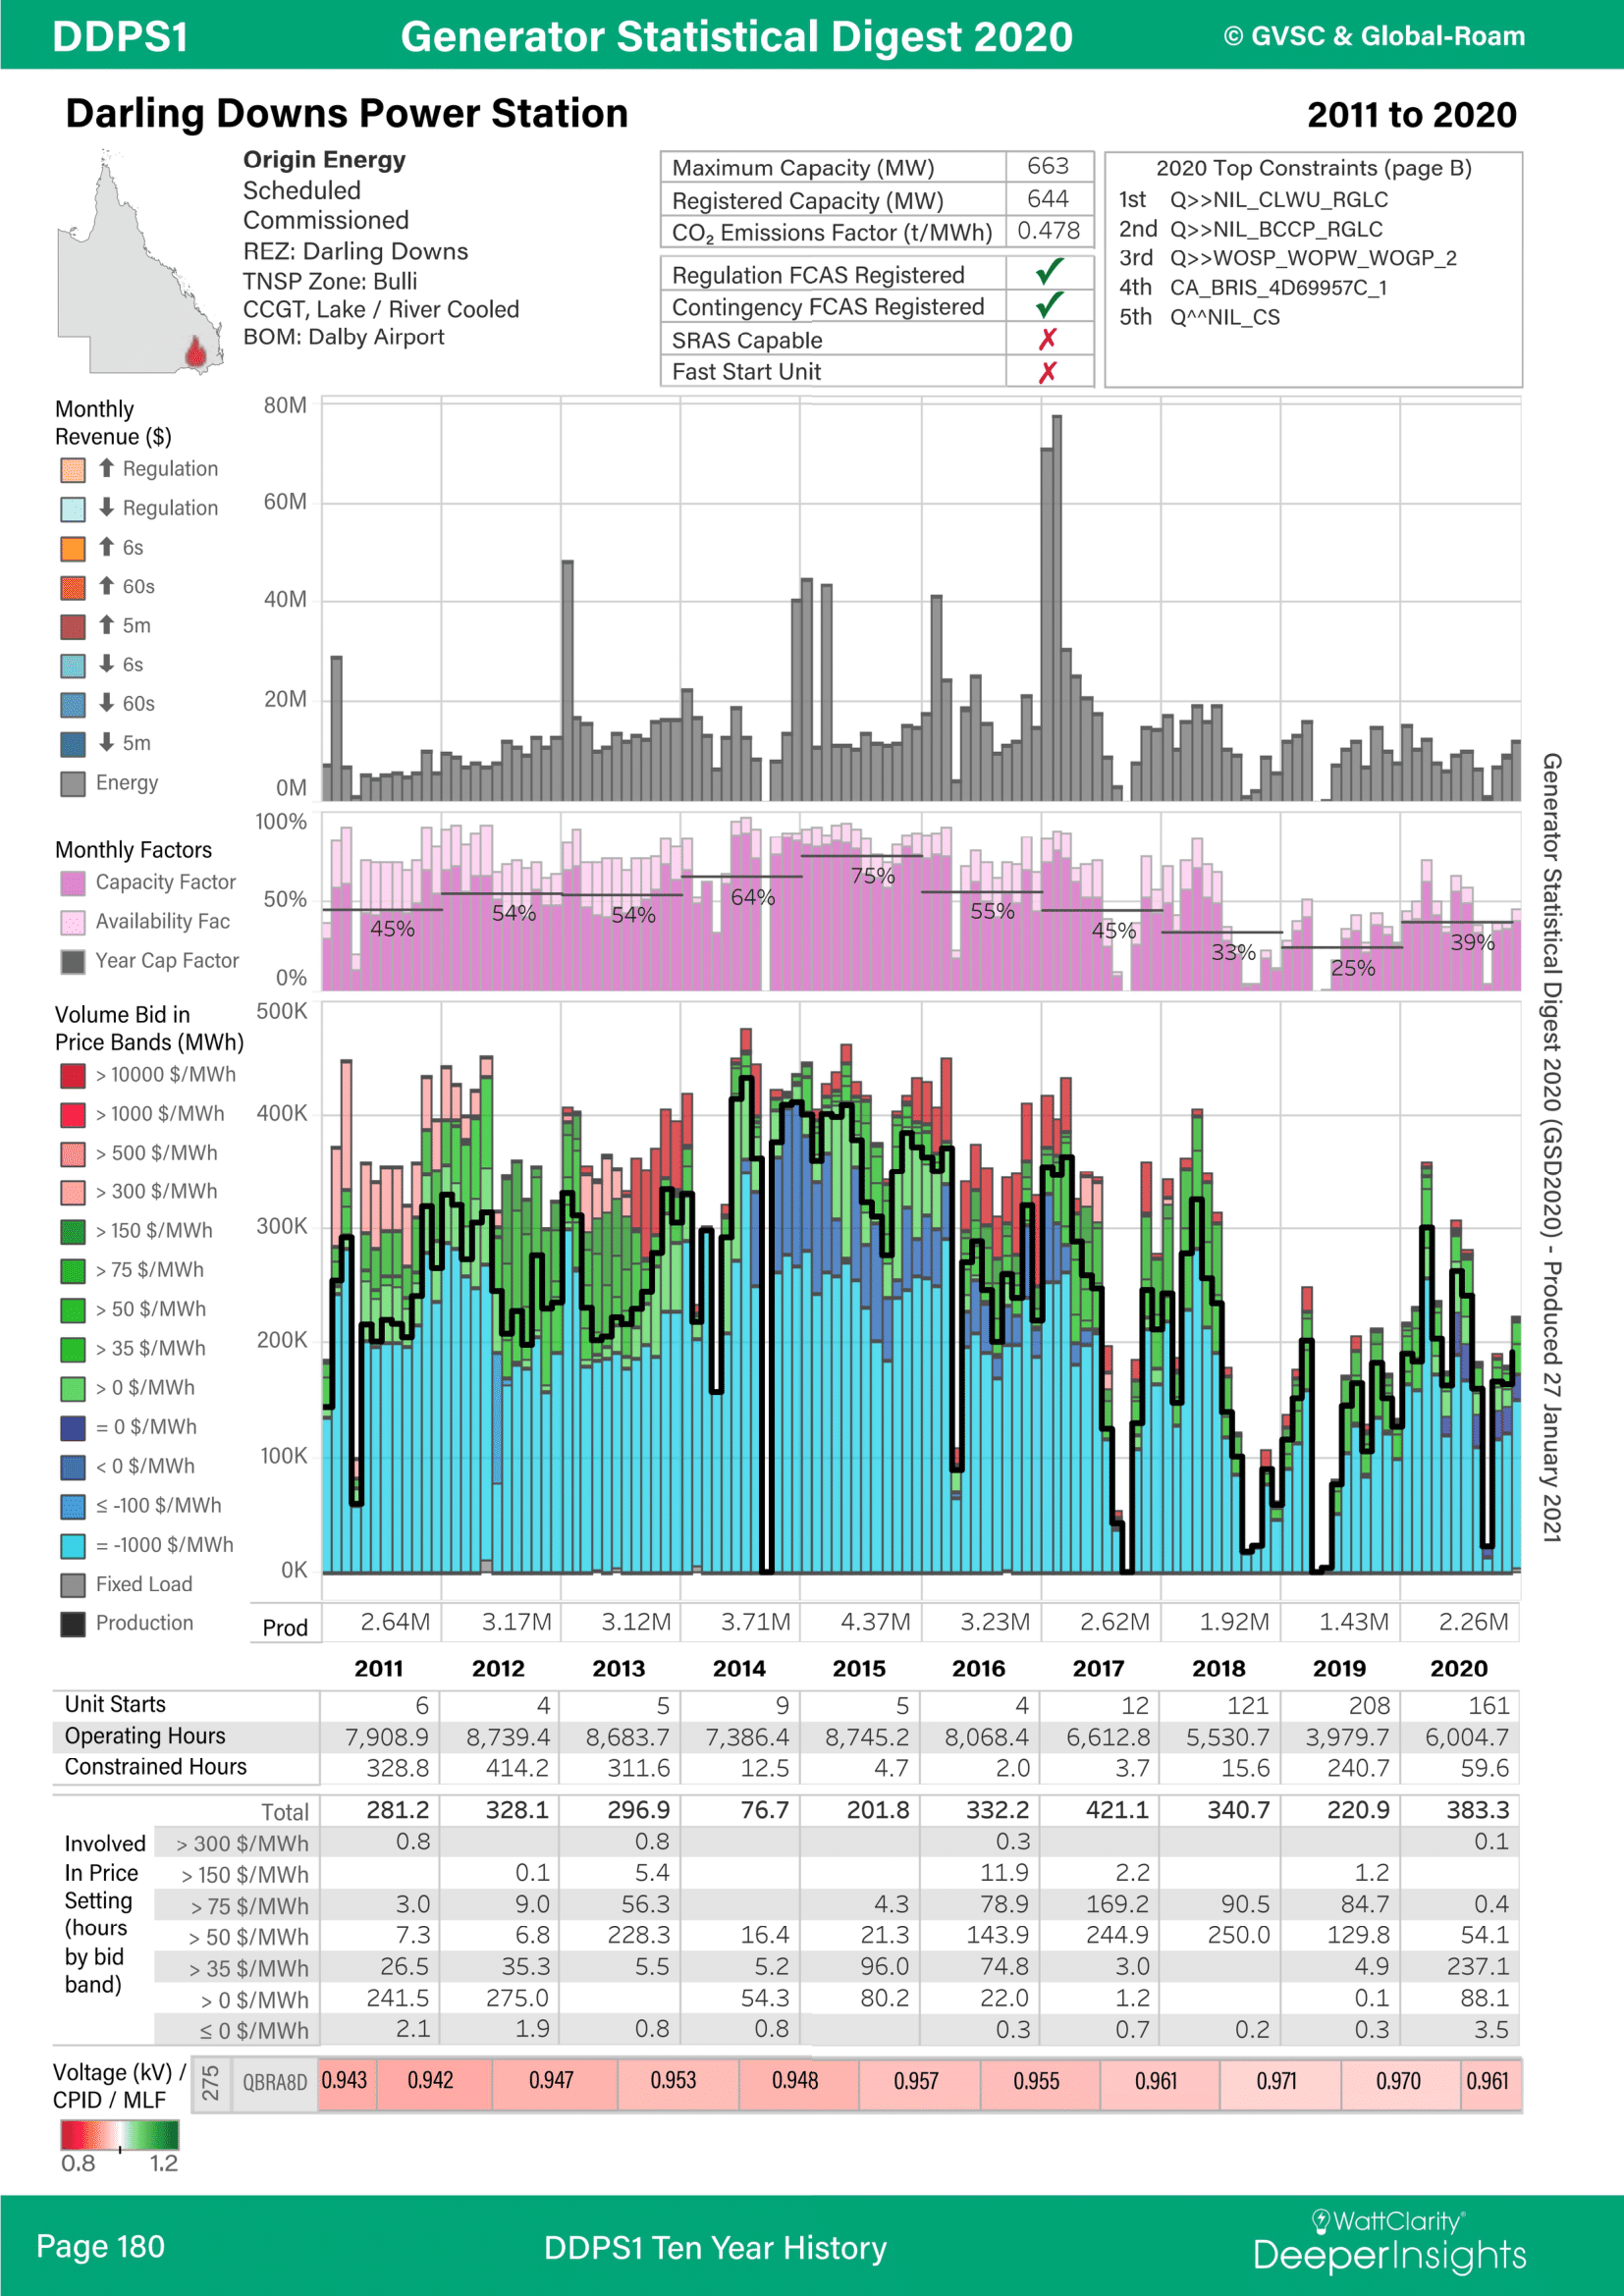
Darling Downs Power Station
Darling Downs in Queensland shows a significant reduction in operating profile from mid-2016 onwards with capacity factor falling from the 65-75% range to 30-40%. Also notable is the increase in number of unit starts from only a handful per year (indicative of the station running continuously for long periods) to 100-200 starts per year more recently, meaning that the station is regularly going offline rather than running at low output levels during offpeak periods as it was in the first half of the decade.
The 2020 detail panel shows further the degree of variability in daily and monthly operating profile. Finally, it’s instructive to compare the regional and station-weighted prices earned in 2020 to the range of fuel-only variable costs in the summary table above – with $3/GJ gas the station would be earning an appreciable operating margin towards covering fixed costs, but with $6-9/GJ gas would become more economically marginal.
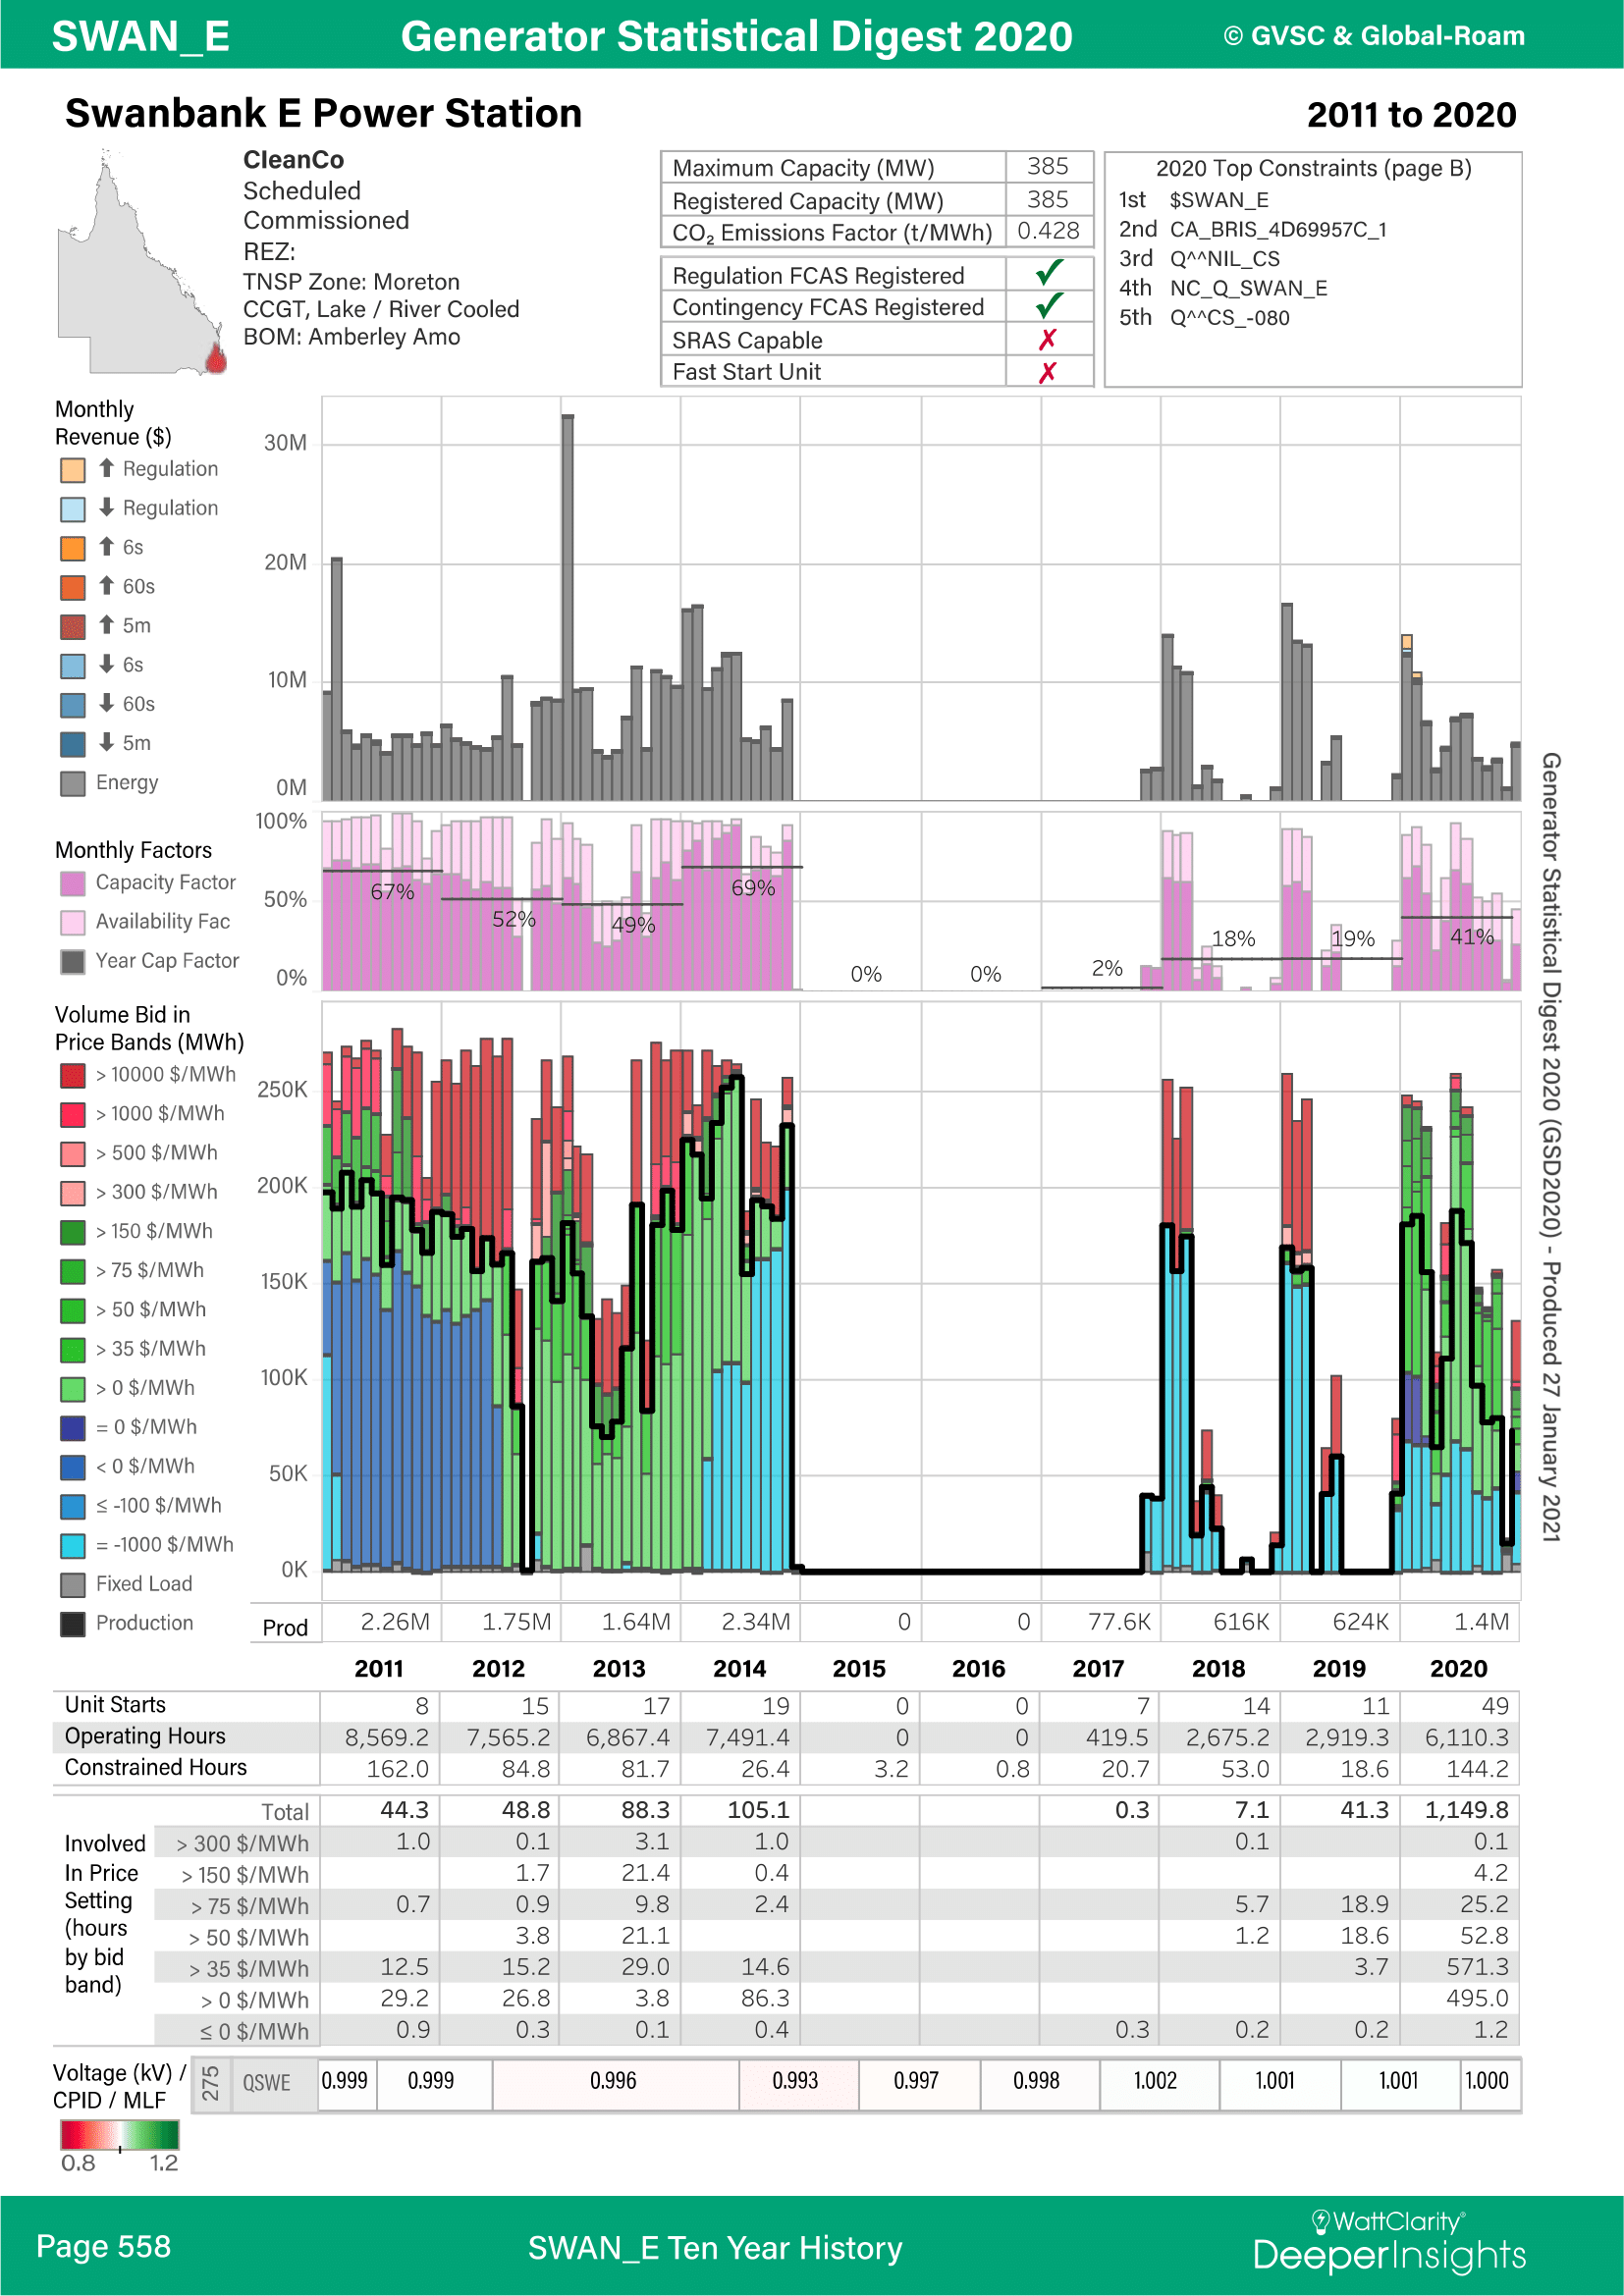
Swanbank E Power Station
Queensland’s other CCGT Swanbank E shows a much starker change in profile after 2014, sitting idle though 2015, 2016 and most of 2017. Well-publicised at the time was the decision of Swanbank’s then owner Stanwell to mothball the station and on-sell its gas to the nascent Queensland LNG sector. Even after returning to operation in late 2017, Swanbank operated in much more limited fashion until 2020 when it resumed something closer to the operating profile seen for Darling Downs, although with longer periods of continuous operation in the first half of 2020.
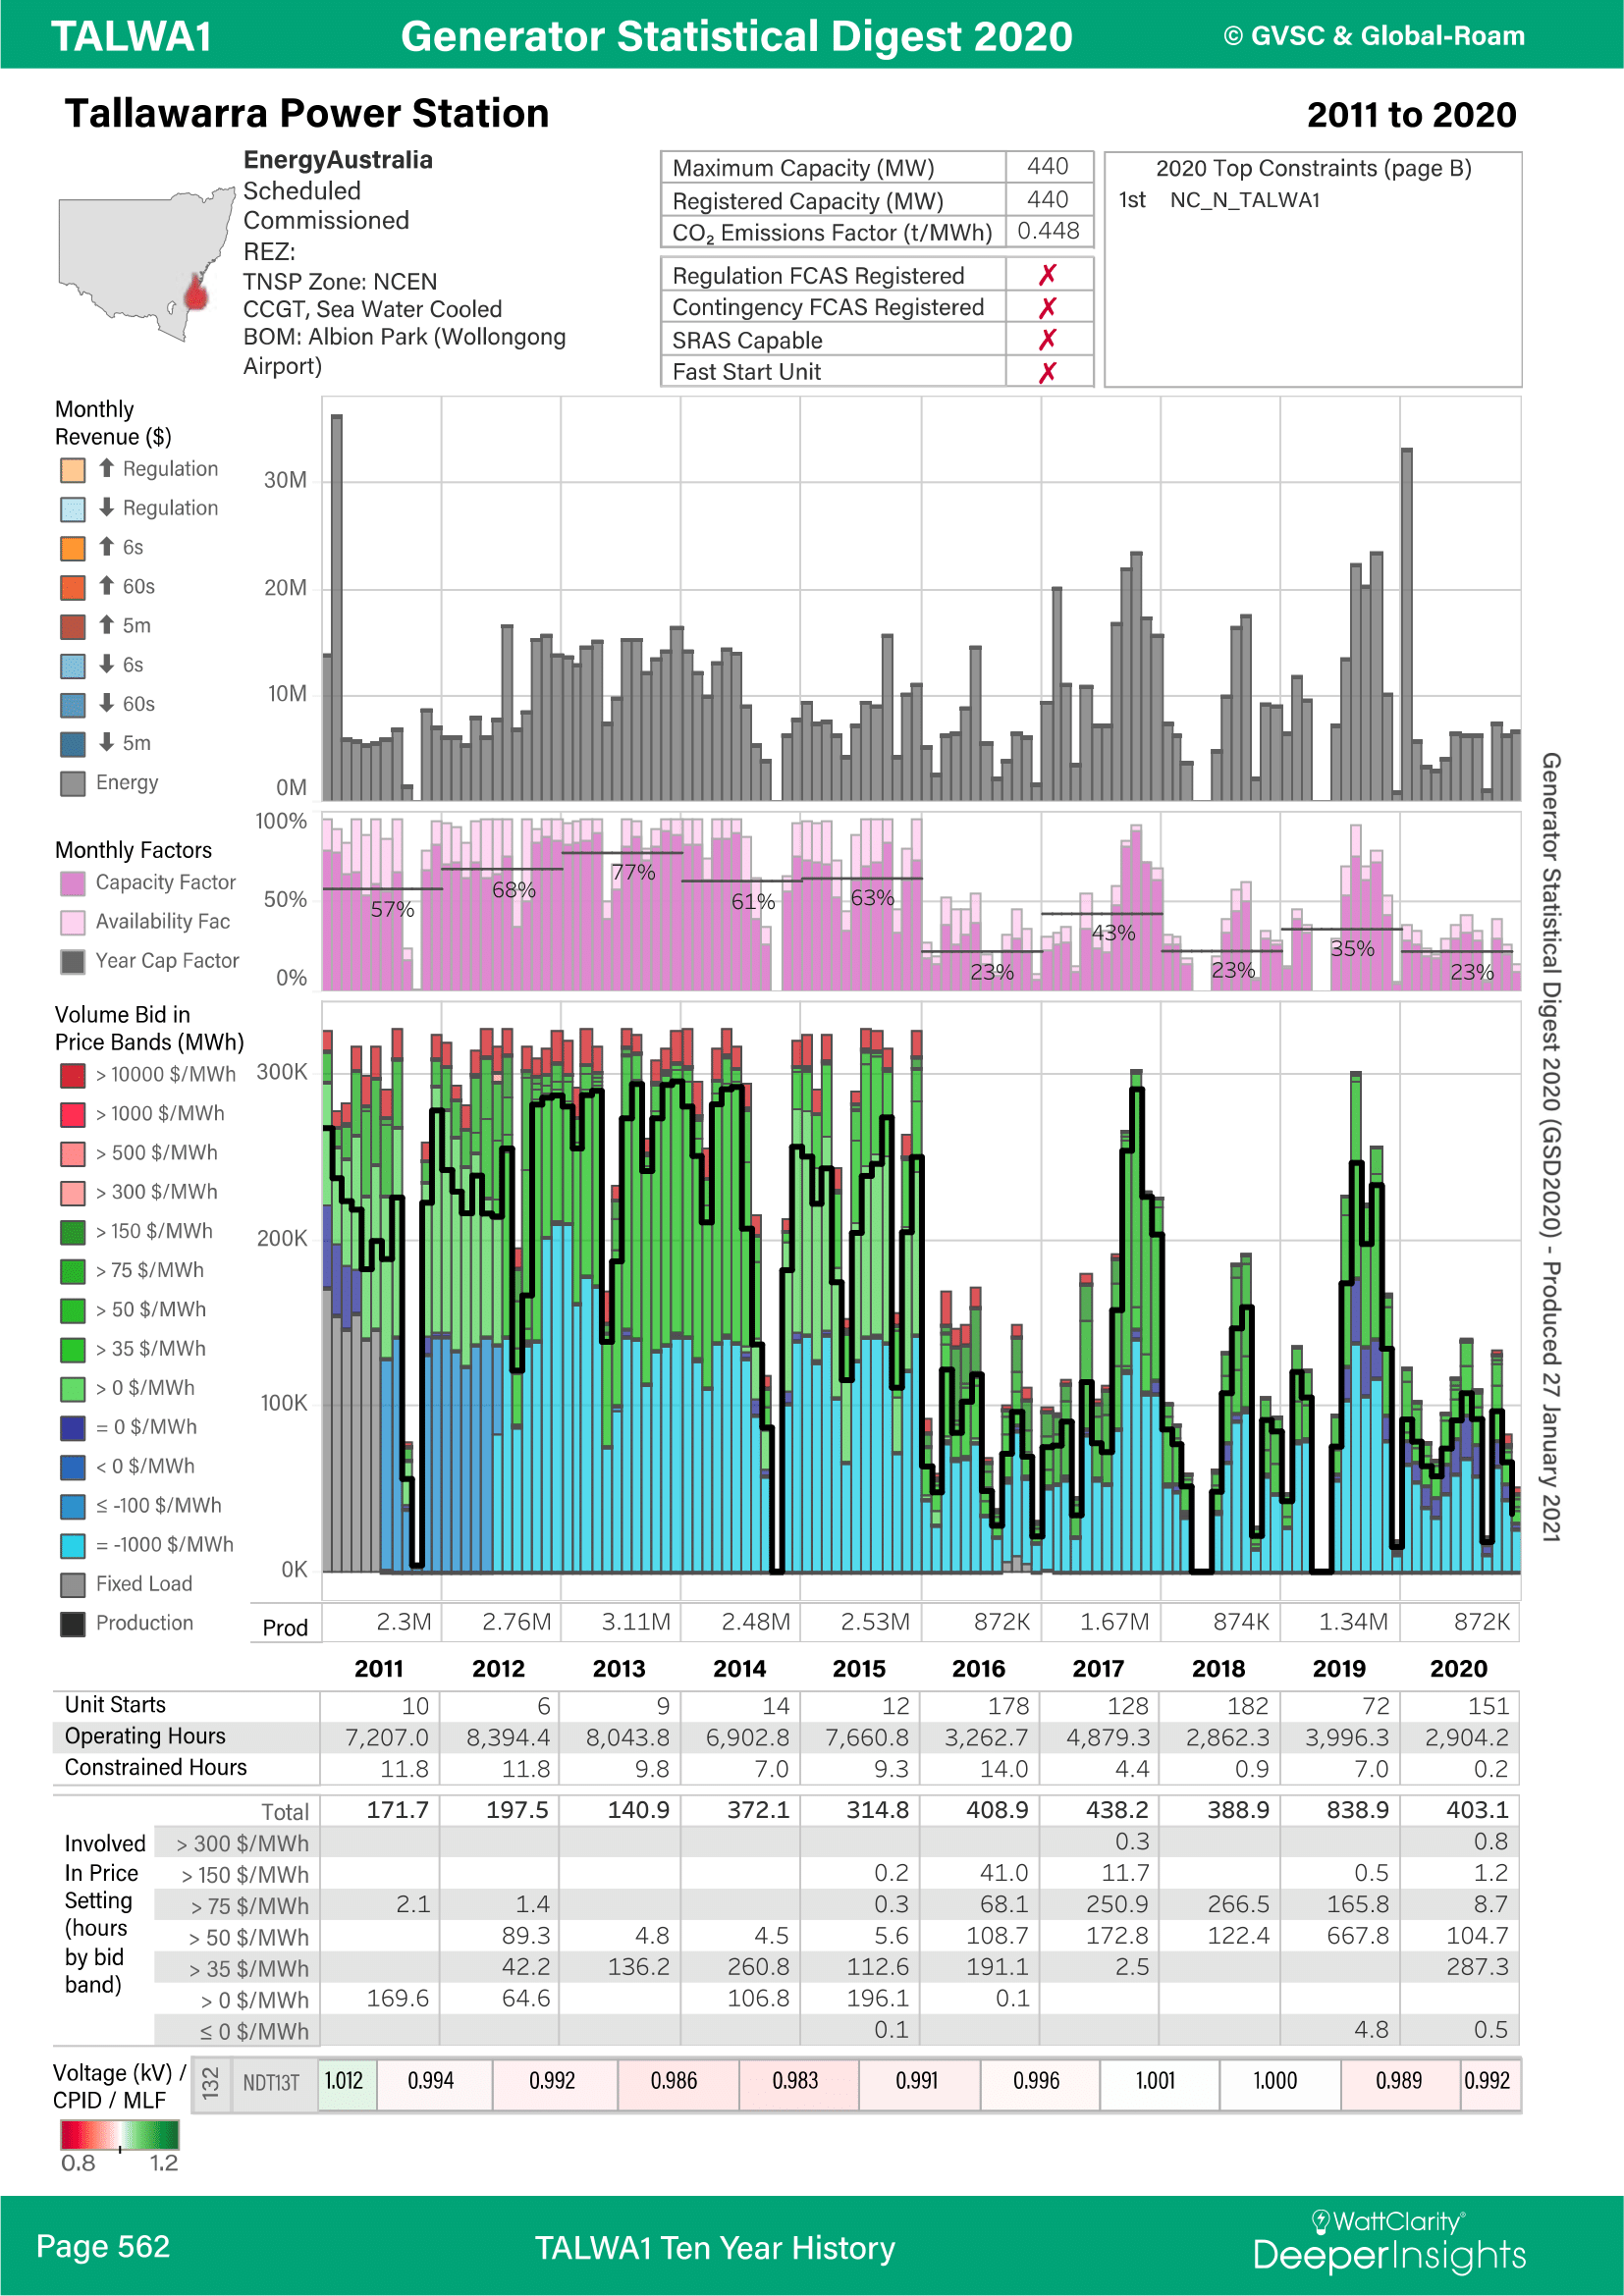
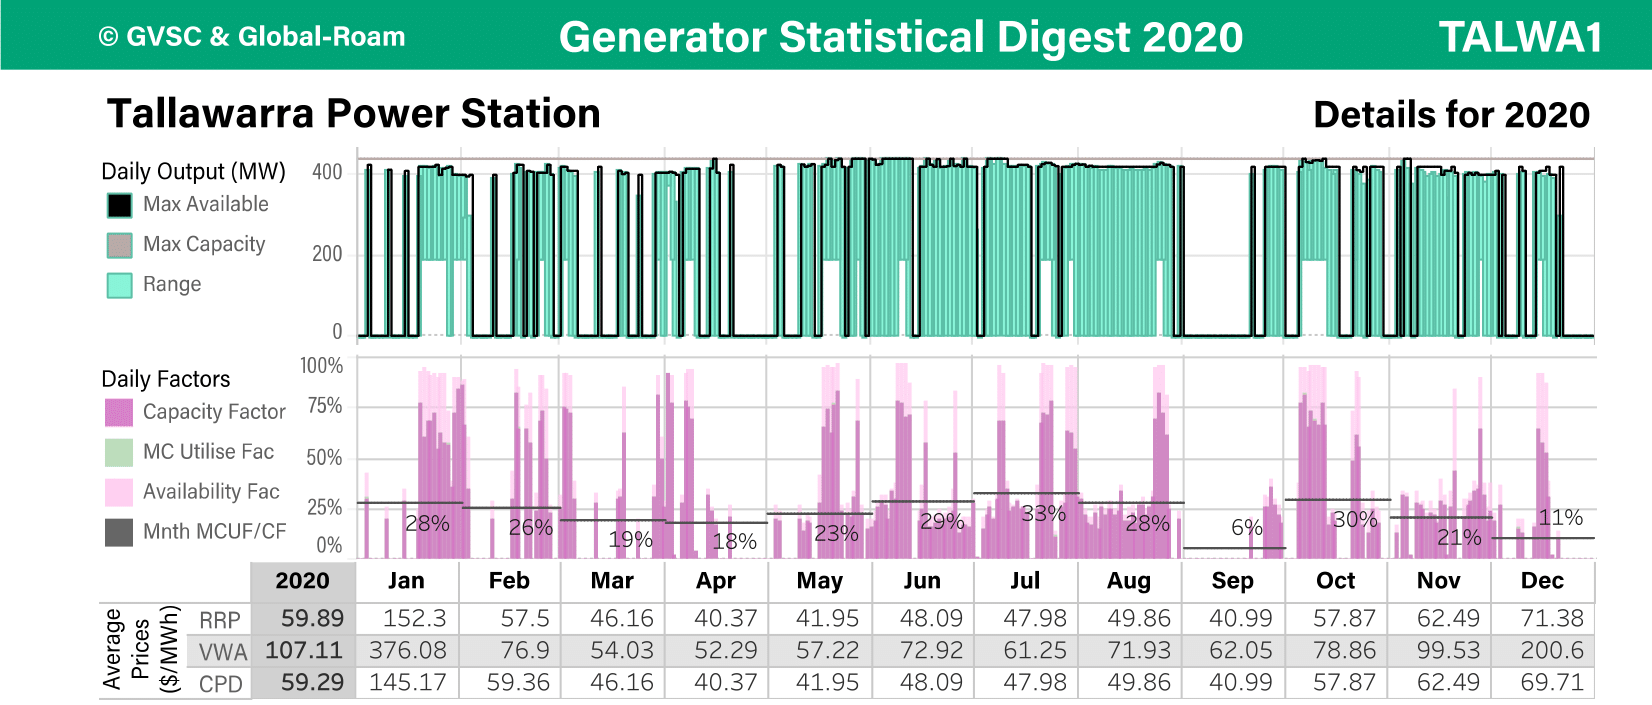
Tallawarra Power Station
In NSW, Energy Australia’s (EA’s) Tallawarra shows a similar pattern to Darling Downs, with utilisation plunging after 2015, apart from some bursts of higher activity in the second halves of 2017 and 2019. These were due to well-publicised coal shortages EA’s Mt Piper Power Station in NSW, prompting EA to replace some of its lost output by running Tallawarra.
Like the Queensland CCGTs, Tallawarra’s 2020 profile (and number of unit starts) shows a much more intermittent running regime than in its early years of operation.
Moving south to Victoria, that state has no CCGT stations – quite surprising if the view was that efficient lower-emissions gas technology could replace high-emissions brown coal generation. (I even remember then-shadow Environment Minister Greg Hunt at one time talking up the prospects of converting brown coal power stations to run on gas!) However that would be to ignore the very low variable fuel cost of brown coal generation whose capital costs are already sunk, which has always made the economics of investing in directly-competing plant with significantly higher fuel costs a challenging proposition.
Newport Power Station
The closest thing in Victoria to a CCGT plant is probably Newport, a now-superceded technology known as gas-fired steam cycle (pretty much like a coal-fired plant but with a gas-fired boiler). In terms of operating profile, Newport was already struggling in the early 2010’s and somewhat unexpectedly made something of a comeback after Hazelwood’s retirement in Q1 2017.
But we can see that in 2020 the plant’s profile returned to being much more intermittent, while the Volume Weighted Average (VWA) price series shows its operation clearly being targeted at periods of relatively high spot price – not surprising given its lower efficiency and significantly higher short run marginal cost than CCGT plant.


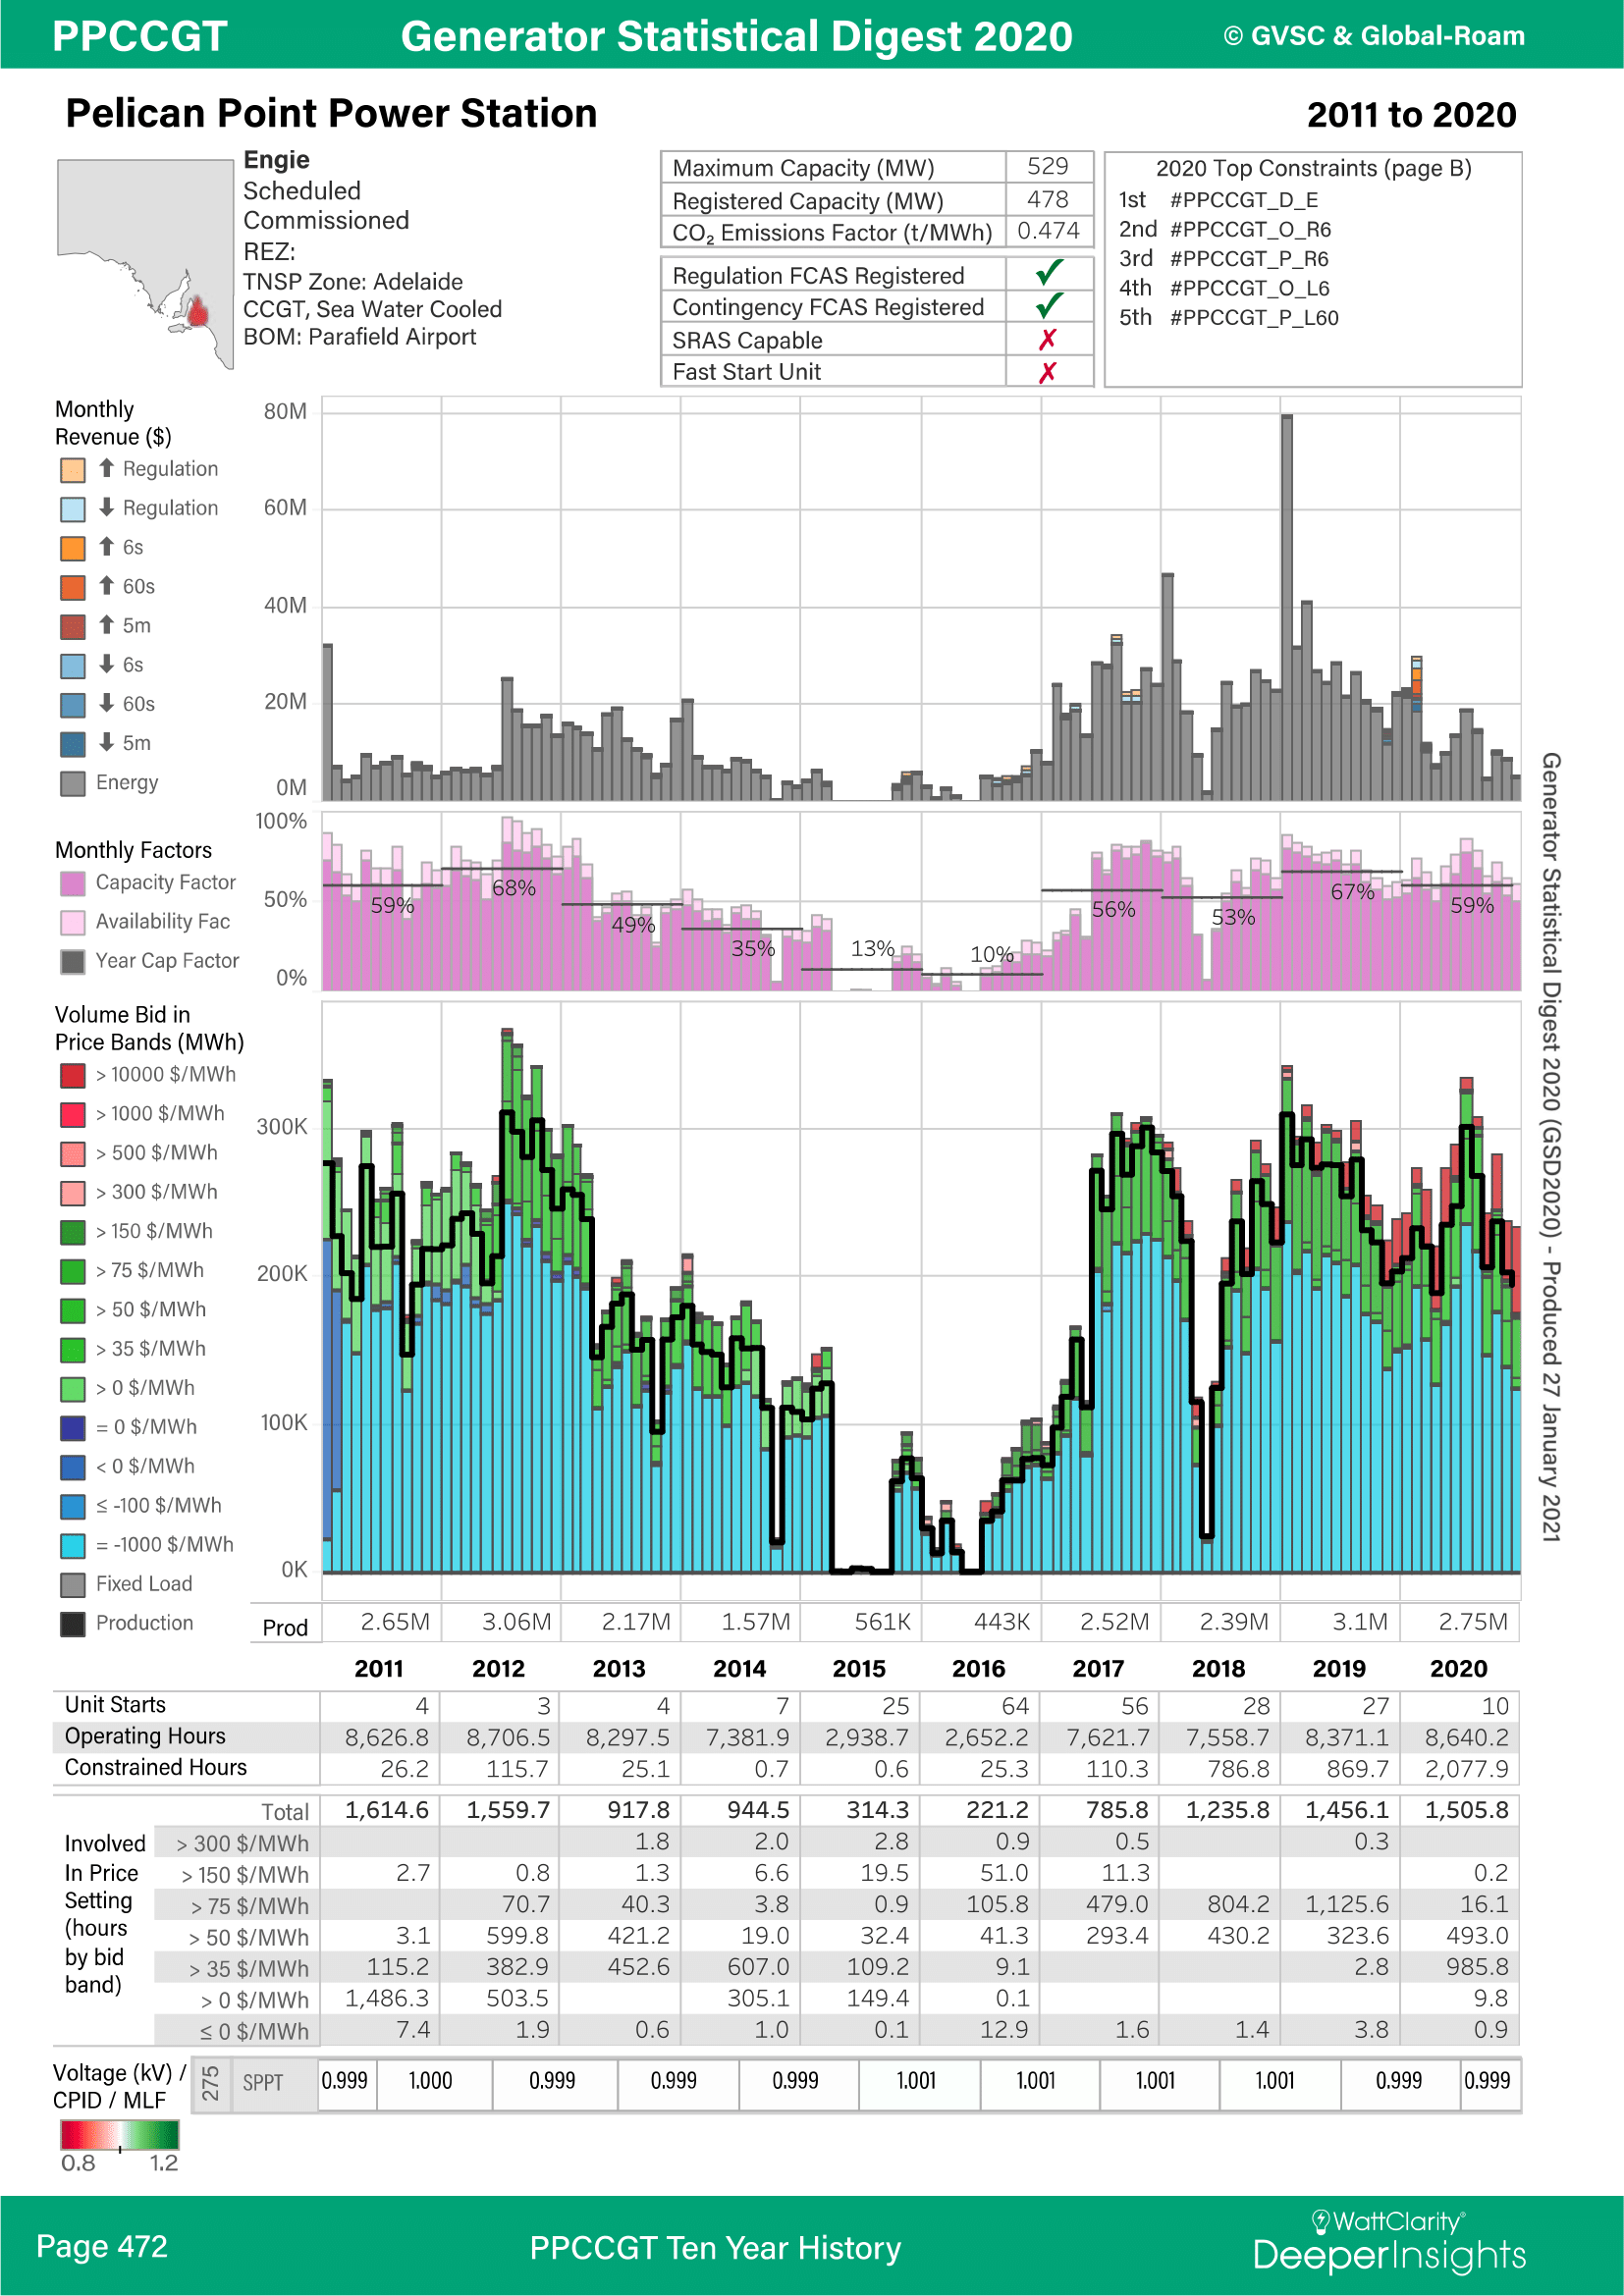
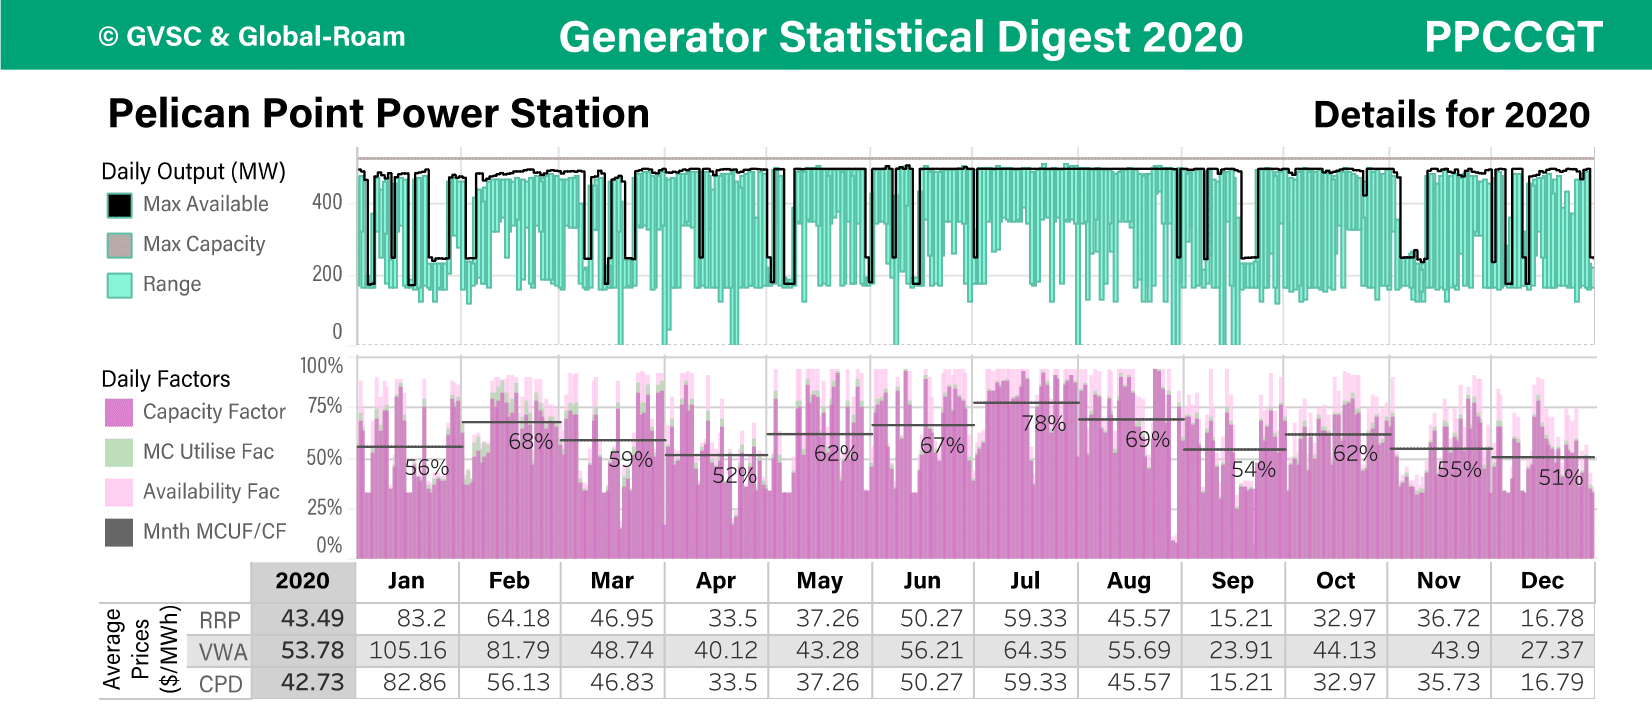
Pelican Point Power Station
Across in South Australia, Pelican Point was the first CCGT built in the NEM, commissioned in 2000, but from as early as 2013 its operating profile declined to very low levels, until it returned in mid-2017 to much more typical profile for a CCGT in the 60-70% capacity factor range. The reasons for its changes in operating regime are quite complex, but two key factors in its recent resurgence are that:
- with the retirement of the coal-fired Northern Power Station in May 2016, Pelican Point became the lowest marginal cost thermal power station in South Australia, and
- one of its recent roles has been in maintaining “system strength” in South Australia under direction from AEMO. This involves the station being directed to run (and being compensated for doing so) during periods of low price when it would otherwise go offline for economic reasons.
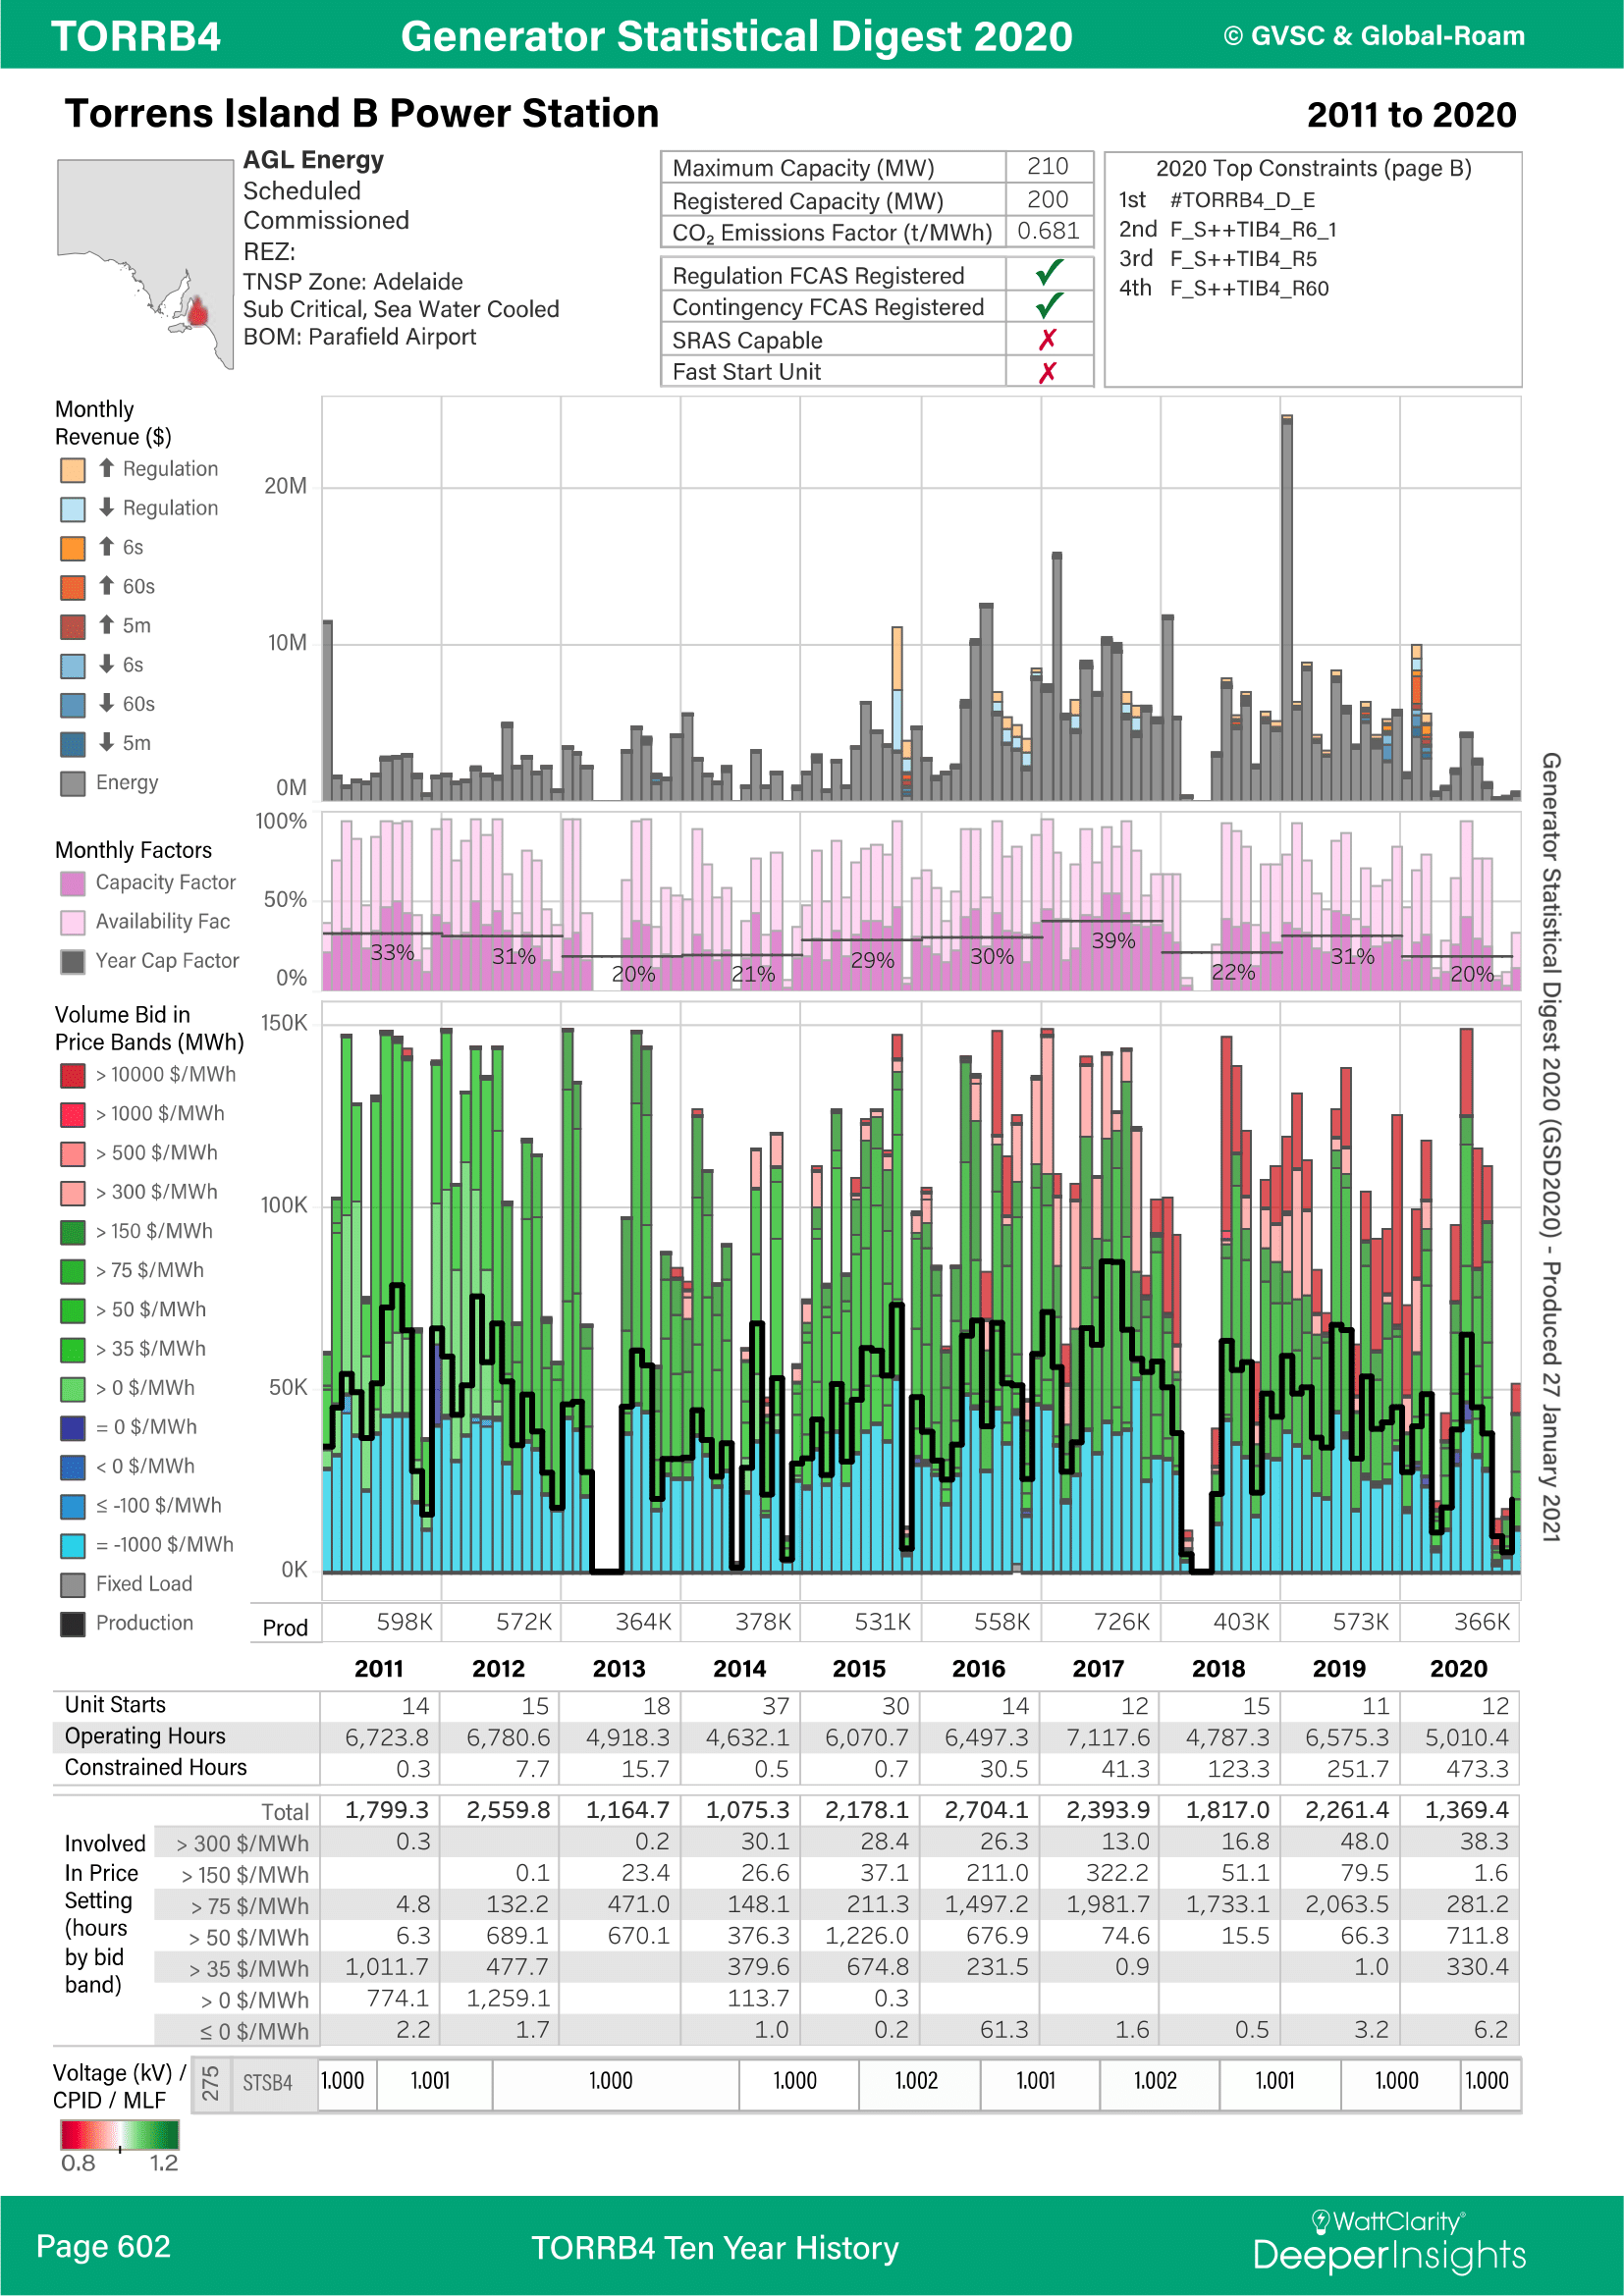
Torrens Island B Power Station
For comparison with Pelican Point I’ve included the profile for one of the four units at AGL’s Torrens Island B station in South Australia, employing the same gas-fired steam cycle design as Newport. Overall this shows probably the least change in operating regime across the last decade for any of the gas plants covered here.

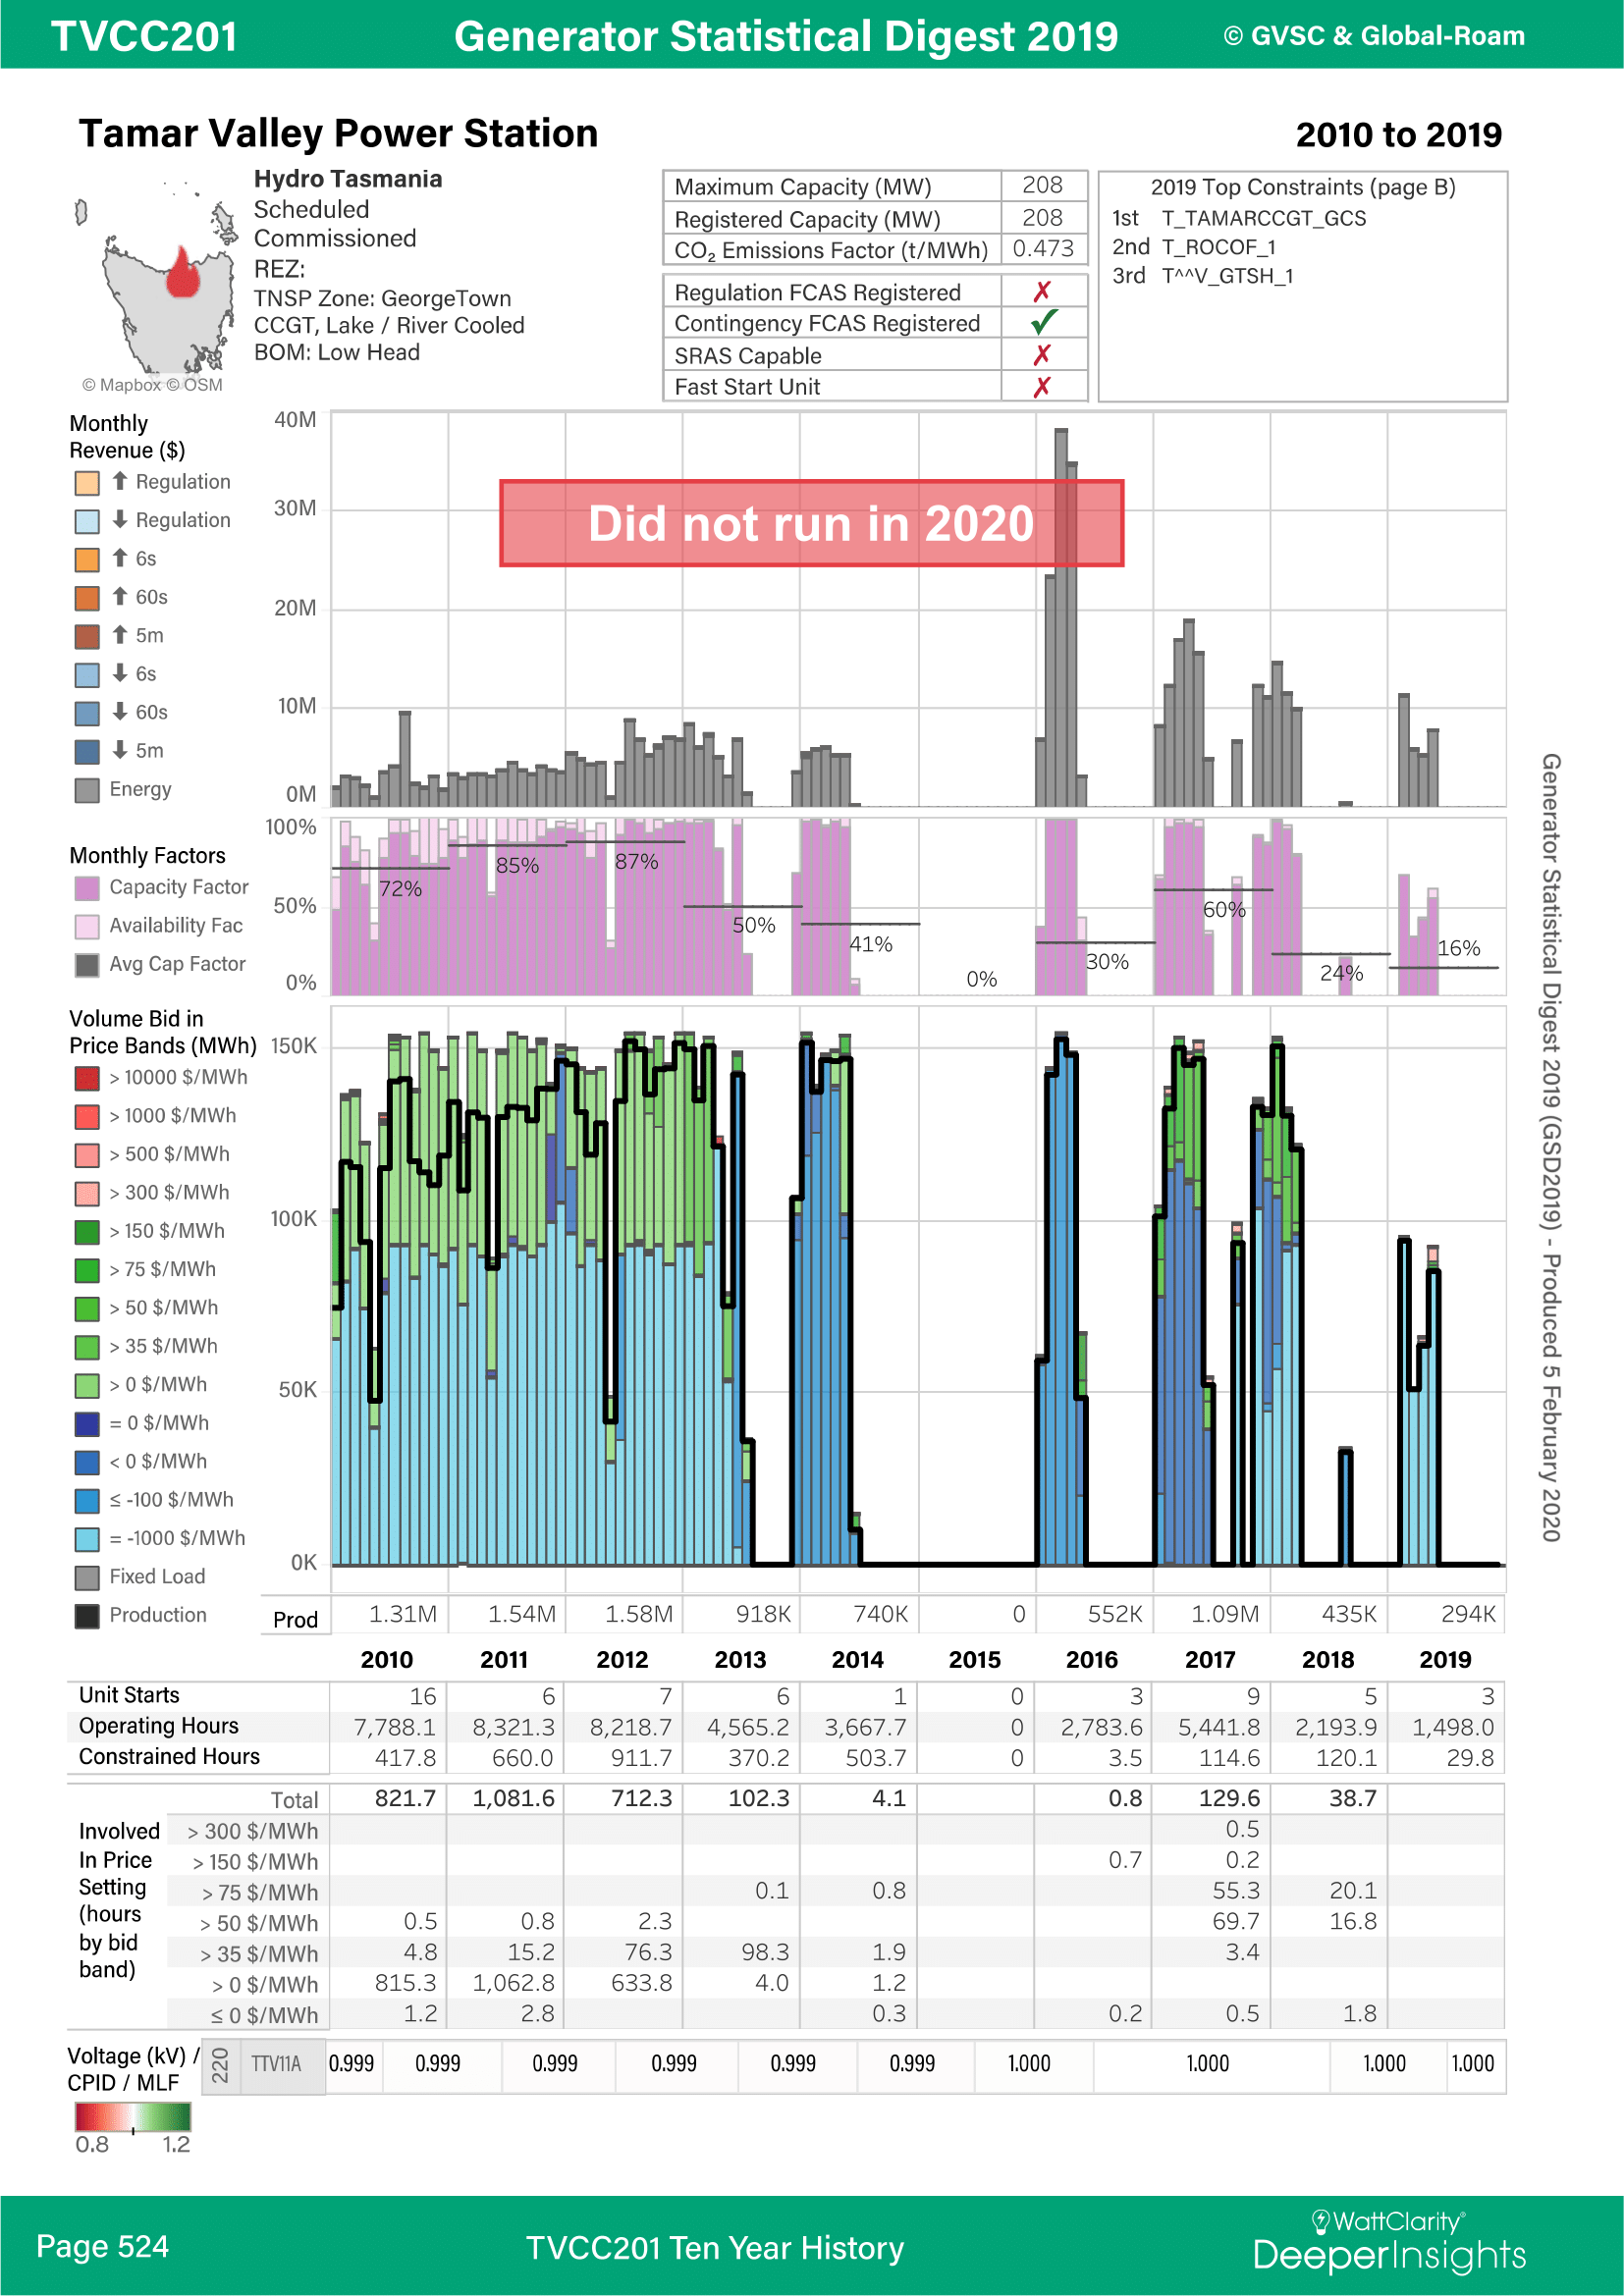
Tamar Valley Power Station
Finally, anyone looking in 2020 GSD for Tasmania’s only CCGT plant at Tamar Valley won’t find it, because it didn’t run at all in 2020, having been in effect mothballed in May 2019. But prior to that we again see, from the equivalent page of the 2019 GSD, that its utilisation plunged after 2012.
While there were various individual factors affecting the different CCGT stations highlighted above, it’s clear that their running regimes have become much more variable and in most cases their utilisation lower – often much lower – over the last 5 or 6 years as the energy transition has picked up speed. And although these stations are more physically flexible than coal-fired plant, these changes probably haven’t been good news for their economics.
An Overall Picture
As I noted earlier, more of the NEM’s recently built gas-fired generation has been the less efficient but even more flexible open cycle gas turbine technology. Without looking at every one of these stations in detail, would including them change the picture for recent trends in the amount of gas-generated electricity in the NEM?
No. Here are the changes in NEM generation output (annual energy production) by energy source over the interval from 2015 to 2020:
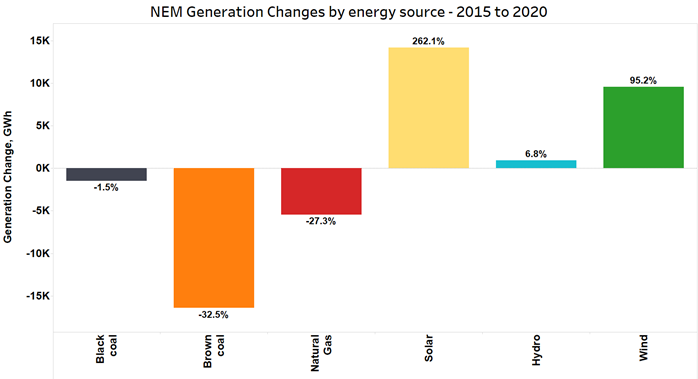
Annual brown coal generated output dropped significantly with the retirements of Hazelwood (2017) and Northern (2016), and there have been strong increases in wind and solar (including small scale PV, accounting for more than half the increase charted). Virtually no change in black coal (note that Wallerawang retired in 2014, prior to the period charted).
But despite its posited role as a “transition fuel” to either replace coal-fired output or complement intermittent renewables, there was actually a fall of more than 25% in annual gas-generated electricity. Output lost from brown coal generation was more than offset by increased renewables, with gas making no headway against black coal.
This probably isn’t the outcome expected by participants who invested in new gas-fired stations from the early 2000’s onwards, expecting to benefit from gas’s “transition fuel” status.
Brief Reasons and Conclusions
The sharply rising price of gas in the Australian east coast market since mid-2016 has been a major factor in making gas-fired stations more economically marginal and forcing down their utilisation, as has the hollowing out of demand during sunny and windy periods as increasing renewables capacity has been added to the NEM, both large and small scale. In the absence of any emissions pricing mechanism, coal-fired stations maintain a significant short-run cost advantage over gas, meaning the gas stations tend to be squeezed out of the dispatch stack when renewable output increases or grid demand falls.
So does this mean that the originally-envisaged role of gas as a “transition fuel” was an illusion? In a superficial sense the answer seems to be yes, simply because since the mid-2010’s we have seen a marked decline rather than a steady increase in the amount of gas used to generate electricity in the NEM. Recent falls in the generation sector’s emissions intensity have been almost entirely due to the increased penetration of renewables. Modelling by AEMO for its most recent Integrated System Plan doesn’t forecast any near-term change in this picture. And it’s very hard to foresee a scenario where gas replaces coal as the NEM’s “workhorse” primary energy source, a view that did seem at least partially credible at the turn of the century.
On the other hand, projections are inherently uncertain and the fact that the amount of energy generated from the NEM’s fleet of gas-fired stations has declined recently doesn’t necessarily mean that the need for their capacity at peak times has fallen equally, nor that they might not be required to periodically generate more frequently if, say, coal-fired generation exits the market even more rapidly than envisaged.
The transition is likely to continue to be bumpy, and if history is any guide, bold predictions either way are very likely to be proven wrong.
About our Guest Author
 |
Allan O’Neil has worked in Australia’s wholesale energy markets since their creation in the mid-1990’s, in trading, risk management, forecasting and analytical roles with major NEM electricity and gas retail and generation companies.
He is now an independent energy markets consultant, working with clients on projects across a spectrum of wholesale, retail, electricity and gas issues. You can view Allan’s LinkedIn profile here. Allan will be sporadically reviewing market events here on WattClarity Allan has also begun providing an on-site educational service covering how spot prices are set in the NEM, and other important aspects of the physical electricity market – further details here. |
Interesting article. In 2019 I mentioned to an energy bigwig that gas was being displaced by wind and solar and he heartily disagreed. The data says otherwise.
In the DDPS section, it should be noted that Origin are also gas developers, so their fuel cost is lower than market. Similarly for Arrow (Braemar 2) and QGC (Condamine).
I think a lot of confusion about the role of gas in the NEM arises from failing to distinguish between sources of energy and dispatchable capacity. The data clearly shows that gas-fired generation’s contribution as a significant energy source has fallen and because of its inherent variable cost disadvantage to renewables and coal, that is not going to change.
The more open question is around the role of gas-fired generation providing (relatively) firm capacity for relatively short periods. In this role only small amounts of energy (as a proportion of total production / consumption) are required so fuel costs are much less important and the economic question turns to which technologies – storage, demand response, gas or even liquid fuelled generation, transmission enhancements etc – provide the best combination of fixed capacity costs, flexibility, and supply duration. My view is that it’s premature to be talking about replacing most of the NEM’s current gas fleet in this role in the near term, but it’s much less clear how much additional gas-fired plant will be economically justifiable.