Yesterday I posted a quick article focused on the price spike in NSW at 12:50 on Tuesday 15th December. In that article, we identified three of the factors that contributed to price volatility on that occasion, being:
Factor #1) A number of coal units still out on ‘catch up’ maintenance squeezed into a compressed outage season due to COVID restrictions earlier in the year;
Factor #2) Trip of Eraring unit 3; and
Factor #3) Constrained down output on the TUMUT3 unit in the NSW region.
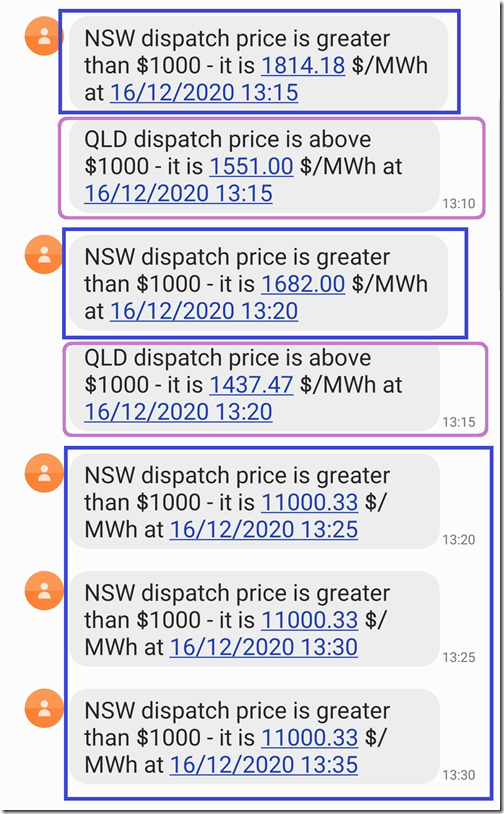
Today, in addition to discrete spikes at 08:10 and 12:25 (both QLD and NSW), there was a run of price spikes in NSW between 13:15 and 13:35 as captured in the following run of SMS alerts triggered by ez2view:
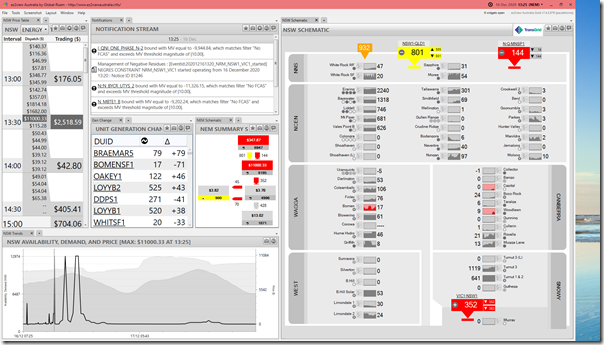
The 13:25 spike was captured in the snapshot taken in NEMwatch v10 (our entry-level dashboard) at the time and tweeted here.
In NSW because of the ongoing 5/30 issue (with us still for 9 more months), these spikes resulted in:
- a trading price of $4,332.76/MWh for the half-hour ending 13:30; and
- a trading price of $1,889.89/MWh for the half-hour ending 14:00
I’m not going to drill in any further on this event, other than to leave the following two artefacts that might help to illustrate that simple explanations might be a little too simplistic to capture all that went on in delivering this price spike:
Artefact #1 = ez2view snapshot of 13:20
This snapshot here of the 13:20 dispatch interval, which was the first interval when QNI bound, voiding the price-balancing effect of QLD exports and enabling the NSW dispatch price to climb to $11,000.33/MWh:
Readers will be able to see the number of wind and solar farms across the NSW region that were performing at low (and in some cases very low) levels of output. Keep in mind that some of these (but not all of them!) are at early stages of commissioning, so are understandably low in output.
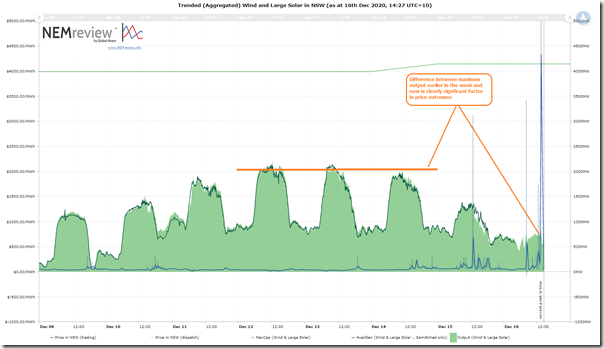
Artefact #2 = trend of output
Using NEMreview v7 (though this is also possible in the ‘Trends Engine’ within ez2view) we are able to create this trend query that presents the same information in a different way:
There’s clearly 1,300MW of supply from Wind and Solar that’s missing in aggregate, when compared to the peak levels seen earlier this week (and we need to keep in mind that the timing of these spikes is the middle of the day – which would ordinarily be peak solar output times).
Looking at this another way, with installed capacity (i.e. MaxCap) of 4,000MW the highest the capacity factor reached (on an instantaneous basis) over the week shown was around 50%, with the capacity factor at the time of the price spikes this afternoon down around 17% … albeit that some of the installed capacity is not really there for the market yet, because it’s still being commissioned (so shows up in AEMO’s MMS ‘early’, by that measure).
Also, at the time of yesterday’s price spike we see a gap open up between ‘Output’ and ‘AvailGen’ for Wind and Solar, which suggests that in aggregate there was a non-trivial amount of volume ‘constrained down’ in addition to what I noted for TUMUT3 yesterday.
Here’s the query for those who are licensed users who want to look themselves.


Be the first to comment on "More price volatility in (QLD and) NSW on Wednesday 16th December 2020"