This is the second of a series of case studies we’ll be preparing looking at instances identified of large values for aggregate Raw Off-Target across all Semi-Scheduled units.
It follows from the table of detailed results posted at the bottom of the article ‘Extrapolating from the trend of ‘Aggregated Raw Off-Target’ results, to yield some clues to what the future might hold … and one challenge for NEM 2.0’, which was posted on Monday 27th July, partly in response to the AER discussion paper relating to Semi-Scheduled units.
——————-
It just so happens that this case study is almost a carbon-copy of the first case study, which looked at a dispatch interval about 40 days earlier than this one.
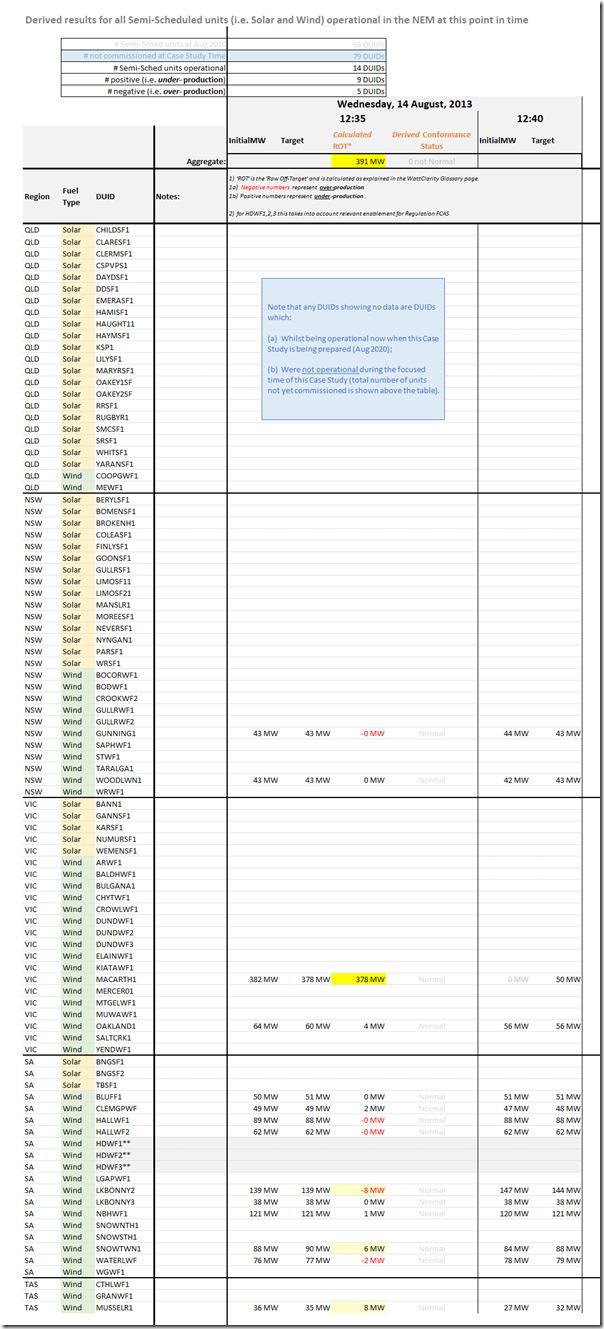
(A) Summary results for Wednesday 14th August 2013 at 12:35
Again, we start with this summary table, highlighting the individual Raw Off-Target performance of all Semi-Scheduled units that were operational at the time:
Again we see that:
1) There were only 14 DUIDs operational at that time.
2) Of these, almost double the number were under-producing (9 DUIDs) than those over-producing (5 DUIDs)
3) There was only a single unit that delivered the large aggregate outcome.
(B) Another unit trip at Macarthur Wind Farm
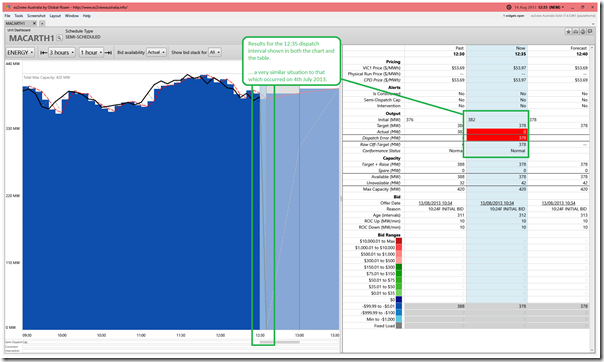
On this occasion, Macarthur had been producing 382MW at the start of the dispatch interval in question, had been given a Target of 378MW – but tripped to 0MW during the dispatch interval. Again we can show this specific dispatch interval clearly with the current ‘Unit Dashboard’ widget in ez2view, wound back 7 years ago through the powerful ‘Time Travel’ functionality:
Nothing more we need to add, in this particular case either…


Leave a comment