It’s Saturday 25th January, which means we’re (notionally speaking) coming to the end of what used to be ‘boring’ bit of summer (with schools closed, people on summer break, and so a sizeable number businesses at reduced load). From next week is ‘normally’ when we would expect stresses to be highest in the supply/demand balance….
However (perhaps) we’ve had another reminder that these simple historical heuristics no longer really apply so well as they used to….
… or perhaps it’s partly also the case that my memory is no longer what (I remember that) it used to be?
(A) Another example of ‘higher risk’
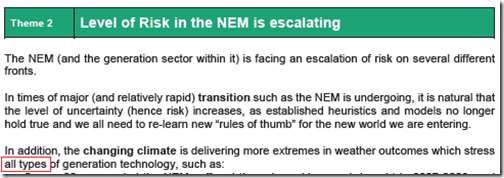
It was exactly a year ago (when extremes in weather stretched the supply/demand balance in Victoria and South Australia) that we were buried in the details of completing our first ever Generator Report Card 2018 – in collaboration with GVSC and the assistance of a significant number of others. Those events, and others that occurred through the period through to release on 31st May 2019, reinforced the need for us to note that the ‘Level of Risk in the NEM is increasing’ in Theme 2 within Part 4 of our 180-page analytical component in the GRC2018:
Rolling the calendar forward 12 months to the current summer 2019-20 and we see that the events of Thursday 23rd January 2020 in the NSW region of the NEM (which did turn out to be tight, just as they looked like they might be earlier in the day) are yet another reminder that we’re dealing with increasing risk in the NEM due to a confluence of different factors.
(B) Scratching that itch…
Now as I have noted before, we’re following on from the GRC2018 with a release of a Generator Statistical Digest 2019 (with the release now only days away). So I know I should be focused this weekend on ‘finishing touches’ to ensure that all those who have pre-ordered (and saved a little at the same time) can access their copies from Tuesday morning.
However that insatiable itch to understand ‘just a little bit more’ about what happened on Thursday got the better of me, so after an unwise number of hours digging (in conjunction with piecing this article together) I thought that I might as well share what I found with readers here. I trust that our GSD2019 subscribers will forgive me for taking this detour!
By the way – do you know of people who can help us to scratch these types of itches (further discussed at the bottom of this article)?
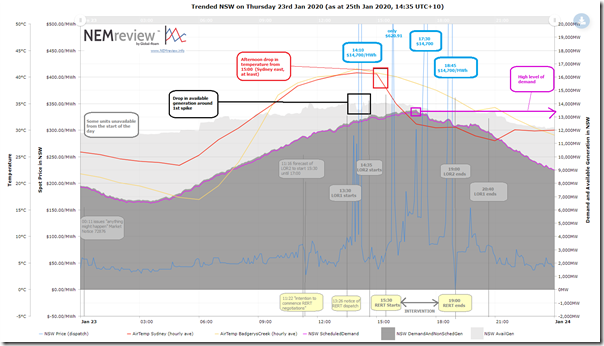
Using this trend in NEMreview v7, I’ve prepared the following broad overview of what happened through the day – in large part to try to get it straight in my own head, though it might be useful to you as well:
As with our other articles, click on the image to open a larger view on a new window.
There are many questions I have about just this single day, but thought I would flag the following key questions that I would like to understand the answers for:
| Question I’d like to understand answers for… | (Some of) why I’d like to know |
| What was the initial state of the region ….? | … leading into the day (particularly with respect to the tight supply/demand balance) |
| What changed (around 11:22) ….? | … leading to AEMO forecasting LOR2 and commencing RERT Negotiations |
| Who did what ….? | … as the afternoon unfolded – particularly with respect to the three major price spikes (at 14:10, 17:30 and 18:45), and actions taken under Reserve Trader |
| What are potential future implications ….? | … for the NEM, as a result of what happened on the day? |
| Another question….? | … or maybe not? |
Hence below we will delve into If I have not done a good enough job of answering these myself below, perhaps more learned readers can help me understand more?
(C) What were the Initial Conditions?
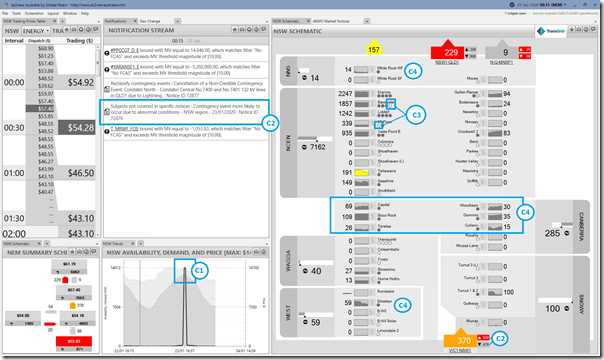
Thankfully, we have access to the ‘Time Travel’ functionality in the installed ez2view software to make it easy to wind a particular window back to some historical point in time. The following snapshot was taken to highlight what the general view of the market was at 00:15 (NEM time) on Thursday morning:
I’ve annotated a few general observations, as follows:
(C1) Tight supply/demand balance forecast
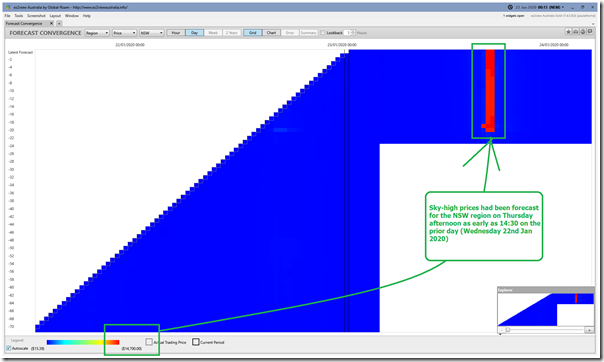
At this point in time, AEMO had forecast that the Scheduled Demand would reach 12,877MW in the trading period ending 16:30. This was less than 1,000MW below the scheduled Available Generation (13,790MW) forecast for the same half-hour, we see that the AEMO was forecasting a price spike to the Market Price Cap of $14,700/MWh for the 16:30 and 17:00.
… so the market had some forewarning of likely tightness of supply/demand later that afternoon. Indeed these prices up near the Market Price Cap had been consistently forecast since 14:30 the prior afternoon (Wednesday), as shown in the ‘Forecast Convergence’ widget within ez2view focused on 00:15 on Thursday morning:
Now, we might quibble to say that the three dispatch intervals where prices actually did spike (14:10, 17:30 and 18:45) were in anything but the 16:30 and 17:00 trading periods – but the broader point is that we were certainly forewarned that something might be happening!
(C2) AEMO issues another ‘anything might happen’ Market Notice
At 00:11 the AEMO had issued Market Notice 72876 noting again the general form of a ‘something bad more likely to happen’ warning to the market:
________________________________________________________________________________________________
Notice ID 72876
Notice Type ID Subjects not covered in specific notices
Notice Type Description MARKET
Issue Date Thursday, 23 January 2020
External Reference Contingency event more likely to occur due to abnormal conditions – NSW region.- 23/01/2020
________________________________________________________________________________________________
AEMO ELECTRICITY MARKET NOTICE.
Refer AEMO Electricity Market Notice No. 72574
AEMO has identified that abnormal conditions exist in the NSW region, namely DAMAGING WINDS and HEAVY RAINFALL in the Snowy Mountains and South West Slopes weather districts which increases the risk of a contingency event occurring.
Given the increased risk, AEMO has applied the following constraint to manage the impact of any such contingency event:
I-VN_0500
I-NV_0500
Further notices will only be published to advise of any additional limitations, or when the abnormal conditions have ceased to impact the likelihood of a contingency event occurring.
Manager NEM Real Time Operations
Hence whilst there was not a specific LOR2 (Low Reserve Condition) forecast published for the afternoon at the time, AEMO was providing the market that the situation might change more rapidly than ‘normal’.
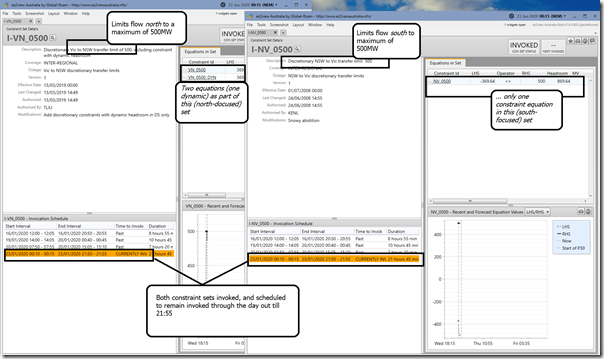
It’s important to perhaps pause on the two constraint equations that the AEMO mentions that they have invoked, as shown in this snapshot:
In summary, AEMO had set a (much narrower than usual) bounds on flow north and south over the interconnector between VIC and NSW to a maximum of 500MW in either direction, in order to ensure that (in ‘non credible contingency’ conditions) they have more ‘gas in the tank’ to enable to use the interconnector to ‘floor it’ and speed the NEM away from of trouble. There is a cost to doing this, however, in that:
(a) In every dispatch interval its in place, it may be that the ‘lowest cost’ dispatch approach cannot be used – resulting in a ‘next best’ dispatch outcome.
(b) Particularly when supply and demand locally is tight, it might mean the price escalates quite quickly up the steep end of the supply curve. Generators know that these sorts of constraints limit out-of-region competition, so might be tempted to take advantage of this in how they bid.
The decision was made to use this trade-off more frequently following the various reviews of the SA System Black, which concluded that the System Black might have been avoided had a similar approach been used on the Heywood link in advance of those wild storms.
(C3) Two coal units offline (and presumably unavailable)
We see early that morning that there were two coal units offline – and (by virtue of their ‘base load’ mode of operation) we could presume were unavailable for the day (noting that availability data is not available in real time, as it is confidential):
(C3a) Bayswater Unit 4 offline
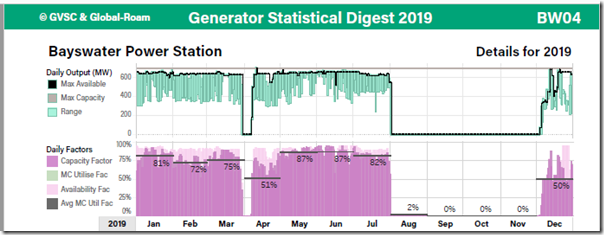
Bayswater Unit 4 did not have a great year in calendar 2019. The following image has been lifted from the ‘B’ Page of our Generator Statistical Digest 2019 and shows clearly the four month outage experienced in the latter half of the year, with the unit only back online in December (and then only averaging a 50% capacity factor since that time):
Hence some continued operational problems in January 2020 won’t be making AGL Energy very happy.
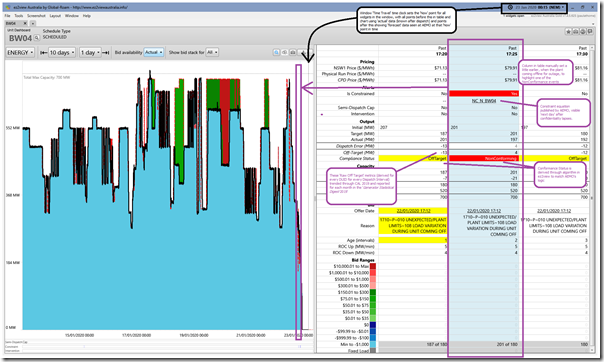
in this snapshot from ez2view ‘Unit Dashboard’ looking back 10 days from Thursday morning, we see that the plant had been cycling significantly through the period and bidding much of its volume down at –$1,000/MWh. We also see (in and around the 17:25 dispatch interval on Wednesday 22nd January) that the plant had experienced some Non-Conformance notices (with logic coded into ez2view matching with the Non-Conformance constraint issued by AEMO, and publicly visible the following day)
From this image (as per annotation) we see a few things:
1) The plant can be seen to be cycling considerably through the period shown since 13th January. The specific reasons for this cycling has not been explored in detail (lots of ‘testing’ and some ‘failure’ mentioned in various rebids) – but a broader observation would be that this type of cycling would generally be avoided if possible, because it adds to fatigue damage in some high-cost components.
2) In the process of coming offline on the prior afternoon (Wednesday 22nd January) we have highlighted one of the instances of Non-Conformance flagged in the display (the 17:25 dispatch interval) where our automated logic in ez2view has been confirmed with the later visibility of the Non-Conformance Constraint.
3) On the way to these Non-Conformance instances, there were a number of occasions where BW04 saw significant excursions in ‘Raw Off-Target’
4) Both Conformance Status and Raw Off-Target are calculated through 2019 for every DUID across every dispatch interval, and then aggregated by month in the Generator Statistical Digest 2019. Out of curiosity I have lifted out what’s in the GSD2019 for BW04 and included it here:
Altogether, BW04 would not be recipient of the ‘favourite unit’ award at AGL Energy anytime soon, one supposes.
(C3b) Mt Piper Unit 1 offline
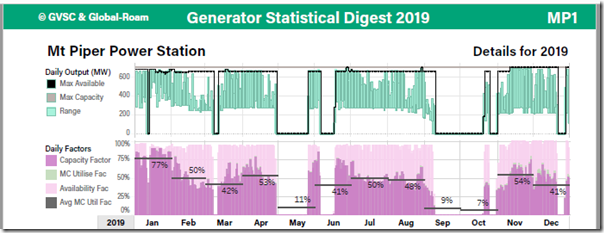
Now, Mt Piper Unit 1 also had a calendar 2019 year that was not its best performance, as seen in a similar trend of headline output results from the Generator Statistical Digest 2019:
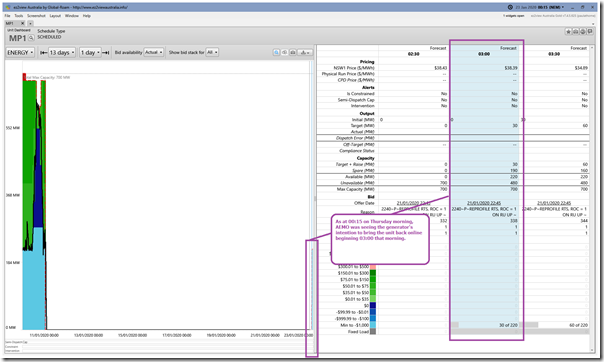
That’s 7 discrete outages clearly discernable in the trends (actually 10 starts through CAL 2019 in total, as recorded in the ‘A’ Page for the unit in the GSD2019). So it was with some trepidation that I flipped the ‘Unit Dashboard’ widget within ez2view from BW04 to MP1 to understand what the current status of the unit was leading into Thursday 23rd January:
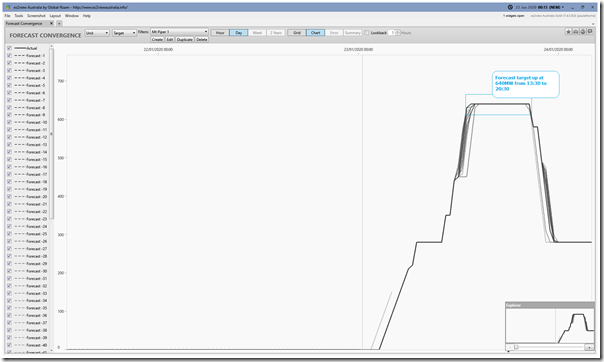
We have to go back to the morning of Saturday 11th January to see when MP1 came offline – but perhaps more important is the observation that (as at 00:15 that morning) the unit was signalling that it was going to start coming back online from the 03:00 trading period. This can be seen in the ‘Forecast Convergence’ widget within ez2view focused on Predispatch (Trading) Targets for MP1 through the day, showing output expected to be peaking at 640MW during the tightest period of the supply/demand balance:
That would have been some good news, in terms of the supply-demand balance!
(C4) Wind output elevated
It’s at 00:15, so obviously too early for any injections from solar – but we do notice that the wind farms across the region are contributing well.
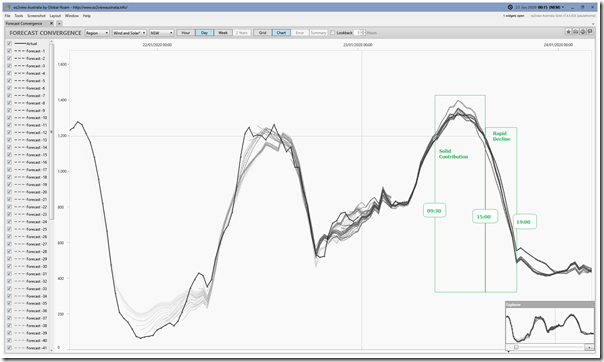
At this point, the forecast contribution across the Wind and Solar fleet in NSW was that it would provide a decent contribution through the midday period (above 1,200MW from 09:30 to 15:00) but would rapidly decline after that – down to 555MW at 19:00. Hence a rapid decline in supply from wind and solar through the period where supply/demand is forecast to be tightest, and the price spike occurring (so of the same order of magnitude reduction as what Mt Piper 1 was expected to be adding in).
This can be seen in the ‘Forecast Convergence’ widget within ez2view focused on ‘Wind and Solar’ (i.e. UIGF and Intermittent Generation) through the day:
(C5) Transmission still offline
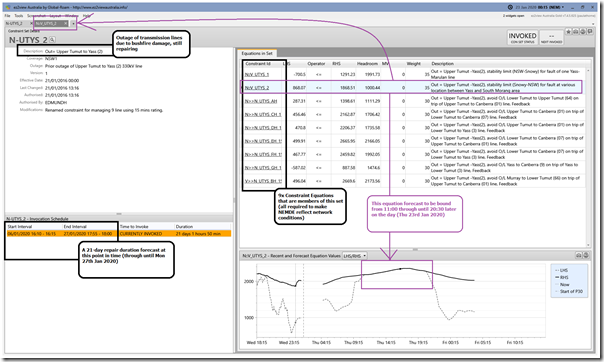
Not noted in the overview snapshot from ez2view above was the fact that the constraint set “N-UTYS_2” was scheduled to remain invoked out till 18:00 on Monday 27th January (i.e. just before we release the GSD2019!) This was one of the constraint sets invoked as a result of bushfire damage to transmission network in the Snowy Mountains area, and had been in place since 6th January 2020. Here’s the view of the constraint set at the time within ez2view:
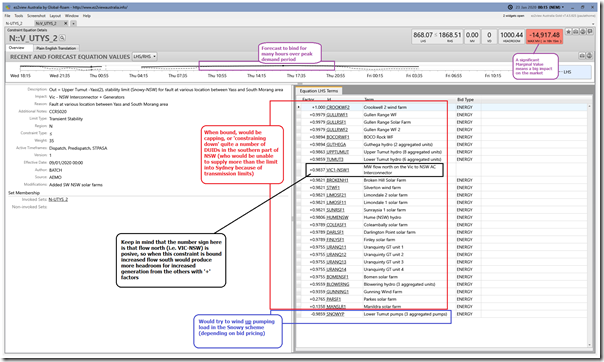
In particular, I have highlighted the constraint equation “N::V_UTYS_2” (one of 9 in the set) which is forecast to bind through the afternoon. We take a closer look at that Constraint Equation:
Because it’s of the form LHS <= RHS, we know that (when it’s bound) the constraint equation would be trying to cap, or ‘constrain down’ anything with a positive factor (that’s quite a few units in southern NSW in this instance!) – and also ‘constrain up’ anything with a negative factor (everything subject to how the DUIDs bid, of course).
(D) What changed, to lead to AEMO’s decision on LOR2 and RERT?
At the beginning of the day, the AEMO had not forecast an LOR2 condition would exist (and they certainly had not flagged triggering the RERT). But we know that this all changed at 11:16 (LOR2) and 11:22 (RERT negotiations). So I am very interested to understand what changed, in terms of the AEMO’s expectations for the afternoon!
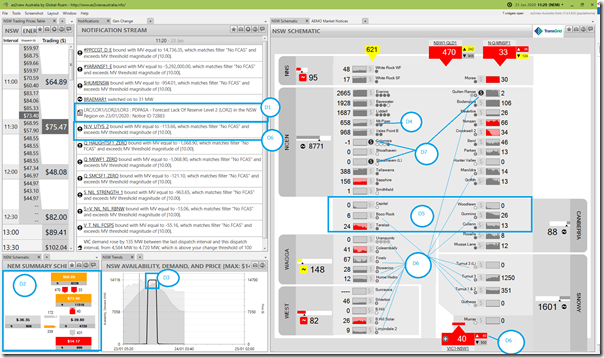
If we ‘Time Travel’ ez2view forward to 11:20 (i.e. data published at 11:16 to best match the timing of the two Market Notices and have a look for some differences (for those not used to ez2view, note the different title bar colour to denote a different time from the 00:15 interval above):
I’ve annotated 7 different points highlighted on the image, discussed below:
(D1) AEMO issues Market Notice about Forecast LOR2
At 11:16 the AEMO issued Market Notice 72883 highlighting the forecast LOR2 (Low Reserve Condition) to begin at 15:30 that afternoon through until 17:00:
________________________________________________________________________________________________
Notice ID 72883
Notice Type ID LRC/LOR1/LOR2/LOR3
Notice Type Description MARKET
Issue Date Thursday, 23 January 2020
External Reference PDPASA – Forecast Lack Of Reserve Level 2 (LOR2) in the NSW Region on 23/01/2020
________________________________________________________________________________________________
AEMO ELECTRICITY MARKET NOTICE
AEMO declares a Forecast LOR2 condition under clause 4.8.4(b) of the National Electricity Rules for the NSW region for the following period:
From 1530 hrs 23/01/2020 to 1700 hrs 23/01/2020.
The forecast capacity reserve requirement is 721 MW.
The minimum capacity reserve available is 463 MW.
AEMO is seeking a market response.
AEMO estimates the latest time at which it would need to intervene through an AEMO intervention event is 1330 hrs on 23/01/2020
Manager NEM Real Time Operations
(D2) Prices still subdued at 11:20
Worth noting here that the the prices across all regions were subdued at this point in time (only $73.40/MWh in NSW for that dispatch interval).
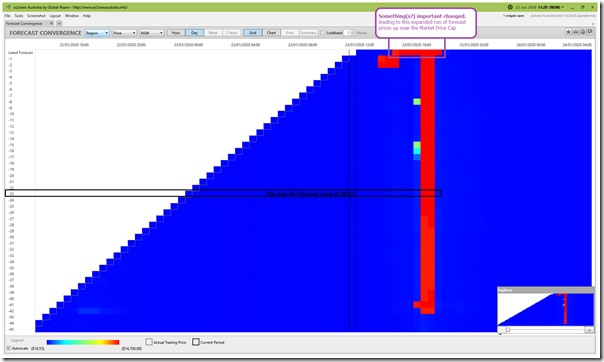
(D3) Forecast period of tight supply/demand balance has expanded
From a forward-looking perspective, we see that AEMO is now forecasting prices to be up near the Market Price Cap from 14:30 out till 17:30 (i.e. 7 Trading Periods, as opposed to two Trading Periods in most prior forecast runs) – as shown in the updated ‘Forecast Convergence’ widget here:
We can see a clear difference here (hence understand why AEMO has heightened concern) – but it does beg the question about ‘what changed?’ between the prior run and this run!
Reason 1 = Demand tracking above Target
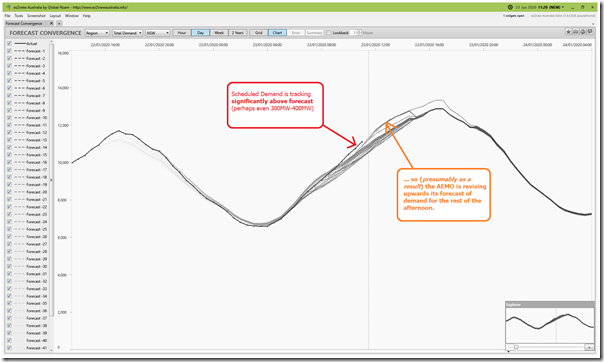
One of the reasons becomes apparent if we flip ‘Forecast Convergence’ to look at Scheduled Demand (i.e. TOTALDEMAND) in the NSW region:
We see that the Scheduled Demand is tracking ahead of the AEMO’s forecasts (perhaps by as much as 300MW-400MW) – which might happen for a number of reasons:
Possible factor 1 = temperature-induced demand patterns might be stronger than previously forecasts (no time to check this)
Possible factor 2 = it might be that generation yield ‘behind the meter’ (largely rooftop PV) is disappointing with respect to prior forecasts (no time to check this)
Presumably as a result, we see that the AEMO are revising upwards their demand forecast for the rest of the day…
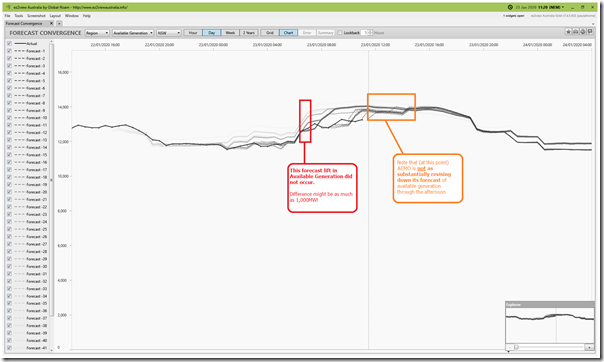
Reason 2 = Available Generation tracking below Target
Flipping ‘Forecast Convergence’ to look at Available Generation in the NSW Region, we see that (for reasons that need to be unpicked) the Available Generation capacity (aggregated across Scheduled and Semi-Scheduled plant in the NSW region) is tracking considerably below prior forecasts:
So we see that, through the morning, the aggregate available generation capacity from around 07:00 to 11:00 (the time of this forecast run) was tracking as much as 1,000MW below forecasts. That’s a significant difference that should be unpicked!
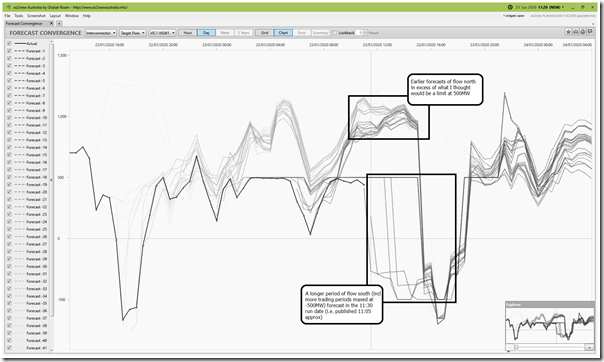
Reason 3 = Forecast flips for NSW to be exporting to VIC
Flipping ‘Forecast Convergence’ to look at Target flow on the VIC-to-NSW interconnector, and remembering that positive flows are northwards flows, we see two main things:
We see that:
1) A number of the prior forecasts (last one being 07:30 forecast run) would be that VIC to NSW flows would be well in excess of 500MW northwards. Why these flows would have been possible given the earlier 00:15 invocation of the “I-VN_0500” constraint set is something I don’t have time to explore, but which puzzles me!
2) In the most recent forecast runs we’ve seen NEMDE’s forecasts that the optimal dispatch would see NSW exporting into VIC through more periods during the afternoon:
(a) Most prior runs were for flow south to be maxing out at 500MW for 16:30 and 17:00 trading periods; but
(b) Now we see maxed out exports from NSW being from 15:30 to 17:30 on top of a broader period of negative flow. Presumably this is a result of the dynamics of the “N::V_UTYS_2” constraint equation (and specific participant bids), but I don’t have time to dig right now.
(D4) Some successes with the coal units
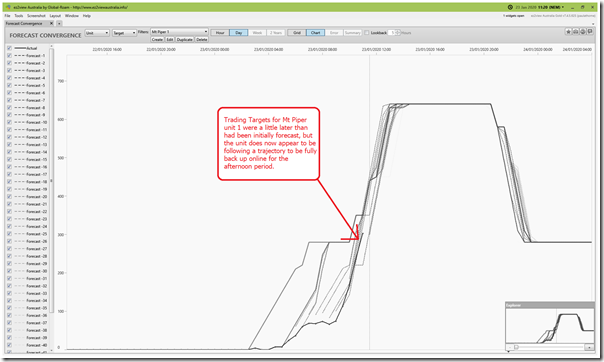
In the schematic above, we see that Mt Piper unit 1 is successfully back online, which is a portion of good news.
D4a) Mt Piper unit 1
Here’s the Trading Target for MP1 in the ‘Forecast Convergence’ widget:
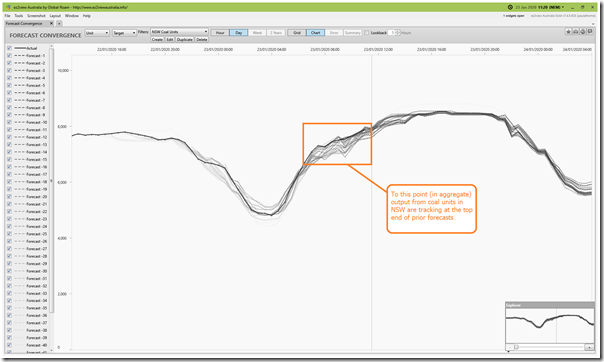
D4a) All operating coal units in NSW
Expanding the scope of the filter to look at Trading Targets for all the coal-fired units in NSW, we see that the coal units are (as a whole) tracking something like 300MW above many of the prior targets:
Hence (at this point and on this occasion), apart from the outage of the troublesome BW04 unit, we see the coal units doing their job. That’s good news!
(D5) Production at Wind and Solar
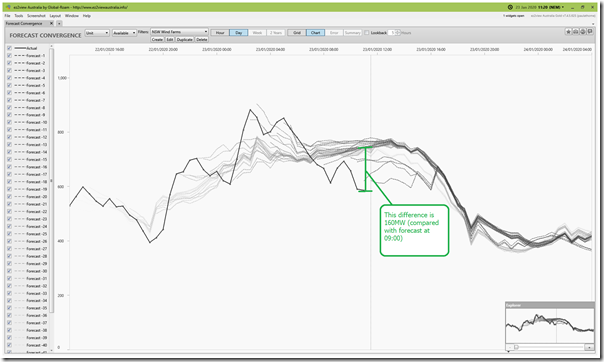
Unfortunately, we see an earlier-than-initially-forecast collapse in the AWEFS-determined aggregate capability (i.e. Available Generation) of the wind farms across the NSW Region:
At the 11:00 trading period, this deficit was as much as 160MW compared with the forecasts at 09:00. So it seems we know whose slack the coal units are taking up.
D5a) Silverton Wind Farm
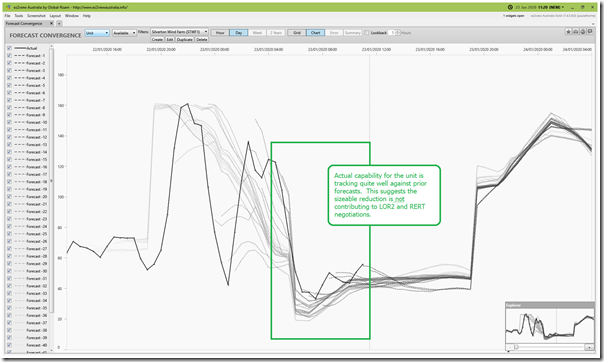
To try to unpick this a little further, I’ve picked to look specifically at the Silverton Wind Farm (which seems the largest wind farm in the region on a quick scan). But this unit shows to be tracking quite well against its prior available generation forecasts:
So that’s a partial win, I guess, in that:
1) The sharp reduction in capability seen between 05:00 and 06:30 was well forecast in advance (glass half-full); but
2) It is a reduction in capability in any case on a day when the supply/demand balance was tight (glass half-empty).
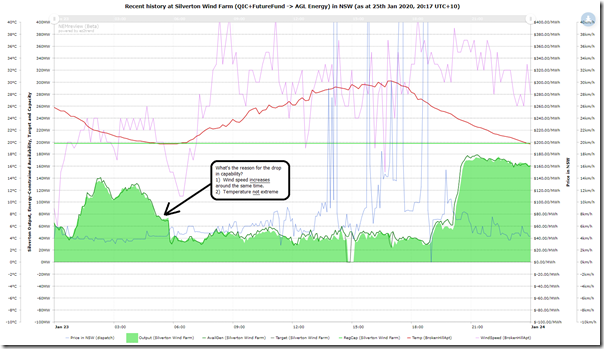
I do wonder what the reason was for the sharp drop in capability was over that period – was it just related to wind capability or was it due to some other factor (perhaps temperature). This trend of data from NEMreview v7 specific to Silverton Wind Farm shows the following:
I am puzzled by this:
1) Low wind speed was the NOT factor (the nearby Broken Hill Airport shows an increase at the same time);
2) Perhaps high wind speed cut-out was a factor (but this also seems unlikely, as output ramped up later that night when wind speed was high);
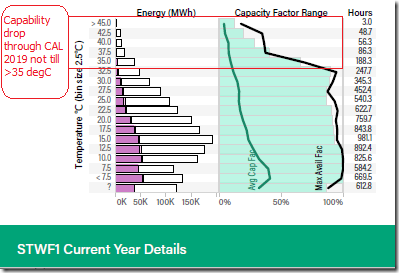
3) Neither does it seem that high temperature cut-out was a reason. Because I had it open, I flipped the GSD2019 to view the ‘B’ Page for Silverton Wind Farm to see that it does display a pronounced loss in capability at high temperature – but (based on assessment through the whole of CAL 2019) this does not really start to occur until temperature exceeds 35 degrees C (and this was certainly not the case in the morning)
4) Which leads me to wonder if it was some plant-related reason? If this was the case, it would reinforce the reason why we recommended (in Theme 4 of Part 2 of the 180-page analytical component within the GRC2018) that the AEMO publish two separate data fields for Semi-Scheduled plant:
(a) Energy-Constrained Availability (which is what we currently have); and
(b) Technical Plant Availability (which might help me answer this question)
Can any reader help me understand please?
D5a) Boco Rock Wind Farm
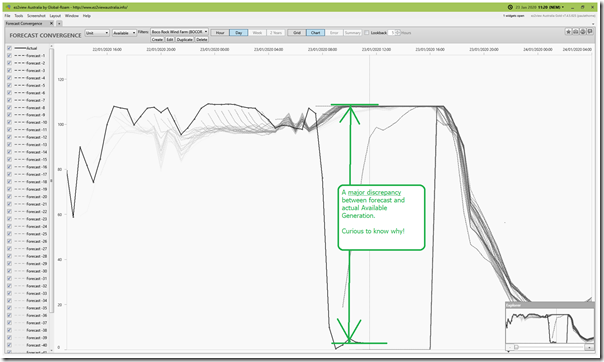
There are a number of other wind farms in the NSW region, but we quickly flip the filter to Boco Rock Wind Farm and find one of the main culprits for the major discrepancy noted above:
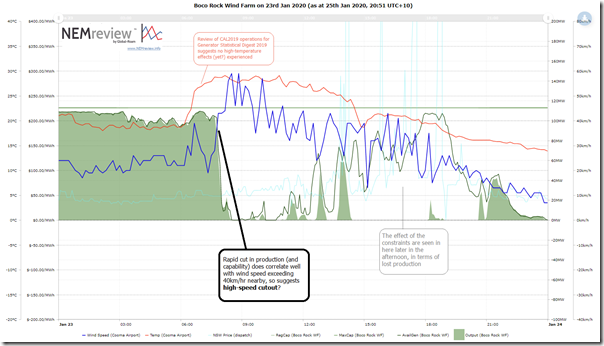
We see the available generation capacity drop to almost 0MW from 07:30 that morning, way out of line with what AWEFS was saying in terms of Available Generation capacity. Now the equivalent ‘B’ Page in the GSD2019 to view the ‘B’ Page shows that Boco Rock WF did not display high temperature limitation through CAL 2019, so I wonder if it is something else. Here’s a quick chart (using this query) of its output in NEMreview v7:
As noted on the chart, there is a high correlation between a sharp jump in wind speed (at ‘nearest BOM measurement point’ used in the GSD2019 – being Cooma airport) and the output and capability at Boco Rock Wind Farm. Hence this does suggest both:
Factor 1) automated cut-out at high wind speeds; and that
Factor 2) for whatever reason it appears that AEMO did not have this limitation catered for in its AWEFS model (hence it was not forecast in P30 Available Generation). We might speculate that this information was not provided during the GPS or commissioning process (but it would just be speculation).
Can any reader help me understand please?
(D6) Constraint bound, limiting supply from many plant
As expected, the constraint equation “N::V_UTYS_2” is bound, which (as illustrated in the snapshot above from 00:15) would be capping, or ‘constraining down’ the output of quite a number of units in southern NSW. All of these are highlighted by the ‘+’ icons where the unit dots are located on the schematic (i.e. ‘+’ for ‘positive factor’).
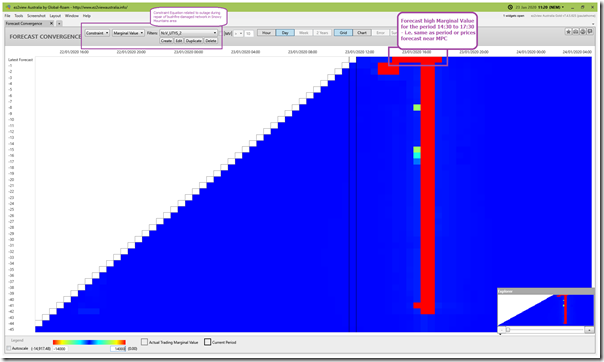
What I am particularly interested in, however, is what’s changed in terms of how the constraint is forecast to bite for the rest of the afternoon. Remembering that the Marginal Value reflects (in layperson’s terms) the ‘cost of the constraint to the market’ we see that the period where it is forecast to be high has similarly extended to be the same period of time covering the (now extended) price spike – i.e. 14:30 to 17:30 – in this filtered view of constraint Marginal Value in ‘Forecast Convergence’:
(D7) Rebidding behaviour
Also flagged are rebids across three stations (Shoalhaven Pumping, Colongra Peaker, and Gullen Range Solar & Wind). But I have run out of time to look further at this today….
(E) Who did what, as the afternoon unfolded?
As noted in the table above, I’d love to have time to investigate both:
(E1) what happened in relation to the price spikes above (both before – causing them, and afterward – in response to them) – and also
(E2) to look in detail at the operation of the RERT
Perhaps I will have time to investigate further in another article, and link back in here later…
(F) What are future implications of these events?
I also wonder what the future implications are of events like what happened on Thursday 23rd January 2020 – but have run out of time to give that some thought today…
(G) Do you know of someone who can help us?
Finally, if you know of people who can help us ‘scratch these itches’ in terms of either:
(G1) analysing the market (and hopefully doing a better job than me) and/or
(G2) adding to our software engineering team so we can more quickly continue the process of enhancing ez2view and our other software,
We have a new Software Engineer and Analyst starting in about 2 months and are really looking forward to having her start with us…



The abrupt shutting down of Wattle Point wind farm in SA I noticed on Dec 30th travelling to Troubridge Point was clearly a congruence of the high temperature (41-43degC on my car external temp gauge) and an obvious large dust storm that suddenly blew up above and beyond steady wind already turning the turbines. That seems to suggest that it’s not just temperature that automatically constrains these turbines but a range combination of wind speed and temperature which would vary with turbine type. That information for each wind farm should be available to the AEMO for forecasting purposes.
Operational AEMO staff called RERT providers on Wednesday afternoon, anticipating the possibility of breaching the LOR2 threshold.
On Wednesday the PASA LOR forecasting was playing up – putting the LOR2 trigger in the 1100 MW range (due to issues accurately forecasting intermittent generation in the PASA process), however operational staff anticipated that the actual LOR2 trigger was 750MW (an Eraring unit) and that supply/demand balance would be heading into this region.