It was September 2014 that AGL Energy acquired Macquarie Generation (comprising Bayswater and Liddell power stations in the Hunter Valley as operational assets) in a process approved in the Australian Competition Tribunal, but which was not popular at the ACCC.
However AGL’s association with the stations extends back further – with the “gentrader” rights having been secured sometime in 2011 (will link if I can find reference).
(A) Never out of the news?
It seems that the portfolio (and particularly the Liddell station) has almost never been out of the news since that time. Especially after the closure of the Hazelwood Power Station, an increased focus has turned to the Liddell power station, being a lightning rod for the large numbers of people seeking a quicker energy transition.
(A1) Closure plans
Who can forget the ‘shirt fronting’ that happened between former CEO, Andy Vesey, and the Federal Government in Canberra that rolled on for months after AGL Energy announced plans to retire.
Can’t recall specifically when the closure announcement was first made, but did find this AGL Media Release on 9th December 2017 speaking about options for replacing the required capacity. Despite the ongoing pressure placed on AGL (lasting several PMs and two CEOs) the decision to close has not changed – though there was a bit of a concession with respect to slightly delaying the closure (discussed on WattClarity on 7th August 2019).
(A2) Latest announcements
Hence it was not really a surprise to hear about Liddell in the news also this week, on the back of comments from the current CEO (Brett Redman) about ongoing operational difficulties at the plant.
These comments were reported here on RenewEconomy as “AGL says it’s getting harder to keep Liddell coal plant online” , and mentioned in passing (with respect to the brighter news story of the AGL-Vena tie-up over the Wandoan BESS here in the Australian, and in longer coverage here in the AFR).
(B) The year that was in 2019
Coincidentally, just having released our Generator Statistical Digest 2019 only two days ago, I was curious to open it up and have a look at what was shown of the operations of the plant through calendar 2019 on the relevant ‘B’ pages (remembering that there is also a 10-year history included using different stats on the ‘A’ pages).
(B1) Snippets for each unit from the GSD2019
In developing the GSD2019 we chose to show results on a unit-by-unit basis (which explains why the document amounts to 660 pages after covering 304 units across the NEM, and the addition of a detailed glossary). Hence here are some snippets from the top of the relevant ‘B’ Page for each unit:
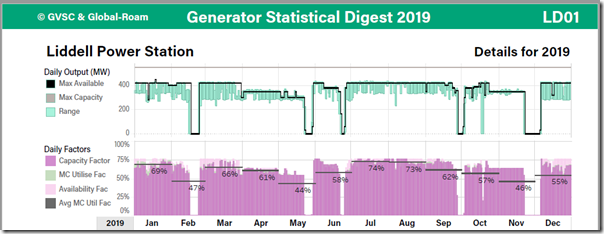
Liddell unit 1
At the top of the ‘B’ page for each unit are two charts that sum up the outcomes through the most recent year for each unit – showing daily range of operation (min to max) and also the daily capacity factor (months shown in text).
For unit 1 we can quickly observe a number of different findings:
Observation #1 = during CAL2019 we can clearly see the plant offline on 6 different occasions through the year, which (noting that it’s possible the unit could have been offline on multiple occasions through a given day, if it tripped in trying to come back online) is not great performance
Observation #2 = perhaps more importantly, we can also see that the volume of capacity offered to the market through the year did not rise above 75% of its Maximum Capacity (as stored by AEMO) through the year:
2a) It’s my understanding that this restriction has been in place for a number of years and is a result of limiting boiler pressure, and hence reduce risk of tube leaks in the boiler.
2b) Also worth noting that it’s operational decisions like this that are part of the reason why the 12-month trailing aggregate partial unavailability has been trending upwards for at least 10 years, as outlined here in June 2019 following from the detailed exploration in the Generator Report Card 2018 .
2c) However lest readers misinterpret these results, our work (also here in June 2019) in the GRC2018 showed that there was NOT a consistently increasing trend in full unavailability across the 48 coal units across the same period.
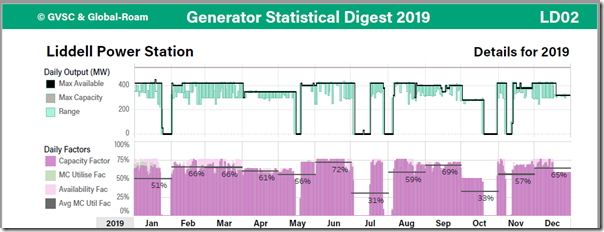
Liddell unit 2
Here’s the same view for unit 2:
Again, we can see a pretty poor performance through the year – with 6 discrete periods of outage over several days each.
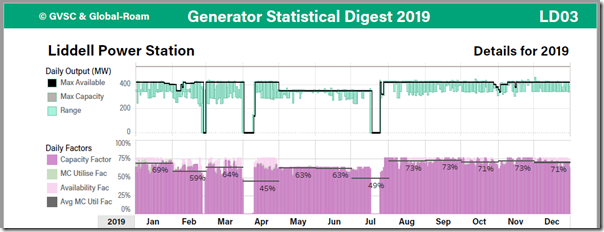
(B1) Liddell unit 3
The picture for unit 3 shows that this unit had a better year than the other 3 units…
… though still not a great year given the lower maximum capacity available.
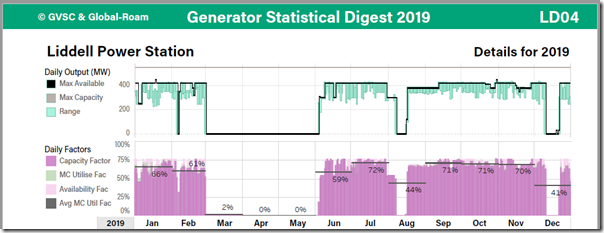
(B1) Liddell unit 4
Finally, with unit 4, we see that the performance stats are dominated by that 3-month outage through March, April, May 2019:
In addition to that, we see three other discrete periods where the plant was offline.
(B2) What does ambient temperature have to do with coal failure?
In recent times we’ve witnessed that the rise in temperatures that comes in every summer comes in parallel with rising temperature of rhetoric from those propagating a broader #coalfail meme. To those who’ve been treating all that’s been said under that meme as fact, then the question above might seem superfluous.
However in reality the question is a good one that needs a factual answer.
(B2a) We’ve seen no evidence above that ambient temperature is a significant factor in full unavailability!
I’d challenge objective readers to review the trends for each unit and ask their own questions about the seemingly ubiquitous (but nevertheless also erroneous*) claims that “coal fails in the heat”. To me it seems that we might as well make a claim that “coal fails when water is wet” as it would be just as true – but nowhere near as misleading* as the “fails in the heat” meme is trending to become.
* I fully admit that there might be something I have missed in the evidence of output performance of coal units like these – or in my underlying technical understanding of the mechanical processes in the fuel combustion and steam cycle that come together to make these technologies work to produce power.
* However even after extensive investigation through the GRC2018 (and now the GSD2019) we have not found any evidence.
* Hence, if there are people who’d like to help me understand the factual basis behind how they assert that “coal fails in the heat”, I would be all ears (and happy to share with readers on WattClarity later, as well).
In the GRC2018 we wrote about how the “transitional challenges require greatly enhanced analytical capability” (as Theme 14 within Part 2 of the 180-page analytical component):
Misleading statements linking coal failures to high ambient temperatures seem just one example where we all need to lift our game.
(B2b) Source of the misunderstanding?
Finally, worth noting two factors that could be combining to lead to this misunderstanding (which, unfortunately, certain parties seem to have latched onto and propagated for their own purposes).
Source #1) A general confusion between Probability and Consequence
I’ve written about this before, and hopefully don’t need to reiterate.
Source #2) Confusion between high-temperature limitations on output and plant tripping
I can understand that, to those who don’t have a technical understanding of the combustion-steam cycle, it’s easy to misconstrue a limitation on efficiency at high temperatures with plant tripping (and/or higher forced outage rate) at high temperatures.
For one there is a link, for the other, there is not.
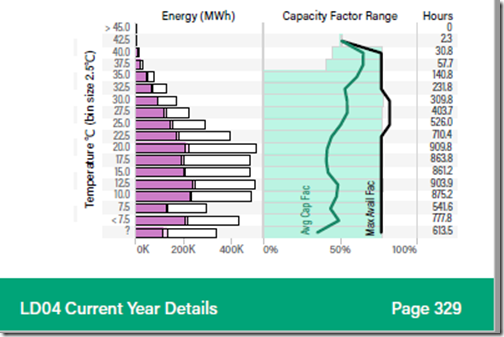
Thankfully in the GSD2019 we also include (for every unit) some stats in a ‘Temperature Energy Harvest’ illustration that show the effect of any high-temperature limitation on the output capability of the plant. Here’s the view for Liddell unit 4, which shows the most significant impact:
As can be seen, the maximum availability of the plant was considerably lower where local temperature was above 42.5 degC (which occurred for 2.3 hours during calendar 2019). However the expected effect across a broader temperature range is masked by the fact that the available capacity bid into the market at the plant was never more than 400MW as shown in the first set of charts above.
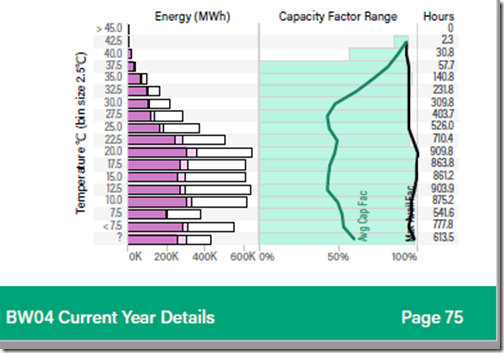
Across the road at Bayswater unit 4, we see the analogous illustration for Bayswater unit 4 (it’s less pronounced on the other 3 units):
Given the plant is water-cooled, it is not a surprise to see a gradual (and slight) decline in cooling efficiency, and hence maximum capability, at higher ambient temperatures.
——————————————-
High ambient temperatures affect the majority of generators covered in the GSD2019 in different ways. We’ll look forward to delivering your copy so you can see the details …



Ambient temperature has zero effect on a boiler or a steam turbine. Heat exchangers in auxiliary services such as lube oil coolers and the condenser hotwell is where the effects of high ambient temperature come in.
High oil temps can trip a unit quickly, especially if a cooling fan fails, but gradual temperature increase can usually be halted by reducing load.
Gradually losing vacuum in the condenser is easily managed by reducing load.
(B2A) WE’VE SEEN NO EVIDENCE ABOVE THAT AMBIENT TEMPERATURE IS A SIGNIFICANT FACTOR IN FULL UNAVAILABILITY!
I was once an Operator at Vales Point Power Station
There are two things which can limit the load on the Generator
1 Outlet temperature of the cooling water from the condenser and
2 The back pressure in the condenser.
The cooling water outlet temperature on the condenser is limited to about 37 degree C. I retired nine years ago and that is what is in my memory. There is a lower outlet temperature (about 35 degrees C) which was the normal limit. If the grid was in danger ie…load was not matching demand then permission from a higher authority was required to raise the limit (37 degrees C) and I do not think that authority was from an executive of the Power Station. This is to reduce any damage which may occur of any marine life within the water source.
The cooling water outlet temperature of the condenser was directly proportional with load and the cooling water’s inlet temperature at the condenser’s inlet. During continuous high daily temperatures (as in summer) the source of the cooling water entering the condenser increases and as a consequence, the cooling water outlet temperature will also rise.
To maintain the condenser’s cooling water outlet temperature within limits will require the load on the Generator to be reduced. So, the volume of the steam entering the condenser, lowers the heat energy contained in the steam, matching the capacity of the cooling water. Energy in equals energy out.
If, as at Liddell, the water source is confined to a fixed source, then that source will increase in temperature as the cooling water is recycled around the condenser, also, as during the previous drought, over time that water source will diminish as a result evaporation. Another problem, the condenser tubes must remain highly conductive to allow the heat to be transferred from the steam/condensate to the cooling water.
At Vales Point the cooling water is drawn from Lake Macquarie. I always suspected a current was developed, in a stream, so that a proportion of the water flowing into condenser’s inlet had a component of water from its outlet.
Another suspicion I had we were drawing cooling water from Earing Power Station’s cooling water outlet. Eraring Power Station is located on the western side of Lake Macquarie, relative speaking, not too far north from Vales Point.
THE BACK PRESSURE IN THE CONDENSER
The most desirable back pressure in the condenser is 5kPa absolute (on the steam side) at all loads. As the load increases so the back pressure will also increase. The back pressure is maintained by the cooling water passing through the condenser. When the cooling water temperature is comprised and is unable to maintain the back pressure within the limits, then back pressure will increase as the load increases. There is a limit on the backpressure (which I cannot remember but I am pretty sure it is not higher than 10kPa absolute). When the back pressure reaches 15kPA, both the Boiler and the Turbine will trip and the Generator will come off the grid. The 10 and 15kPA pressures are estimates of what I remember those pressures to be.
This back pressure must be maintained to ensure the steam leaving the last blades of the LP Cylinder is in a superheated condition. At low loads, the vacuum in in the condenser reaches up way back into the LP Cylinder and as the load on the Turbine increases, the pressure in the LP Cylinder also increases. If the steam leaving the LP Cylinder has no superheat then the water partials in the steam will damage the blades in LP Cylinder (which are spinning at 3,000 rpm) that are exposed to the partials.
Now, as the cooling water entering the Condenser’s inlet becomes warmer, the capacity of the cooling water to maintain back pressure within a satisfactory limit becomes more difficult. When the back pressure is exceeding these limits then the load on the Generator must be reduced to ensure reliability (some load or none).
A factor in the transfer of heat of the steam/condensate in the condenser to the water cooling the steam is relative of the condenser’s cooling tubes through which the cooling water flows. If the tubes become dirty the efficiency is lower.
At Liddell, this cooling water is sourced from a relatively isolated lake and the cooling of their condensers rotates around the different parts of this lake and doesn’t have the benefit of a free flowing river or the high and low tides of a lake with a connection to the ocean. When considering the server drought in the recent past, these two conditions could have contributed a rise in the lake’s water temperature. Because Liddell Power Station does not seem to reach 400MWs implies to me there is a problem with their condensers
(This is my opinion) At Vales Point the cooling water rotates in a stream from the outlet side to the inlet with some dilution of cooler water in the lake depending whether the tide is flowing in or out also Eraring Power Station is on the western side of Lake Macquarie, not too far north of Vales Point. I always thought we were pulling water in from Earing Power Station’s outlet and this increased difficulties in the summer months for Vales Point.
SOMETHING ELSE
With renewable energy creeping into service and consuming energy demand, the coal fired Power Stations must be satisfied with what is left over. As this renewable energy takes more and more of the share this continues to reduce the Power Stations’ share. During summer months, the days being longer and the renewables performing better will leave less capacity needed to be made up.
Boilers, at coal fired Power Stations, have a low load limit. This is to ensure the safety of the fire in the Boiler.
At Vales Point this was once 300MWs with three mills in service with their feeder running not less than 50%. It was later reduced to 250MWs Oil torches where placed into service and the load reduced from 300MWs to 250MWs and when the fire in the Boiler was considered safe the oil torches were removed from service. This has since been lowered to 200MWs indicating the space load share was becoming difficult.
Because of this low load limit and the share over time diminishing there will come a point when a Unit from a Power Station will need to be removed from service. If it is Liddell Power Station, then 400MWs will be removed from the grid. If it is from another Power Station, it will be at least 660MWs. This can be serious because if this Unit “which has been mothballed or it is too inefficient or is too old” is required for service, it can take two to three days to synchronise and close on to the grid.
(Another opinion) In earlier years of commissioning Power Stations the Operators were sourced from steam ships. These Marine Engineers developed a lot of experience operating steam engines and the older “gingerbeers” passed their knowledge to the newer and younger recruits. All these Marine Engineers had a Marine Engineering certificate (part A and/or Part B). These certificates taught on the properties of steam which is very helpful when considering the condenser and other parts of the Unit to analyse what is going on. There are now no steam ships and no Technical Colleges courses supplying that help. Most of the Operators are now Electricians.
I hope this is helpful.