Very early Monday morning 1st May there was some strange volatility discussed very briefly in this first article.
As noted there, this case seems to be a bit more complicated than the (more ‘plain vanilla’) case of volatility later that morning in South Australia.
1) So in this article, and possibly others to follow, we’ll make an attempt to drill in further
2) Particularly in this article please note the CAVEAT = MISTAKES MAY BE PRESENT, done in a rush and without considering all aspects.
In that first article we identified that the ‘N>>NIL_33_34’ Constraint Equation seemed to be playing a material role in what went on during that period of morning volatility. In this article we’ll focus exclusively on that constraint equation, but readers should note that (as we have noted before) ‘the NEM is a complex place’ and it’s likely that there were other factors at play as well.
(A) Walking through a few dispatch intervals on Monday 1st May 2023
Let’s quickly walk through a few dispatch intervals early on Monday 1st May, starting with the last one of the previous day:
(A1) The situation at 00:00 … i.e. at the end of Sunday 30th April 2023
Remember the 00:00 dispatch interval is the dispatch interval that ends Sunday 30th April 2023.
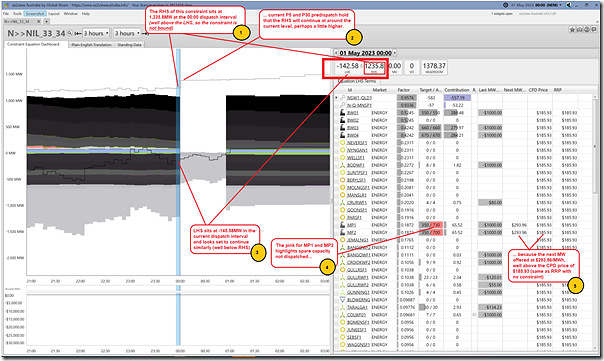
Let’s take a quick look at what the situation was via the ‘Constraint Dashboard’ widget focused on the ‘N>>NIL_33_34’ constraint equation:
I won’t repeat all of the commentary in the annotations above, but the key point is that the RHS is well above the LHS (i.e. the constraint is a long way from binding) and is forecast to continue to be so into the future.
Note at this time that there are many units that are sitting with 0MW contribution to the LHS … in particular these are solar farms (not generating in the middle of the night, obviously) and wind farms (coincidentally not windy at this point).
(A2) Five minutes later at 00:05 … i.e. at the start of Monday 1st May 2023
Stepping forward 5 minutes would not ordinarily mean much (stepping into a new day) but on this occasion it certainly does for this constraint equation on this instance.
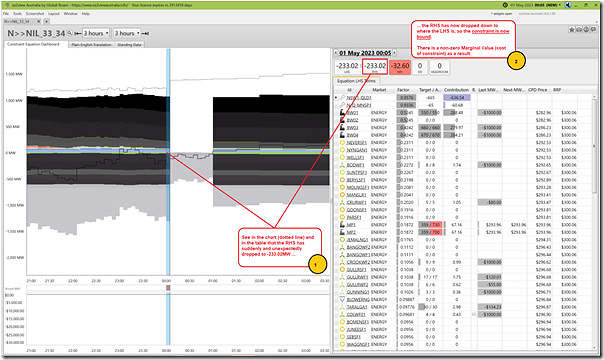
Here’s the updated snapshot of the ‘Constraint Dashboard’ widget focused on the ‘N>>NIL_33_34’ constraint equation:
As noted on the image, we can see that the RHS has dropped drastically, and unexpectedly – causing the constraint to bind and the NSW RRP to rise a little.
(A3) First major price spike, at 00:40
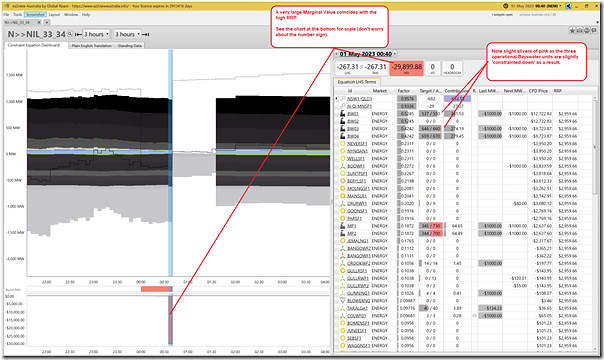
Skipping over a few dispatch intervals we’ll land at 00:40, the first dispatch interval seeing a price above $1,000/MWh (hence triggering the SMS record here).
Here’s the updated snapshot of the ‘Constraint Dashboard’ widget focused on the ‘N>>NIL_33_34’ constraint equation:
See the very large Marginal Value associated with the high RRP.
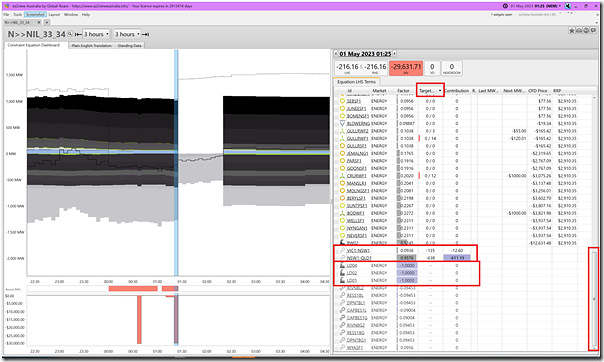
(A4) Second major price spike, at 01:25
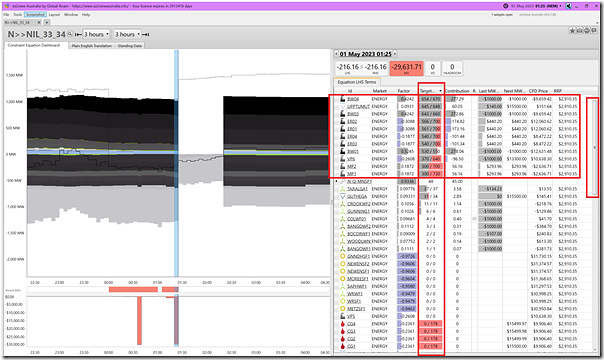
Skipping over a few dispatch intervals we’ll land at 01:25, the second dispatch interval seeing a price above $1,000/MWh.
Here’s the updated snapshot of the ‘Constraint Dashboard’ widget focused on the ‘N>>NIL_33_34’ constraint equation wound forward to this dispatch interval … but note in this instance I have resorted the table in descending order of ‘Target’ (i.e. to see which units are actually contributing at this time.
In particular note that the Target are dominated by coal units (and by UPPTUMUT … but this has a very low LHS factor so its LHS Contribution is only 60.05MW). Of the coal units:
1) Bayswater has a positive LHS factor so is being ‘constrained down’ by the constraint;
2) Whereas Eraring units have a negative LHS factor so are being ‘constrained up’ by the constraint … and are bidding $440.20/MWh at the time.
3) Note that some big negative targets appear at the bottom of the chart (visible in the image below) for the VIC1-NSW1 (i.e. VNI) and NSW1-QLD1 (i.e. QNI) interconnectors
4) Also note that the Liddell units still feature here on the LHS (and with large LHS factors of –1.0) but are deregistered so show 0MW for contributions.
Through all of these images, observe that the RHS of the constraint (from 00:05) has dropped down to the level of the LHS … but that the P5 and P30 predispatch have continued for forecast that it would rise to the more ‘normal’ levels seen for it at the end of Sunday 30th April 2023.
I wonder if it might have something to do with the retirement of Liddell?
(B) What happened to the RHS of this constraint?
On the ‘Plain English Translation’ of this ‘Constraint Dashboard’ widget we link to various details about the constraint provided by the AEMO, and fed through to the ez2view software. Here’s some of the details provided (warning … the term ‘Plain English Translation’ is AEMO’s term, not ours!)
Dispatch RHS=
1.589 x (Min
(
(NSW: 34 Bayswater – Liddell 330kV Sustained Emergency Rating
– MVA flow from Bayswater to Liddell 34 330kV line
– 0.9672 x [MVA flow from Bayswater to Liddell 33 330kV line]),
(NSW: 33 Bayswater – Liddell 330kV Sustained Emergency Rating
– MVA flow from Bayswater to Liddell 33 330kV line
– 0.9672 x [MVA flow from Bayswater to Liddell 34 330kV line])
)
– 30 {Operating_Margin})
continues…
Note >> formula continues below with ‘feedback terms’ (which relate to the InitialMW of each of these DUIDs and Interconnectors … being what was happening at the start of the dispatch interval).
… continues from above
+ 0.9336 x [MW flow north on the Terranora Interconnector]
+ 0.9576 x [MW flow north on the QNI AC Interconnector]
+ 0.0936 x [MW flow north on the Vic to NSW AC Interconnector]
+ 0.09492 x [Avonlie Solar Farm (254 MW)]
+ 0.1111 x [Bango 973 wind farm]
+ 0.1112 x [Bango 999 wind farm]
+ 0.2198 x [Beryl solar farm]
+ 0.09887 x [Blowering hydro (3 aggregated units)]
+ 0.09009 x [BOCO Rock WF]
+ 0.2272 x [Bodangora wind farm]
+ 0.0956 x [Bomen solar farm]
+ 0.09392 x [Broken Hill Solar Farm]
+ 0.5245 x [Bayswater unit 1]
+ 0.5245 x [Bayswater unit 2]
+ 0.4242 x [Bayswater unit 3]
+ 0.4242 x [Bayswater unit 4]
+ 0.09004 x [Capital battery 125.4 MW (Gen mode)]
– 0.09004 x [Capital battery 125.4 MW (Load mode)]
– 0.2361 x [Colongra GT unit 1]
– 0.2361 x [Colongra GT unit 2]
– 0.2361 x [Colongra GT unit 3]
– 0.2361 x [Colongra GT unit 4]
+ 0.09453 x [Coleambally solar farm]
+ 0.09681 x [Collector wind farm]
+ 0.1056 x [Crookwell 2 wind farm]
+ 0.202 x [Crudine Ridge wind farm]
+ 0.09438 x [Corowa solar farm]
+ 0.09453 x [Darlington Point solar farm]
– 0.3088 x [Eraring unit 1]
– 0.3088 x [Eraring unit 2]
– 0.1877 x [Eraring unit 3]
– 0.1877 x [Eraring unit 4]
+ 0.09465 x [Finley solar farm]
– 0.9726 x [Gunnedah solar farm]
+ 0.1916 x [Goonumbla Solar Farm]
+ 0.1038 x [Gullen Range Solar Farm]
+ 0.1038 x [Gullen Range WF]
+ 0.1038 x [Gullen Range WF 2]
+ 0.1026 x [Gunning Wind Farm]
+ 0.09331 x [Guthega hydro (2 aggregated units)]
+ 0.09453 x [Hillston solar farm]
+ 0.09422 x [Hume (NSW) hydro]
+ 0.1765 x [Jemalong solar farm]
+ 0.0956 x [Junee solar farm]
– Liddell unit 1
– Liddell unit 2
– Liddell unit 4
+ 0.09409 x [Limondale 1 solar farm]
+ 0.09409 x [Limondale 2 solar farm]
+ 0.2041 x [Manildra solar farm]
– 0.9463 x [Metz solar farm]
+ 0.2081 x [Molong solar farm]
– 0.9604 x [Moree Solar Farm ]
+ 0.1872 x [Mt Piper unit 1]
+ 0.1872 x [Mt Piper unit 2]
+ 0.2311 x [Nevertire Solar Farm]
– 0.9606 x [New England Solar Farm #1]
– 0.9606 x [New England Solar Farm #2]
+ 0.2311 x [Nyngan Solar Farm]
+ 0.1916 x [Parkes solar farm]
+ 0.09004 x [Queanbeyan BESS (Gen component)]
– 0.09004 x [Queanbeyan BESS (Load component)]
+ 0.09453 x [60 MW Riverina Battery 1 (Gen Mode)]
+ 0.09453 x [Riverina Battery 2 (Gen Mode) 65 MW]
+ 0.09453 x [Darlington Point Battery (Gen Mode) 25 MW]
– 0.09453 x [60 MW Riverina Battery 1 (Load Mode)]
– 0.09453 x [Riverina Battery 2 (Load Mode) 65 MW]
– 0.09453 x [Darlington Point Battery (Load Mode) 25 MW]
– 0.958 x [Sapphire wind farm]
+ 0.0956 x [Sebastapol solar farm]
– 0.09325 x [Lower Tumut pumps (3 aggregated pumps)]
+ 0.09392 x [Silverton wind farm]
+ 0.09409 x [Sunraysia 1 solar farm]
+ 0.2267 x [Suntop solar farm]
+ 0.09776 x [Taralga Wind Farm]
+ 0.09325 x [Lower Tumut hydro (6 aggregated units)]
+ 0.0931 x [Upper Tumut hydro (8 aggregated units)]
+ 0.09519 x [Uranquinty GT unit 1]
+ 0.09519 x [Uranquinty GT unit 2]
+ 0.09519 x [Uranquinty GT unit 3]
+ 0.09519 x [Uranquinty GT unit 4]
– 0.2608 x [Vales Pt unit 5]
– 0.2608 x [Vales Pt unit 6]
+ 0.0956 x [Wagga North solar farm]
+ 0.2311 x [Wellington solar farm]
+ 0.07752 x [Woodlawn wind farm]
– 0.9479 x [WHITE ROCK SOLAR]
– 0.9479 x [White Rock wind farm]
+ 0.0956 x [West Wyalong solar farm]
+ 0.0956 x [Wyalong Solar Farm (90 MW)]
I’ve highlighted the bits of the RHS that particularly refer to Liddell, or the lines connecting to it.
(C) Speculation … so beware!
With respect to these two bunches I am speculating here (so caveats abound!!):
Q1) With respect to the network terms at the top:
(a) It seems unlikely that the MVA flow will have gone awry (as the flow is just the flow)…
(b) but I wonder has something gone awry with the Emergency Ratings on these lines in the absence of Liddell from the market systems?
Q2) With respect to the ‘Feedback Terms’ for Liddell:
(a) I wonder what happens in the RHS when the InitialMW for the units LD04, LD02 and LD01 disappear altogether?
(b) … i.e. they are not zero, they are disappeared
(c) Ordinarily when units retire, they stick around in market systems for a while before they are deregistered, and this gives the AEMO and others times to iron out quirks (e.g. remove the Liddell units from the RHS and LHS and the equations). In this case I wonder whether
(d) Could there be some ‘default number to use if the DUID disappears’ that could have driven the RHS down significantly?
(e) Surely it’s not a coincidence that the MaxCap of the three Liddell units was each 500MW … and 3 x 500MW (noting the -1 multiplier in the RHS feedback terms) would equate to the 1500MW amount the RHS dropped by when Liddell disappeared from market systems?
On that note I will leave this article, but look forward to learning more…


Leave a comment