Busy times in the NEM currently, with 3 articles already within 24 hours and this one making 4 (for a “spare time” commentary site, that might almost make a record?).
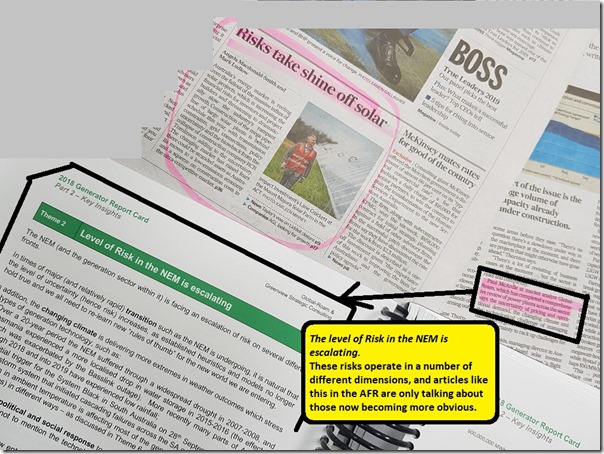
This morning I noted Angela Macdonald-Smith and Mark Ludlow writing in the AFR that “Risks take the shine off solar” , with the article referencing the work we have done in compiling the Generator Report Card – in collaboration with Jonathon Dyson and his Greenview team, and with additional assistance from a range of other people as well. The online article talks about “threats” whereas the print article used the word “risk” on a number of occasions.
In Theme 2 within Part 2 of our Generator Report Card, we explore a number of different dimensions of this risk (and also elsewhere, like in Theme 9 where we explore implications for System Security).
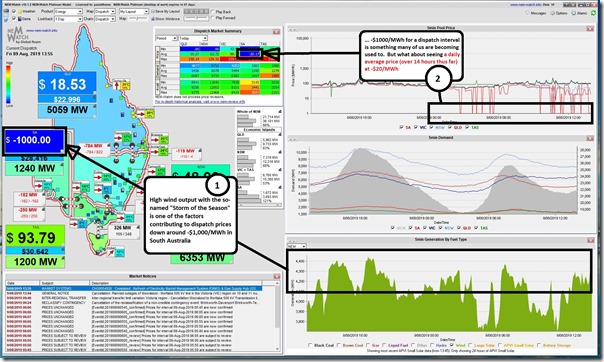
Coincidentally today, our NEMwatch dashboard presented us with an ever-present reminder of one aspect of this risk – here in the 13:55 dispatch interval down at –$1,000/MWh in South Australia:
For frequent NEM watchers like us, we might all have become a little more blasé about dispatch interval prices down at the Market Price Floor of –$1,000/MWh.
However (as noted on this image) what about seeing that the time-weighted average dispatch price in South Australia today across all 14 hours to 13:55 was down below –$20/MWh …. and it has been falling over recent hours!
Risky business indeed…
————-
Don’t forget that Sydneysiders have these two opportunities during August to meet with us and talk through what’s in the Generator Report Card – and you can:
(a) download the report here, for those who have access; and
(b) order your copy here, if you don’t.
————-
PS on Sunday 11th August
Following publishing this article on Friday afternoon, I also posted a short note here on LinkedIn noting that:
“I don’t think I can ever remember seeing a *daily average* price down below $0/MWh at 14:00 in the afternoon…”.
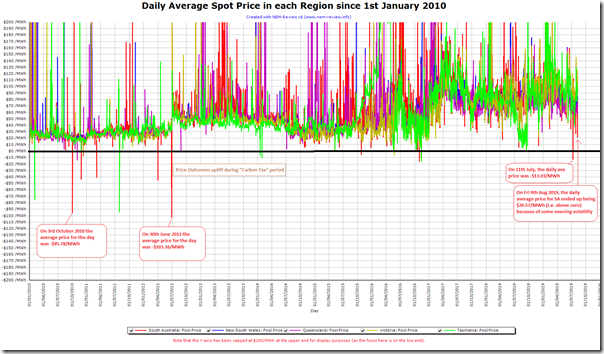
True to form for an industry full of data junkies (like myself) Josh Stabler did point out an outcome where daily (time-weighted) average price in South Australia did drop down to –$103.81/MWh for the whole day.
Josh’s point, and some other questions I received from others, prompted me to power up NEMreview v6 to quickly generate a trend (which I posted on LinkedIn that afternoon) trend average price for each day from 1st January 2010 (which i really should have been done before I posted in the first place!). Here’s the same chart updated today to include the day’s results also for Friday 9th and Saturday 10th August:
As we can see over this date range of almost 10 years:
Observation #1 = there were a number of days where the daily average spot price was below $0/MWh, with most of these being prior to 2013:
1a) There were 15 days below $0/MWh in South Australia:
(i) with 30th June 2012 being most severe, down at –$103.16/MWh on 30th June 2012, just before the Carbon Tax period started
Note that this number is slightly different than what Josh noted LinkedIn (i.e. $103.81/MWh) which appears to be because of an easy-to-make error Josh made in treating the price for 00:00 on 20th June 2012 as pertaining to the 20th June (whereas it’s the price for the last half hour on the prior day).
(ii) and the most recent period being 11th July 2019, down at –13.03/MWh
(iii) only four days since 2012
1b) There were also 1 instance in QLD, 2 instances in VIC and 9 instances in TAS
Observation #2 = the way the rest of Friday panned out, the average price for the day actually ended up being above $0/MWh in South Australia, due to some volatility later in that day.


Leave a comment