As frequent WattClarity readers will know, we’ve been investing thousands of hours in an extensive review of 20 years of a wide variety of generation performance data in order to prepare our Generator Report Card (with data generally to 31st December 2018).
Over the past couple weeks as part of a broader combined team, my role has been to delve into considerable detail with respect to what we can see evolving with respect to production from Large Solar plant across the NEM (whilst others are applying similar levels of analysis for the other fuel types*).
* note that Fuel Types are just one of the dimensions we’re using to determine what can be seen in the data.
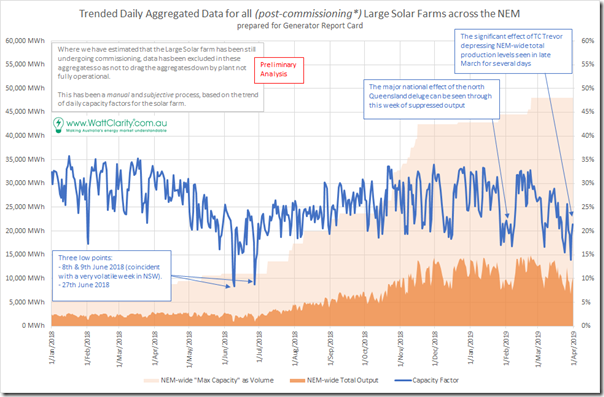
Given the recent after-effects of Tropical Cyclone Trevor last week, I thought it might be useful sharing this particular (preliminary!) trend more generally with WattClarity readers here:
You’ll note in this case we have extended data beyond 31st December 2018 because of the more recent growth in large solar and lack of insufficient history beforehand.
For all generators across the NEM, we’re particularly interested in varying aspects of dependability (as we define it in the Report Card).
We’ll explain all of this in more detail in the Report Card (and still have to correct some of the foibles in the data set) but am particularly interested to note that, despite the growth of large solar capacity (even after commissioning) we see some significant reductions in output NEM-wide over multiple consecutive days as a result of major weather events.
A couple are flagged in the chart about, with brief discussion below:
| late March 2019 | Last week we saw the lingering after-effects of Tropical Cyclone Trevor turn into a rain depression that (amongst other things) dropped aggregate solar output across the NEM by almost half at its peak. |
| late Jan 2019 and early Feb 2019 | On 4th February I had previously noted how the north Queensland deluge (leading into the Townsville flooding event) had slashed output from solar plant across a wide area in the north of the state. |
| 27th June 2018 | Whatever caused this event is still to be investigated. |
| 8th and 9th June 2018 | I note that these low days of solar output (back when it was concentrated more in NSW) was unfortunately coincident with this “shaky week for the supply-demand balance” in NSW. |
We will be drilling into these types of results in more detail in the Report Card.
———————–
Given the current toxic political climate leading into the Federal Election, we’ve elected to delay the release of the Report Card until after the election has been completed so to reduce the risk that our Report Card ends up a political football, and increase the likelihood it might help to achieve something constructive in this challenging energy transition.
I’ve already notified those clients who have already chosen to pre-order their copy (at early-bird rates), but thought it worth noting more broadly here. We’ll try to keep this page updated with project status. The upside of that is it keeps the early bird pricing open for a little longer…


A physicist weighs in with some calculations and analogies with the really big picture-
https://www.manhattan-institute.org/green-energy-revolution-near-impossible
It pays to keep reminding ourselves that electricity is a means of delivering energy and it’s EROEI that rules it all and replacing every ICE vehicle with battery stored energy is only adding to competition for battery production and output. It would appear from Mr Mills’ calculations that as fast as all the Gigafactories we could muster for the DUAL task to get rid of hydrocarbons altogether they’d be also be trying to keep up replacing spent ones. That’s before we even deal with all these spent incendiary items that at the moment are predominantly going into landfill unlike the recycling of lead acid batteries.
Mr Mills, is but presenting the glass half empty. Lets see just where we can get resources that the group of people that were happy to believe Oil/Coal/water/food and just about everything else was going to run out, yet, are now happy to believe that there are enough resources to build all the stuff they think will give us zero Co2. I find it amazing that all of a sudden all of the minerals that are needed for RE are not even talked about.
Has any of them added up the tonnes?????. or guessed at them. Wind turbines use a huge amount of steel, and there will need to be a bloody lot of them.
(They were so wrong about Oil and coal running out it was a joke, yet steel for wind turbines is a snap. The coke and iron ore)
Hi, wondering about a couple of questions on the combined solar tracking installations vs rooftop solar:
– average capacity factor (all periods all stations)
– capacity factor per hour of the day for all seasons
– contribution to peak demand e.g. the 2017 AEMO SA renewable energy report discusses the 85th percentile of peak demand periods only receives 1.6% of solar nameplate capacity
– stations with highest and lowest capacity factors
Cheers
Ben