Summer’s far from over at this point, it would seem, looking into our set of 7-day ahead regional supply and demand balances we’ve constructed with the web-based Trends Engine bundled with our ez2view software.
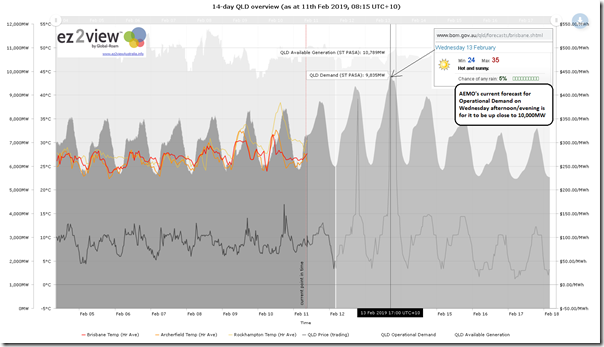
Here’s what I’ve seen on Monday morning when checking what the forecast is for the Queensland region – noting, in particular, the forecast for very high demand in the Queensland late on Wednesday:
Click on the image for a larger static view, and licensed clients can access the live updating trend here to keep tabs on how AEMO’s successive forecast evolve over time.
As highlighted on the chart in mouse-over, the peak of “Demand and Non-Scheduled Generation” (i.e. proxy for Operational Demand in the forecast horizon) is forecast to be 9,835MW in the half-hour ending 17:00 NEM time on Wednesday (i.e. QLD time).
(A) What about solar?
With these sorts of peak demand events it’s interesting to think about solar’s contribution, so for clarity note that:
1) For large-scale solar (of which there is a growing volume in QLD) these volumes should be accounted for in the AEMO’s forecasts (i.e. this contribution will be amongst the generation meeting this demand, not netting off from it).
2) The smaller-scale rooftop PV will act to net off AEMO’s calculations for demand, by meeting consumption requirements before they get to AEMO’s meters (i.e. “demand the AEMO doesn’t see” in real time).
2a) There will still be a reasonable contribution from small-scale rooftop PV at this time (though note prior comments about the faster afternoon declines due to panels facing north, not west). In the image above I have included a snapshot of the BOM’s forecast, which notes for sunny conditions in Brisbane, which is the hub of the small-scale contribution. Given the size of the installed capacity of rooftop PV in Queensland, the fact that AEMO is forecasting a peak Operational Demand as high as it is suggests a very large underlying demand.
2b) Not also prior comments about the challenges of measuring contributions from small-scale PV.
3) Medium-scale PV is a loose category that sits in between the rooftop PV estimated by APVI based on small-scale systems registered with the Clean Energy Regulator and the larger stuff registered at the AEMO for which they have SCADA data for. There’s a growing volume in this range 100kW to 30MW that (as far as I am aware) has no collective visibility.
Readers will be able to watch both large and small in real time on Wednesday afternoon via our RenewEconomy-sponsored NEMwatch Supply & Demand Widget (located on RenewEconomy, on the NEMwatch portal, on WattClarity and a growing number of other places). We’d love to be able to also show medium-scale, so please let us know if you can help us with that?
(B) What’s the all-time maximum demand in Queensland
It’s been a couple years since we have had the time to give away a BBQ in our peak demand competition, but that has not diminished our interest in seeing how peak demand** has trended in the past, and how current summers are tracking. Hence we could not leave an opportunity like this pass by without looking backwards.
** though readers should be aware that the nature of supply/demand is changing such that peak demand has become only one of the factors that is determining periods of low instantaneous reserve plant margin – something we will be exploring in our Generator Report Card 2018, to the extent that time permits.
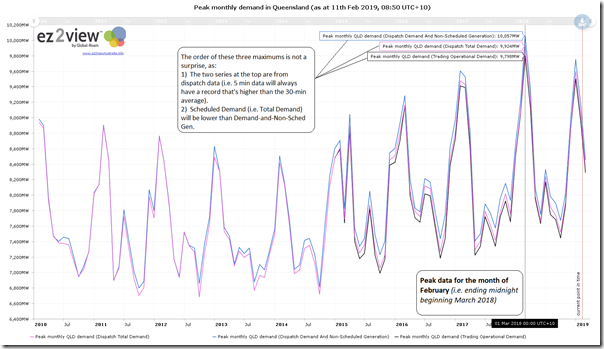
Using the same Trend Engine as above we produce this trend of peak monthly demand in Queensland (using three different measures of demand) over the past few years:
For those who want to know more about the different definitions of demand, you can start here with this explainer.
Notwithstanding these complexities, the key take-away here is that the peak demand on Wednesday looks set to be very close to an all-time record. A patch of late-afternoon cloud cover over Brisbane (to ramp down rooftop PV, whilst maintaining humidity) might be all it takes.
(C) How are the AEMO forecasts trending
These AEMO forecasts are updated many times through the day, and will be updated more frequently as we draw closer to reality (that’s what we would expect, given that these forecasts are a key input in operating the market).
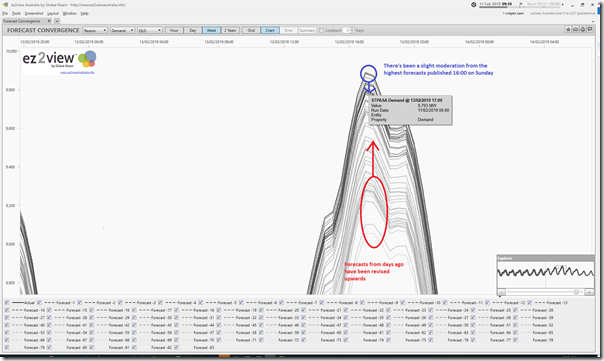
Using the “Forecast Convergence” widget in the ez2view installed software and in this case flipping to chart view, whilst zooming in to focus on Wednesday’s forecast for Scheduled Demand, we can see that the forecasts grew throughout last week, but have moderated slightly since yesterday (i.e. Sunday) afternoon:
Time will tell what actually transpires – we will be watching with keen interest (but somewhere away from the heat!)


Leave a comment