It’s 2nd July, hence we’ve just ticked over into Quarter 3 – and we’ve returned to a prior theme of price outcomes seen through the Q2 period in the NEM:
| Q2 2016 | Through the quarter as it had unfolded we’d noticed (on our dashboard displays) what seemed to be a marked change in the pattern of prices.
Hence, at the end of the quarter we completed a more systematic analysis and noted that price patterns in Q2 2016 were “truly remarkable”. |
| Q2 2017 | We picked up the same theme in July 2017 to review Q2 prices for 2017 and concluded that “price outcomes for Q2 2017 were off the chart”.
These thoughts were picked up in various news media organisations. |
| Q2 2018 | Based on our current analysis, we note that prices have backed off somewhat from the extreme outcomes of Q2 2017 – however it seems that we’re far from out of the woods, yet.
We’ll examine this further below… |
Keep in mind that we selected Q2 period back in 2016 for this type of analysis as it is traditionally one of the more boring quarters – it does not see the extremes of summer demand that so affect Q1, and hence lead to significant price volatility, and is also generally less affected by low temperature demand peaks than the Q3 period. Hence the fact that we’re even talking about it at all is somewhat remarkable, in its own right.
In reviewing Q2 2018, I have used the same analytical framework presented twice before, with a couple of additions:
| Added WA | In the past 12 months our development of the upgrade to NEMreview v7 has come ahead a long way (many thanks to the great input that a diverse range of v6 clients have had on the development, through their early access to v7).
Using v7 for this year’s analysis, I decided to add in what we can see of prices for the “WEM” operating in the South-West Interconnected System of Western Australia as I was curious to see what we could see. |
| Looked at prior expectation in futures pricing | Also with the ability of the “NEM Futures” data feed from ASX Energy accessible through NEMreview v7, we took a look at the market’s expectations for the average price that Q2 2018 would deliver up to 18 months in advance.
Particular focus is placed on the expectation that was in place at the end of Q2 2017. |
| Looked at Negative Prices | Through June we noticed a number of instances of negative dispatch prices in the Queensland region. I used a snapshot from NEM-Watch v10 to illustrate one of these on social media, which led to some discussions.
Subsequently I posted this article about the emergence of the “Solar Correlation Penalty” on 25th June. Given the more systematic analysis of prices being conducted at the end of quarter, I also thought it useful to look specifically at the incidence of negative trading prices. |
| Analysed FCAS prices | We’ve commenced a similar analysis of FCAS prices, but it’s not yet complete (and would make this article too long, in any case).
Stay tuned for these results (as Part 2 of this Analysis) in a later post… |
With the above as context, we’ll move onto the results.
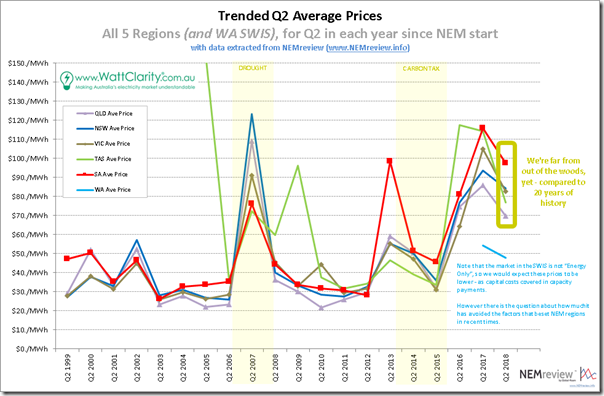
1) Average prices in Q2 still high all regions, but down on 2017
In 2016 we saw that average prices through Q2 were elevated quite high compared with the historical range (especially remarkable after flagging the non-normal factors of the drought of 2007 and “carbon tax” period as influencing some other outliers). In 2017 we saw that the average prices had climbed “off the charts” in a very worrying sign. For 2018 we see that Q2 prices are down from the peak in 2017, but still well above the vast majority of prior years in all NEM regions.
1a) Queensland trended stats
For ease of comparability, we’re starting at the top of the NEM to work our way around:
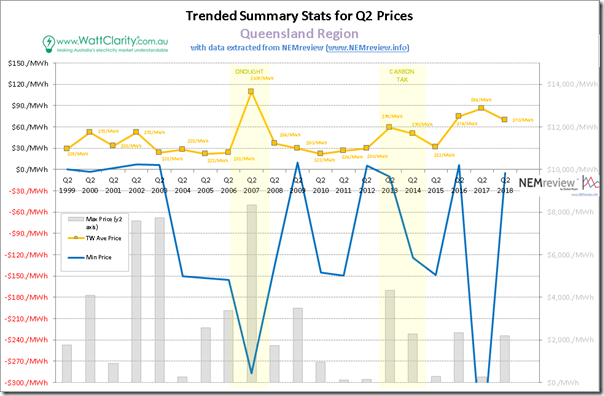
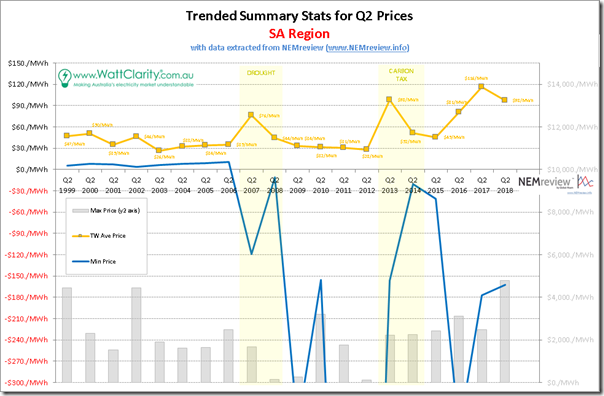
In these charts, we’re showing Minimum, Maximum and Average Prices over the quarter – and for ease of readability, we’ve moved the quarterly maximum trading (i.e. 1/2 hourly) prices to the Y2-axis and shown this data series as a bar chart.
1. We can see that, for Queensland in Q2 2018, the time-weighted average price through Q2 dropped from $85.83/MWh (in 2017) to be $69.69/MWh (in 2018). However we also note that this is the 4th highest price outcome in 20 years of NEM history – with the only other higher prices being:
(a) In 2007, due to the drought (which took a heavy toll on Queensland’s power generation fleet, along with threatening water supplies to the south-east corner of the state); and
(b) In 2016 and 2017, with a similar pattern of prices across the quarter, as noted below.
2. We see the highest price up at $2,175/MWh and the lowest just below $0/MWh (at –$4.60/MWh)
It should be noted that there are some organisations for which these higher prices are a beneficial outcome – however there are also many for whom they represent a large challenge. The fact that they have dropped by more than $15/MWh from Q2 2017 to Q2 2018 will be a refreshing outcome – however most will still be thinking that we’re not out of the woods, just yet.
Moving south to NSW …
1b) NSW trended price stats
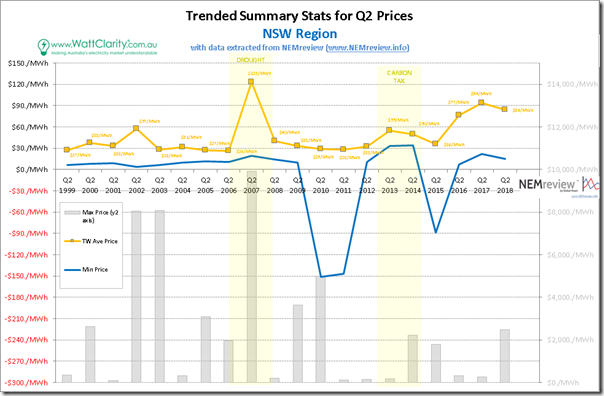
Moving into NSW, we see the average price for the Quarter ($84.30/MWh), which is higher than the outcome seen in QLD (and also slightly higher than the VIC price). The average has dropped from the outcome in Q2 2017 (10% decline), but not by as much as seen in QLD (19% decline). Price outcomes in NSW for Q2 2018 are still higher than seen in Q2 2016:
As was the case for Queensland, the cluster of Q2 average prices for 2016 ($76.75/MWh), 2017 ($93.62/MWh) and 2018 ($84.30/MWh) are at least $20/MWh higher than in all but one of all prior years in the NEM (with the exception being the very drought-affected 2007).
I noted in last year’s post that “whilst that drought year (2007) suffered from transient issues, it is looking like what’s affecting prices in the NEM is now more deep-seated, multi-faceted, and systemic.”. The still-high results seen this year add further evidence to suggest that we have passed any turn-back point, and this new pattern of prices will be very difficult to dislodge – which will mean major challenges to a variety of energy consumers (ranging from a sizeable number of households dealing with cost of living concerns, to the major energy users that we have been serving for a decade or more).
Continuing south to Victoria…
1c) Victoria trended price stats
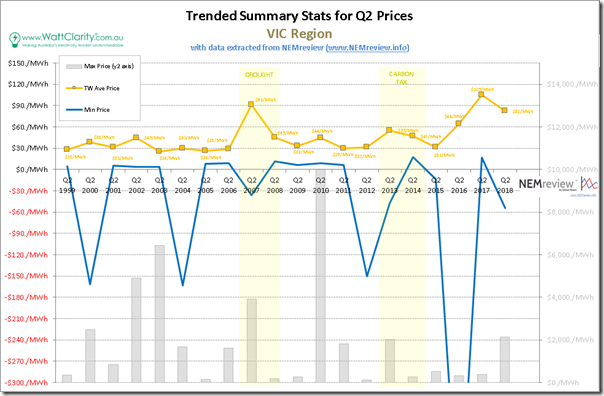
From Q2 2016 to Q2 2017, we saw the average price in VIC break $100/MWh (up at $104.92/MWh). Whilst this has now dropped by over $20/MWh (to $82.49/MWh for Q2 2018), we note that this level is still higher than the price outcome of $64.19/MWh in Q2 2016 (which was remarkable at the time).
We see that the outcome for Q2 2018 is lower than in Q2 2017 (and in the drought-affected Q2 2007), but is higher than the remaining 17 other years experienced in the NEM to date.
Over the water to Tasmania …
1d) Tasmania trended stats
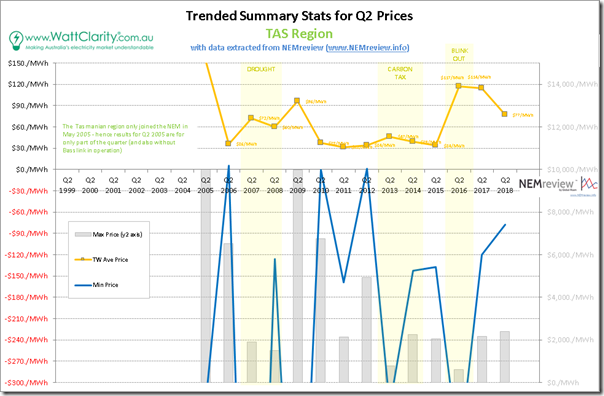
Remembering that Tasmania was faced with massive supply challenges in Q2 2016 (with perilously low hydro reserves coupled with a long-term outage on Basslink) that garnered plenty of media and political attention, last year I noted that it was mind-numbing to see that Q2 2017 was very nearly as bad (despite reasonable hydro reserves and working interconnection, and a fraction of the media attention):
We see that prices for Q2 2018 have dropped significantly from the massive levels of 2016 and 2017 – that’s the “glass half full view”. The flip side of that coin is that the price for this year’s Q2 (at $76.95/MWh) is more than double the much lower prices achieved in 2015, 2012, 2011, 2010, 2006 (and almost double that of 2014, as well).
Over to South Australia …
1e) South Australia trended price stats
In this year (as has been the case for 5 of the 6 most recent years) we see the average Q2 price outcome is the worst of all 5 regions (as was the case also in 2017, 2015, 2014, and 2013):
Here, time-weighted average spot price for Q2 2018 was at a very high level of $97.50 – though this was not as severe as the even higher level seen in Q2 2017 (of 115.93/MW). This level was beaten only by the result last year and (slightly) by the result in Q2 2013.
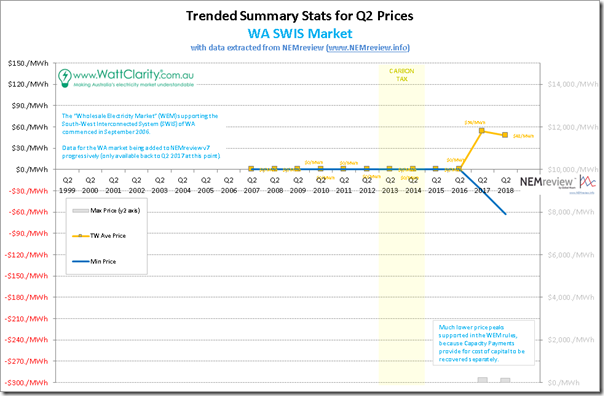
1f) A brief look into the WEM for the SWIS of Western Australia
Given that we’re also in the process of adding in data for the market in the South-West Interconnected System (SWIS) within Western Australia into NEMreview v7, I thought I might take a quick look at the price data we have to see how it is comparable.
As noted on the chart, the market in the WEM is not an “Energy Only Market” (because there are capacity payments made to cover the generator’s cost of capacity). Hence it is reasonable to assume that average spot prices in the WEM will be lower, as a result.
I don’t have too much else to add, at this point, as we don’t (yet) have much of the history of prices loaded into NEMreview.
1g) Summing up average Q2 prices all regions
In the following chart, we sum up the state of NEM pricing seen across all regions of the NEM, and in the WEM:
In the same vein as last year, the most important take-aways from this analysis should be:
1. That prices in Q2 2018 have come off the boil compared to the “off the charts” results seen in Q2 2017; however
2. These prices are still way out of line in comparison to the vast majority of years seen for prices in the NEM since 1999.
3. It would be very foolish for anyone to conclude that we’re anywhere near out of the woods, yet…
Last year I noted a few other probable conclusions – which, with the “benefit” of seeing another year of extremes pass by in Q2 2018, seem even more likely to be true:
4. That it appears that we’re entering a new environment that’s distinctly different from the years that preceded; and
5. That this affects everyone, right across the NEM ; and finally that
6. Those pre-disposed to draw overly simplistic “it was due to … [this one factor]” conclusion are unlikely to be correct, and could be dangerously misleading.
Last year I noted about “our need to rapidly increase the capacity of our thinking, to deal with a greatly increased number of wildly changing variables, currently seems to have far outstripped our collective willingness, or ability, to do this (or, in most cases, even an awareness that this intelligence gap has opened)”.
With the ongoing discussions about various aspects of this energy transition it’s worth using real results to ground perspectives about the size of the challenge. Sadly the vociferous perspectives seeming to reach crescendo about the intent and design of the NEG (the “National Energy Guarantee”, with coincident webcast of the latest design iteration today) risk narrowing our focus, when the challenge of the transition is much broader than that.
As I noted last year, my sense is still that it’s likely to end in tears.
2) Looking in more detail at each region (pattern of prices, and convergence of futures)
So now we see three consecutive years of extremes in average price across an erstwhile “boring” period in the market –> Q2.
As we’ve done in the 2 prior years, we’ve looked more systematically across each of the regions, in order to confirm some of the more discrete observations we’ve been making on a more ongoing basis by virtue of various live updating dashboards we have at our disposal:
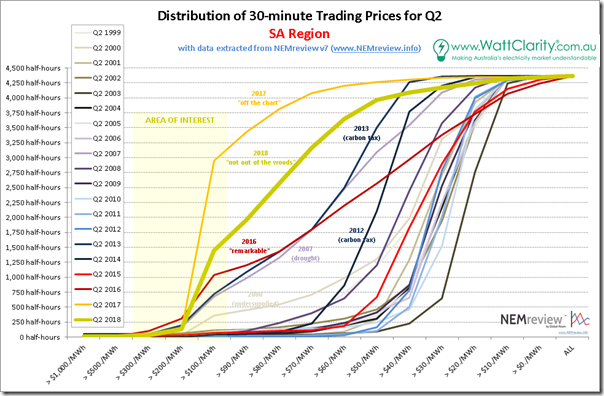
1. One thing we’ve done is to take all 4,368 half-hour periods through the quarter (through each of the 20 quarters of the NEM-to-date) and apportioned prices into buckets, depending on the level at which they fell. This delivers 20 discrete curves have then been overlaid on a chart for each region, with particular years of interest highlighted. These are updates on the prior year’s results.
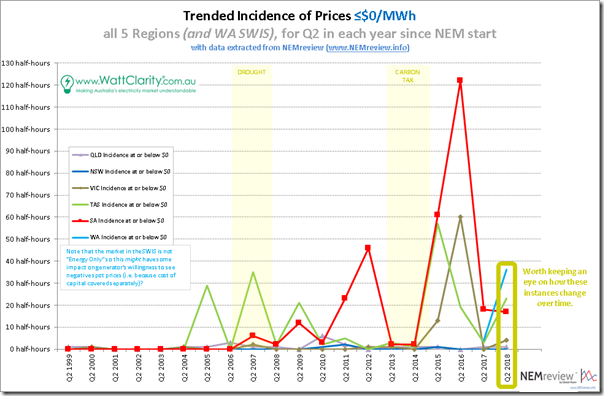
2. Given a spike in interest in negative prices, we’ve also had a brief look at negative prices with a summary below.
3. Finally, we’ve taken a look at the market’s prior expectations for where the Q2 2018 average price would end up, utilising the end-of-day futures price data we now make available through NEMreview v7.
2a) Negative Prices
We’ll briefly cover the incidence of negative prices and then move onto the (currently) more critical instances of high prices.
Last week I’d posted a few thoughts about the emergence of the “Solar Correlation Penalty” here. Whilst concern about negative prices are real for some people (we’re working with a number of generators – including some quite small – to help them avoid these instances) this chart shows that the incidences of negative prices are small at present. We expect that this will grow over time.
2b) A closer look at Queensland (distribution, and expectations)
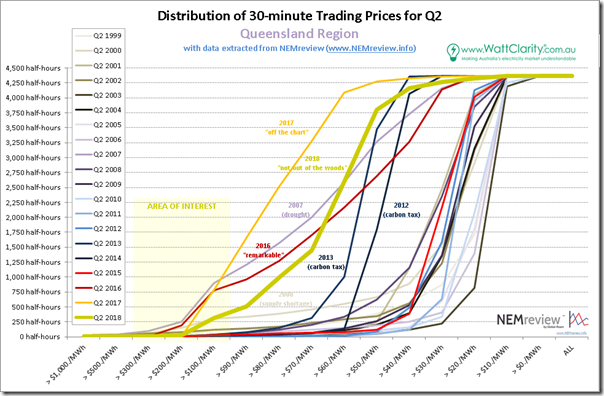
Starting again at the top of the NEM, here’s an update on last year’s chart for Queensland:
As in the past 2 years, other outliers have been identified. We see that the results for Q2 2018 are not as extreme as 2017, or even 2016 – which is why the average for Q2 2018 is down on those two years.
However we also see that there is still daylight between Q2 2018 and the (old?) “normal” years. There are relatively few instances where the trading price settled below $50/MWh (i.e. only 571 half-hours, or 13% of the time) – and this is in spite of the state government’s “don’t make so much money” direction in June 2017 to its government-owned generation companies (though this is still an increase on the low of 89 hours in Q2 2017).
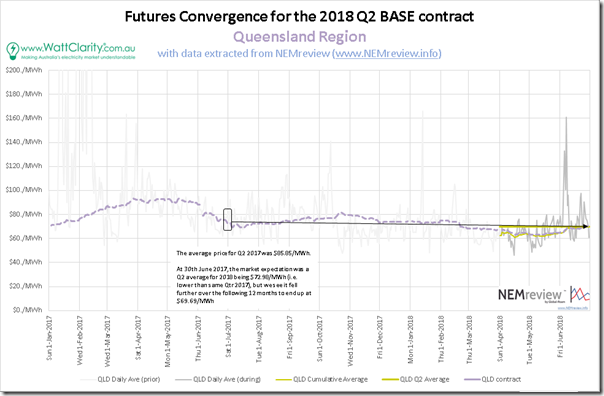
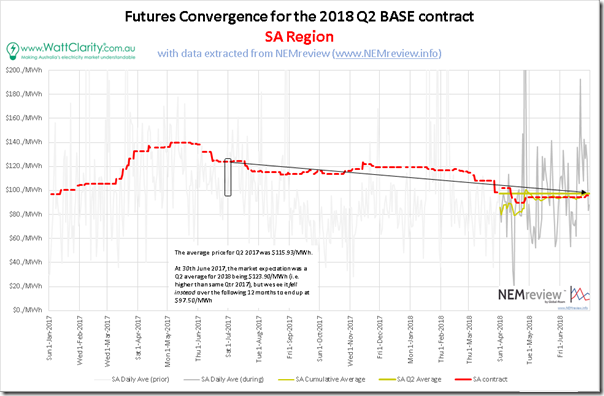
Also included here is a trended view of both end-of-day price for the Q2 2018 BASE contract for the Queensland region (created by ASX Energy), matched with the daily average spot price for the Queensland region:
I’ve specifically highlighted the time when Q2 2017 ended.
At that point the QLD region saw an expectation that the Q2 2018 price would end up at $72.98/MWh (where the Q2 2017 price had just clearer higher at $85.85/MWh). As noted with the arrow, that futures contract eventually paid out a year later at a slightly lower level of $69.69/MWh, so we might say that the early market expectation matched reality fairly well in that case.
Indeed, we see that the cumulative average for Q2 2018 was tracking a few dollars below that eventual level, before the shaky week of early June 2018 delivered some volatility that drove the outcome higher.
2c) A closer look at NSW (distribution, and expectations)
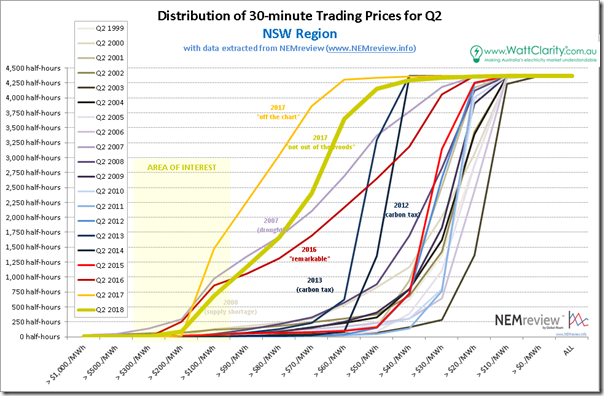
Progressing further south, we see a similar pattern in NSW:
Again we see the distribution for Q2 2018 backed off somewhat from the massive levels of Q2 2017, but still miles away from the (superseded?) “normal” expectations in most prior Q2 years. We see only 217 half-hours here where the spot price ended up below $50/MWh (i.e. 4.9% of the time) in Q2 2018, though this is still greater than the miniscule 32 hours seen in Q2 2018.
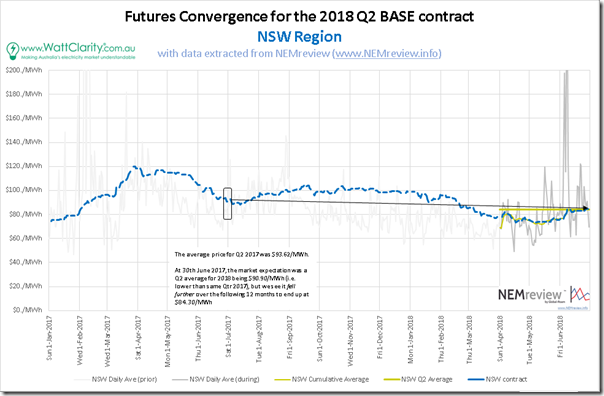
Adding in the futures convergence chart, and we see a story quite similar to the case for Queensland:
At the end of Q2 2017 we saw an actual quarter average price of $93.62/MWh and an expectation that the result the next year would be $90.90/MWh. As was the case with Queensland, the end result was a Q2 2018 price lower (at $84.30/MWh) than the expectation of a year prior.
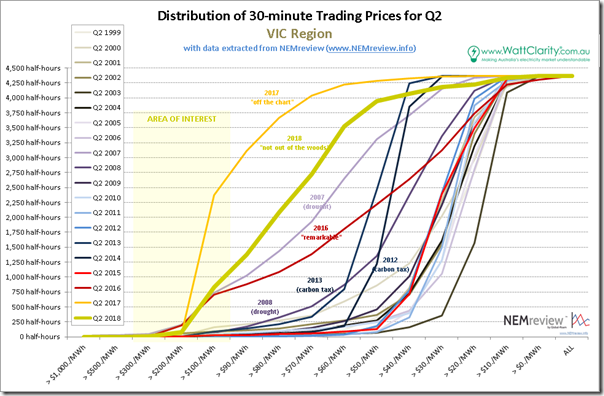
2d) A closer look at Victoria (distribution, and expectations)
Moving into Victoria, we see a similar picture:
In 2016 I highlighted “2007 and 2016 as the standouts” – however those years paled into insignificance to the onslaught of Q2 2017 (where more than half of all half-hours through the quarter saw spot prices greater than $100/MWh). We see that the result for Q2 2018 was a little more moderate – though it does still appear to be the 2nd worst year by most measures.
Not quite as severe as in NSW, we saw 427 half-hours below $50/MWh (i.e. 9.8% of the time) – which was a large improvement on Q2 2017 (83 hours, or only 1.9% of the time), however still a long way from historical norms.
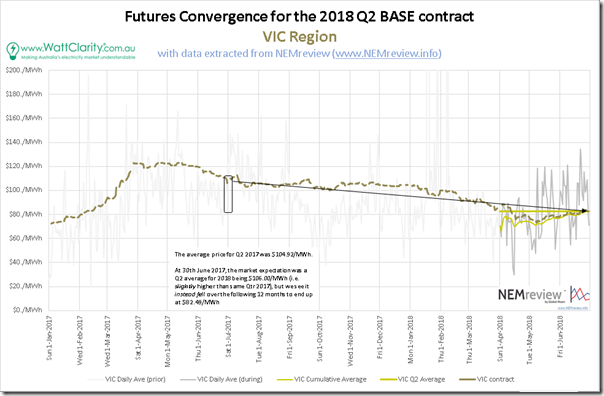
With the futures convergence chart for Victoria, we see that the expectation for Q2 2018 ($106.00/MWh) at the end of Q2 2017 ($104.92/MWh) was actually higher than what the prior quarter ended up being – but the actual result ($82.49/MWh) was significantly lower than that expectation (though still higher than many would wish for it to be).
2e) A closer look at Tasmania (distribution, and expectations)
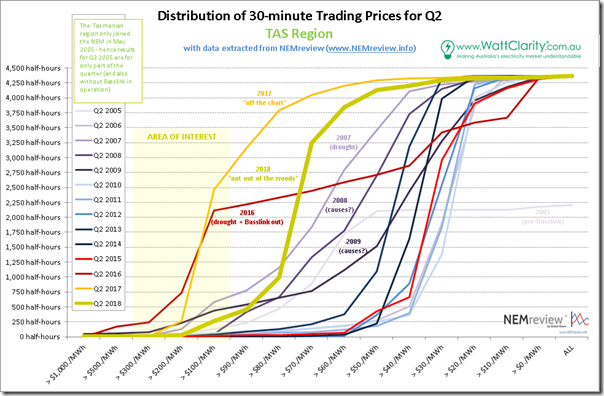
We saw (with the averages above) that Tasmania seemed to have made the most dramatic improvement, at last in terms of average prices. We see in the distribution chart below that the curve has shifted a long way to the right compared with Q2 2017 – however it’s still much further to the left than most other prior years:
In Q2 2017 the incidence of prices under $50/MWh had “completely evaporated” (only 1.6% of the time) – and whilst this has increased threefold in Q2 2018, n frequency of only 5.4% of the time with prices below $50/MWh was considered (at least historically) as nowhere near enough…
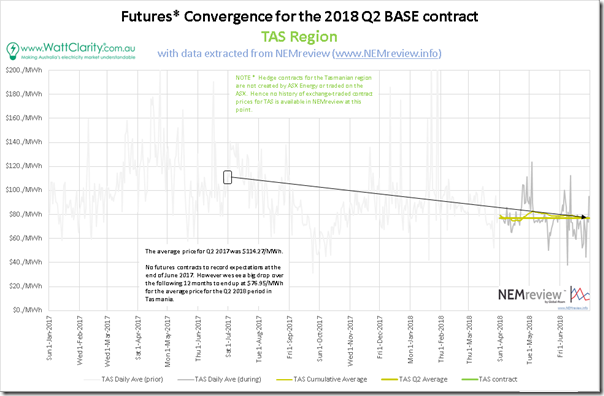
The ASX does not offer hedge contracts for the Tasmanian region, so we do not have visibility of the markets prior expectations for the quarter just passed. However we have noted how the average price from Q2 2017 to Q2 2018 did see a substantial reduction.
2f) A closer look at South Australia (distribution, and expectations)
Finally, we land at South Australia and see a picture for Q2 2018 that is only partially moderated from the “truly horrendous” picture for Q2 2017. In particular, note the very high incidence of prices above $100/MWh:
1. In Q2 2018 it was 1,144 half-hours – or 33% of the time – above $100/MWh) ;
2. This is about half the level of Q2 2017 (with 2,945 half-hours – or 67% of the time – above $100/MWh)
but we need to not lose sight of the fact that a 33% incidence of >$00/MWh prices is still significantly more than any other year (except 2017).
For the other regions we have been comparing instances of prices under $50/MWh – for SA it was only 9.2% of the time in Q2 2018.
Looking at futures convergence we see a similar situation as was the case in Victoria, where:
1) At the end of Q2 2017 (a horrendous period, averaging $115.93/MWh) the expectation then was that Q2 2018 would be worse (futures price trading at $123.90/MWh); but that
2) The actual result ended up significantly lower (at $97.50/MWh) but still way above where most people would like it to be.
2h) Analysis for the SWIS in Western Australia
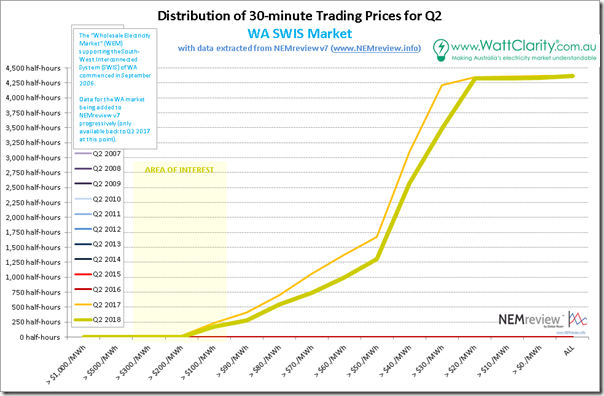
We don’t (currently) have more than 2 years’ worth of price history for the WA market loaded into NEMreview v7, so the following chart for WA is included for completeness apart from anything else:
Interestingly, we see that half-hour prices in the WEM were below $50/MWh for a massive 70% of the time during Q2 2018 (or 3,061 half-hours). That’s up from the high level of Q2 2017 (at 2,693 half hours or 62% of the time).
However keep in mind the impact that the capacity market will have had on bidding behaviour, and hence price outcomes.
2i) Summing up, for all regions
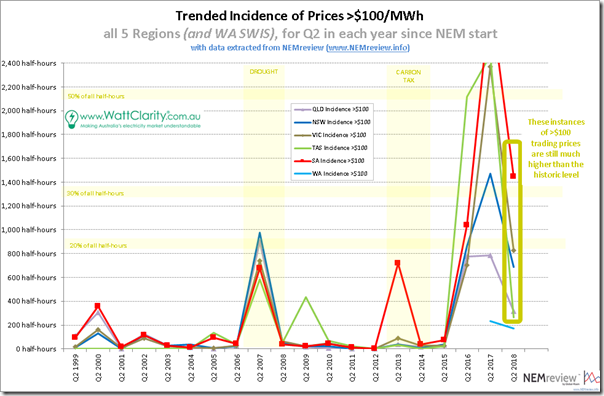
Selecting just the incidence of prices above $100/MWh for each region and trending over time, we see the following summary:
We see again that (quite literally) some instances for Q2 2017 were off the chart (SA, TAS and almost VIC).
These stratospheric levels have subsided somewhat into Q2 2018 – however the levels seen are still far higher than most of the other years on the plot.
In a complex system (such as the NEM) it’s almost certain that, with most events, there are always multiple contributing factors. In other posts here on WattClarity we’ve been delving into some of these – however there’s never enough time to complete all the investigations we’d like to mount….


I suppose all the price pain will be worth it in the long run, we are trying to change the way we supply power, to reduce Co2.