
Summer has only just begun, and the return of hot, cloudy weather has recently put demand-forecasting back in the spotlight. Just two weeks ago, we saw in NSW how unexpected shifts in rooftop PV generation can quickly cascade into pricing and operational surprises.
In this short article, we take a closer look at the accuracy of the AEMO’s demand forecasts during daily peaks to have another view into how these trends have been manifesting over the long-term.
Background about rooftop PV impact on demand forecasting
In recent years here on WattClarity we’ve been writing about the accuracy of AEMO’s short-term demand forecasts — and how limited visibility of this behind-the-meter rooftop PV generation makes that task considerably more difficult.
This effect is arguably best illustrated in the Queensland region, because:
- Rooftop PV uptake in the state has continued to expand. While it’s difficult to pin down a definitive capacity figure, AEMO’s small-solar output data (show in the chart below) implies installed capacity is now somewhere above 5 GW.
- Queensland’s sub-tropical and tropical climate makes it especially prone to high peaks in electricity consumption during hot and humid summer days — precisely the season where solar conditions are otherwise assumed to be most favourable.
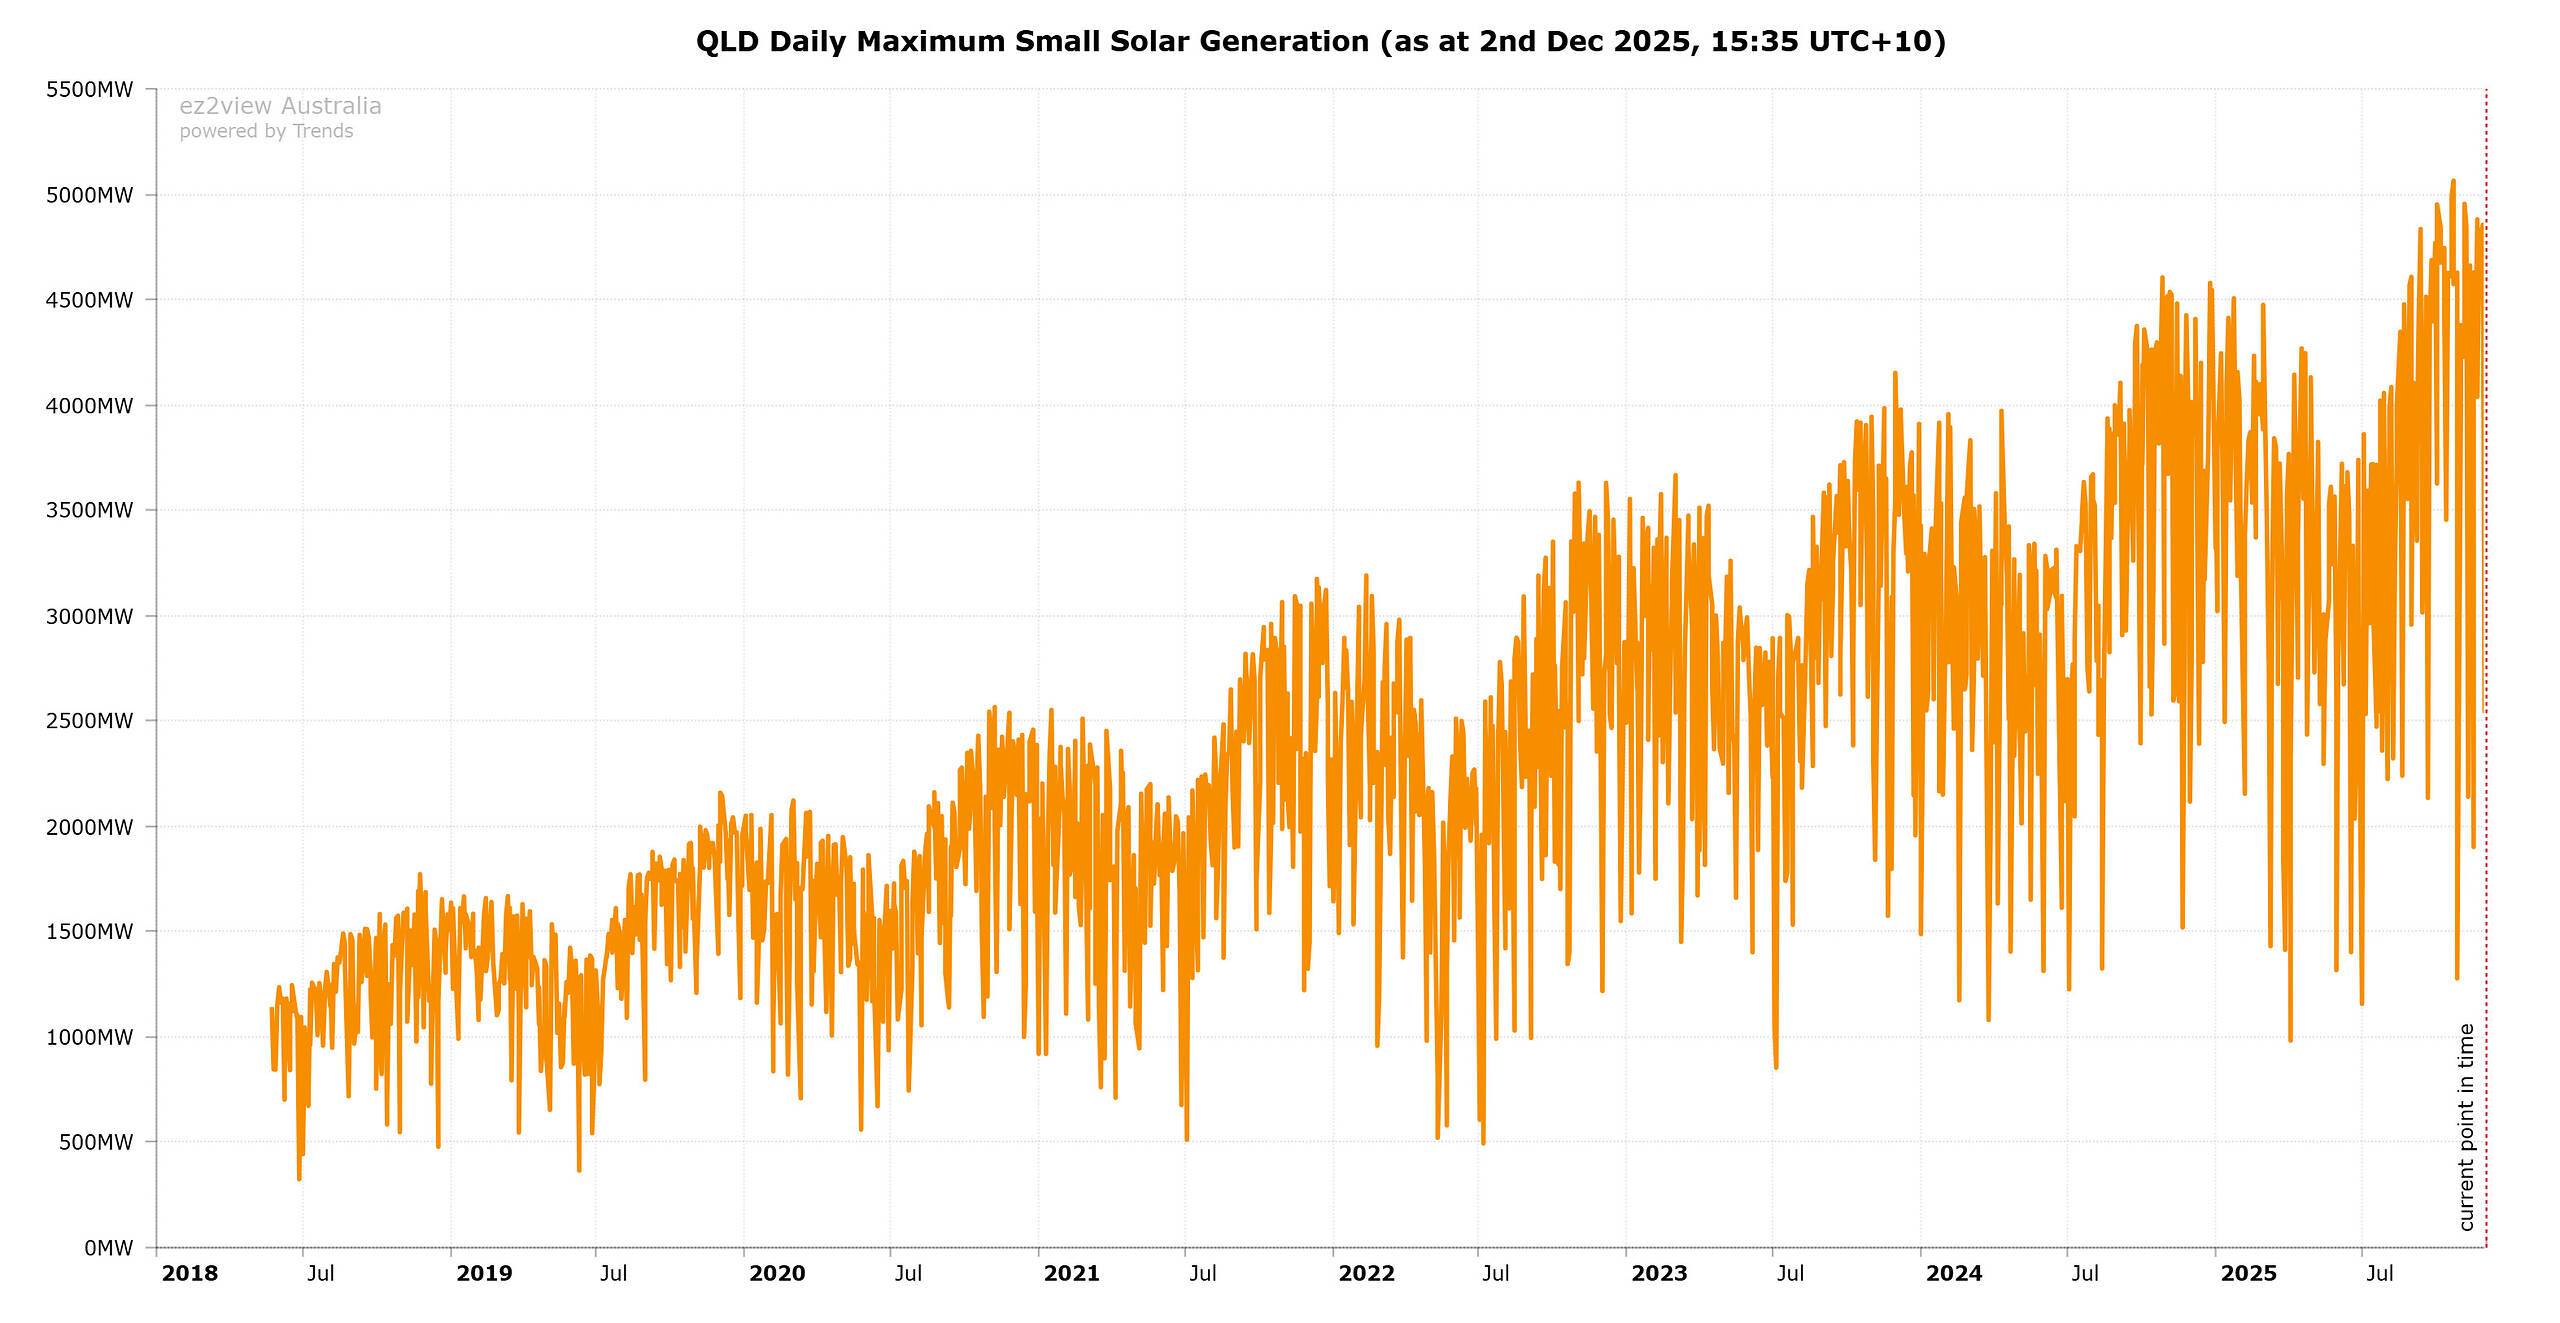
Based on the AEMO’s small solar generation estimates, QLD maximum output of this behind-the-meter generation has grown fairly linearly from ~1.5 GW in 2018 to ~5 GW in 2025.
Source: AEMO, ez2view’s Trend Editor
As we’ve previously highlighted (including in this conference paper I recently published using January 22nd, 2024 as a case study), the combination of these two factors has important implications for short-term demand forecasting as underlying air-conditioning load is partially masked by behind-the-meter rooftop PV. This makes demand forecasts on hot summer days acutely sensitive to unexpected cloud movements.
While our recent articles have focused on demand forecasting more broadly, one reader suggested to us that we take a closer look at forecast errors specifically during daily peak demand.
The daily peak for demand in Queensland generally occurs between 5:30 pm and 6:30 pm (i.e. just before, during, or just after sunset) during summer. The ‘invisible’ nature of rooftop PV can impact this section of the duck curve as (1) a sudden drop in behind-the-meter output can bring this peak forward (as we saw in the aforementioned case study), or (2) it can materially change the diurnal shape of net demand — which can throw off forecast models that may be calibrated to historical statistical patterns and expected demand curves.
What does the long-term trend in demand forecasting performance show?
To investigate this specific angle, we’ve conducted a small piece of analysis to see how AEMO’s P30 pre-dispatch forecasts performed at each daily peak over the past seven summers.
Methodology
This analysis focuses on the AEMO’s 3-hour-ahead market demand forecasts for each ‘daily peak’ of demand in Queensland across seven summers (2018–19 to 2024–25). We’ve chosen the 3-hour time horizon as it is the last point at which the RERT mechanism can be activated. Although we’re looking at P30 forecasts, some readers would be aware that the AEMO uses the less-proximate STPASA forecasts within the RERT mechanism.
For the purposes of this analysis we’ve defined summer as December 1st 00:00 to March 1st 00:00. For each calendar day, we identify the actual highest-demand trading interval (i.e. 30-minute interval) and have paired it with the 3-hour-ahead P30 forecast that was issued for that same interval. The difference between these two values forms the forecast error. Forecast error is calculated as Actual minus Forecast, hence a positive forecast error represents an under-forecast, and vice versa.
The seven successive summer sample size was chosen as:
- We can see results over a range of ElNino/La Nina cycles (which QLD is especially sensitive to).
- We can examine how this coincides with growing Rooftop PV penetration in the region (where capacity looks to have increased from roughly 1 GW to around 4.5 GW over this time)
To understand how forecasting performance changes as Queensland’s demand rises, each day’s peak-demand observation is assigned to a 500 MW bucket (e.g. 7.5 to 8.0 GW, 8.0 to 8.5 GW, and so on). Within each band, the collection of forecast errors provides a distribution of outcomes. These distributions are shown using violin plots, which illustrate not just the average forecast error but also the spread, skew, and presence of outliers.
Forecast accuracy of daily peaks over each summer
In the chart below we show our plots as described above, helping us to look at forecast performance for different daily peaks over the last seven summers in QLD.
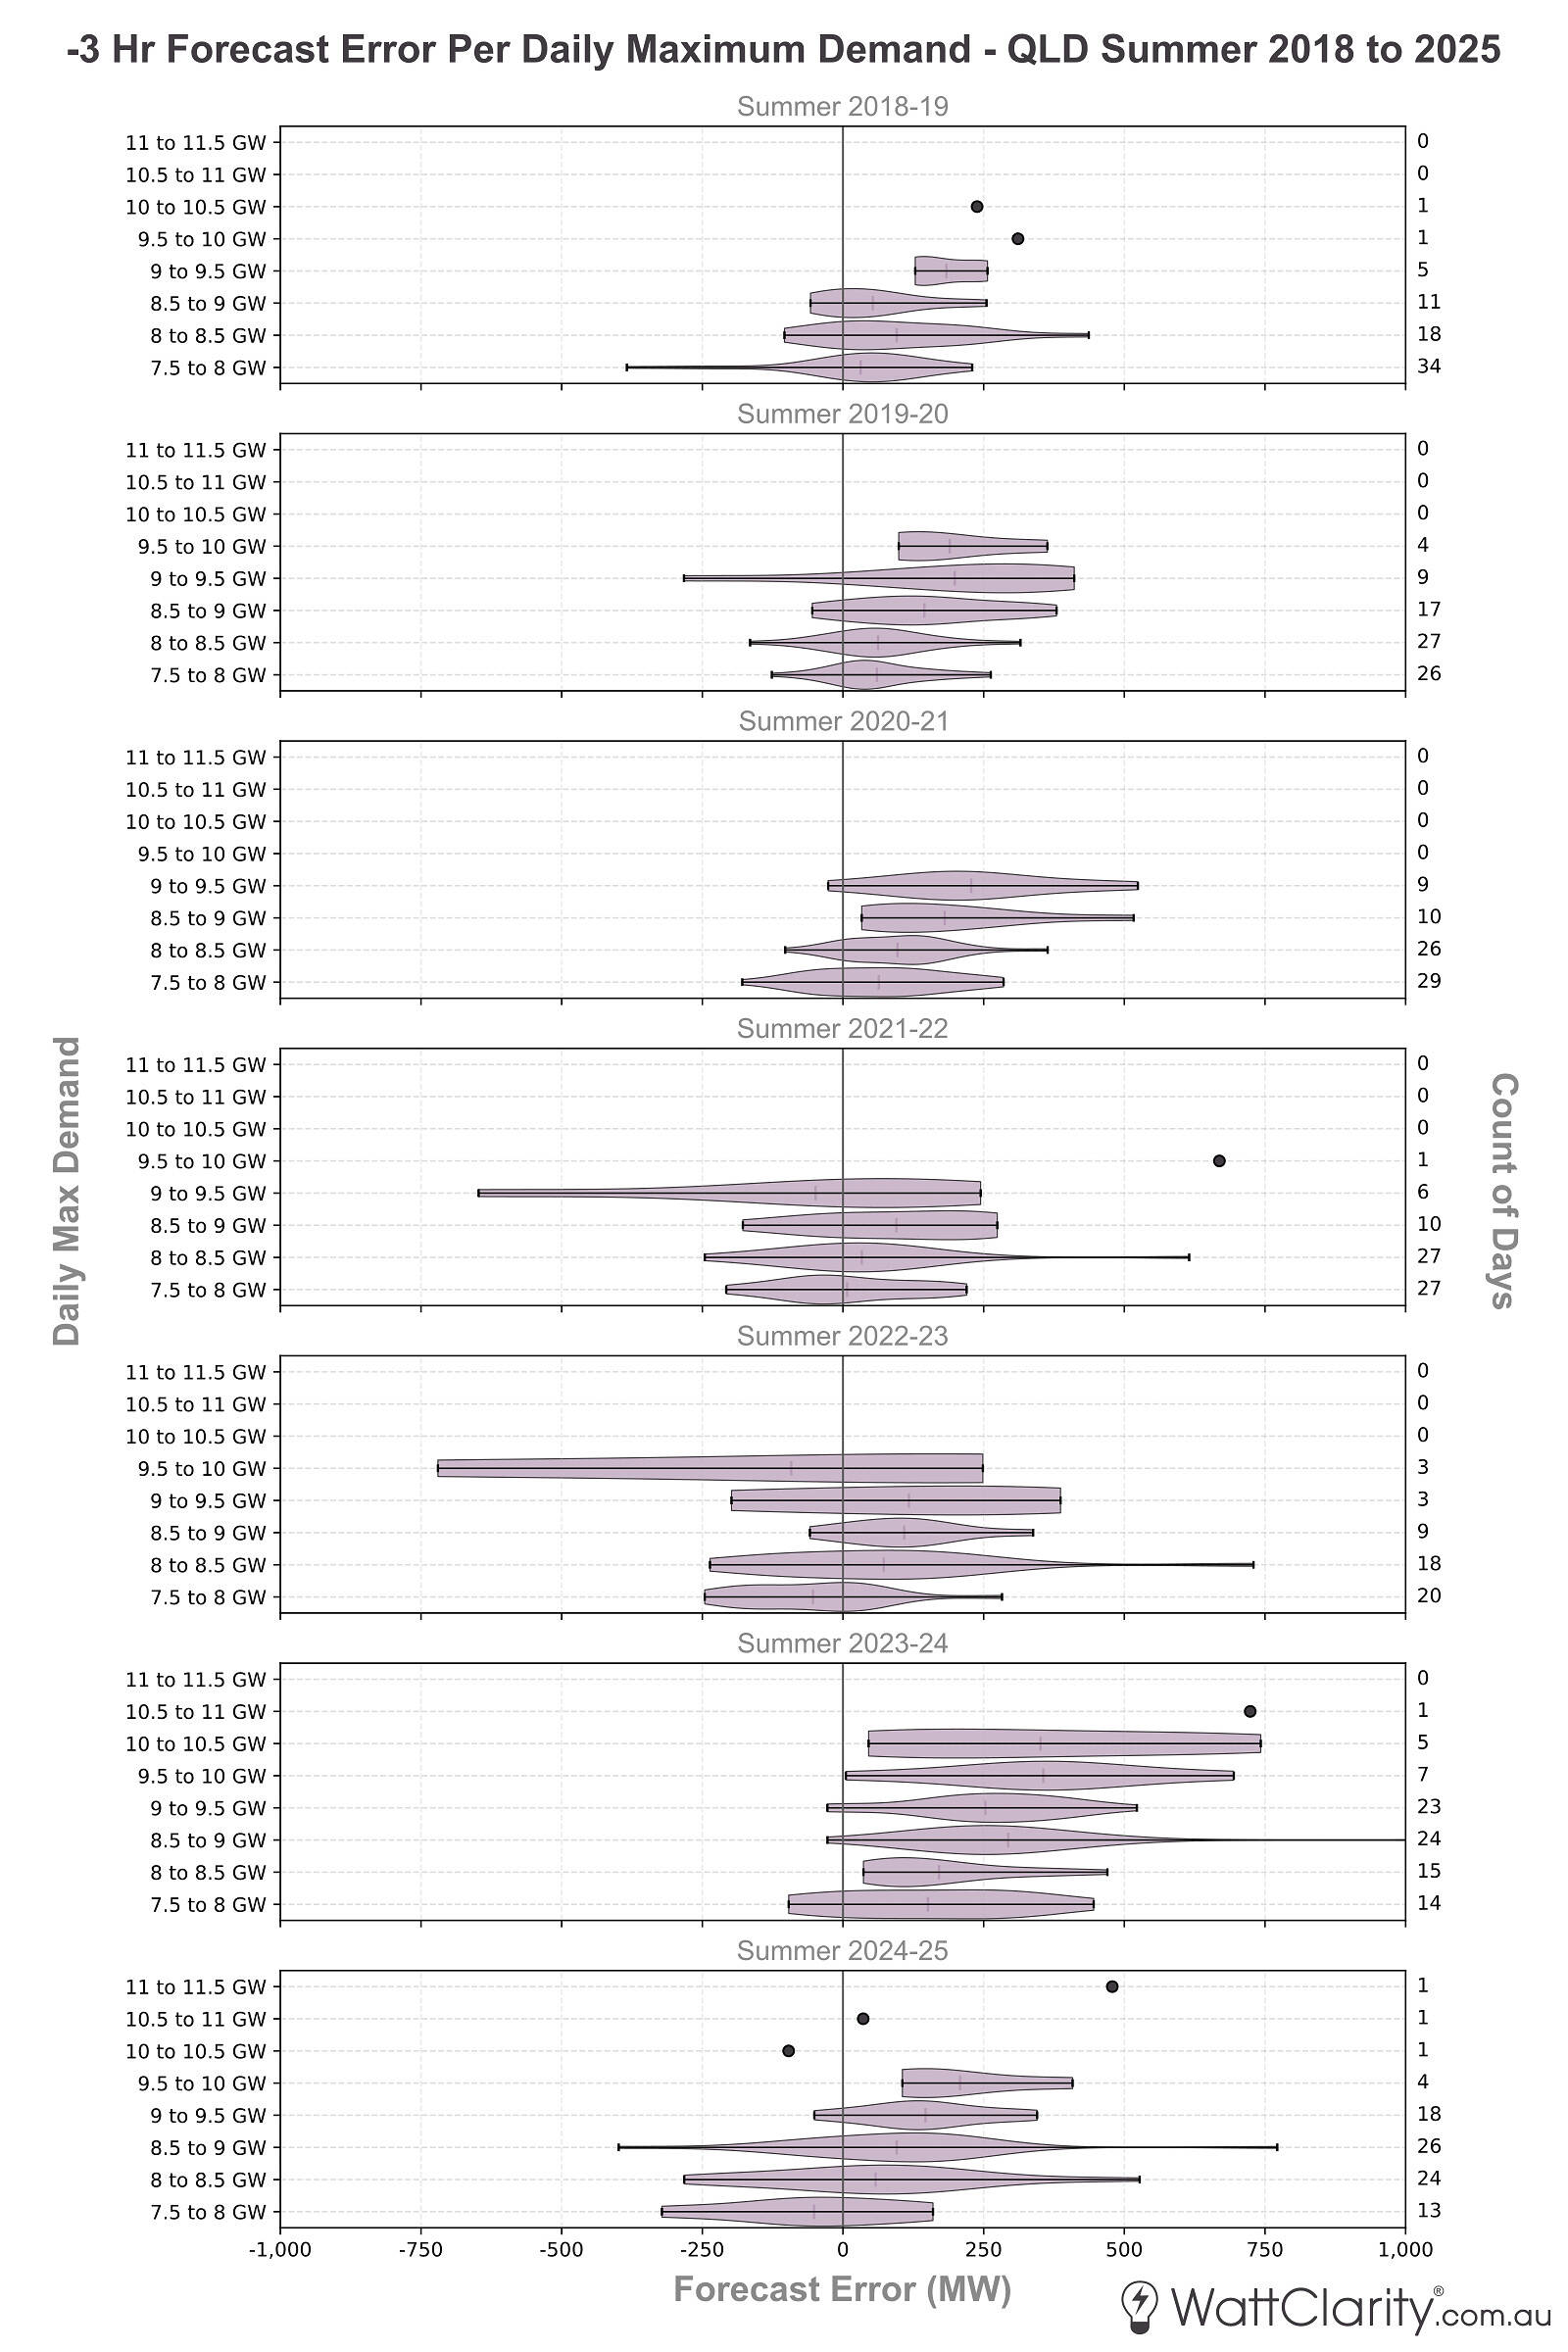
The distribution of seven summers of P30 forecast errors on different daily peak demand bands in QLD (at a t-minus 3 hour time horizon). This highlights that forecast errors are widening at the extremes in recent years.
Note: Days where peak daily demand was below 7.5 GW not shown. Market demand used as the measure of demand.
From the chart above we can observe a number of interesting insights:
- Forecast errors generally grow with higher demand peaks. Across most summers, higher buckets (≥ 9.5 GW) show wider and more positively skewed error distributions, confirming that the AEMO is finding it increasing difficult to forecasting high daily peaks in QLD in recent years.
- Large under-forecast events are the outlier, but a recurring feature across recent summers. Many summers show isolated but substantial positive errors (500 MW+), especially at higher demand levels.
- A pattern of minor, but consistent, under-forecasting appears at moderate demand most summers. In almost all summers there appears to be a slight tendency of under-forecasting in mid-range demand buckets (in the range of 8 to 9 GW).
- The two most recent summers show persistent asymmetry. In summer 2023–24 and 2024–25, most buckets remain skewed toward positive errors.
- Summer 2023-24 was a clear outlier, showing a strong tendency of under-forecasting. Notably, this was the first strong El Nino summer that QLD experienced after four consecutive summers of La Nina or neutral ENSO cycles. To the credit of the AEMO’s operational forecasting team, the following summer displayed some signs of improvement.
Key Takeaways
One of the more notable features to highlight here is the behaviour of the distribution tail. The largest forecast errors tend to occur on the days with highest peaks, suggesting the system is most exposed precisely when it is already under the most stress. In other words, the upper end of our demand distribution is also where forecast uncertainty is most concentrated — implying a correlation between peak demand conditions and the likelihood of under-forecasting. This pattern reinforces the idea that forecasting is not merely hard in general, but specifically harder when the system most needs accuracy.
As rooftop PV uptake continues and weather volatility remains a feature of Queensland summers, these results show that short-term forecasting performance will likely remain an area worth watching rather than something that simply normalises with time.
Be the first to comment on "The long-term trend of forecast errors for daily peak demand in QLD over the past seven summers"