
On Wednesday I came across a RenewEconomy article about renewable curtailment that sparked a significant amount of online discussion, stating that a total of 4.5 TWh of energy was curtailed in the NEM in 2024.
In response to these related discussions, regular WattClarity contributor Allan O’Neil was quick to provide more context about the long-term trend and how this compares to energy production, to prevent others from making conclusions based on headline figures.
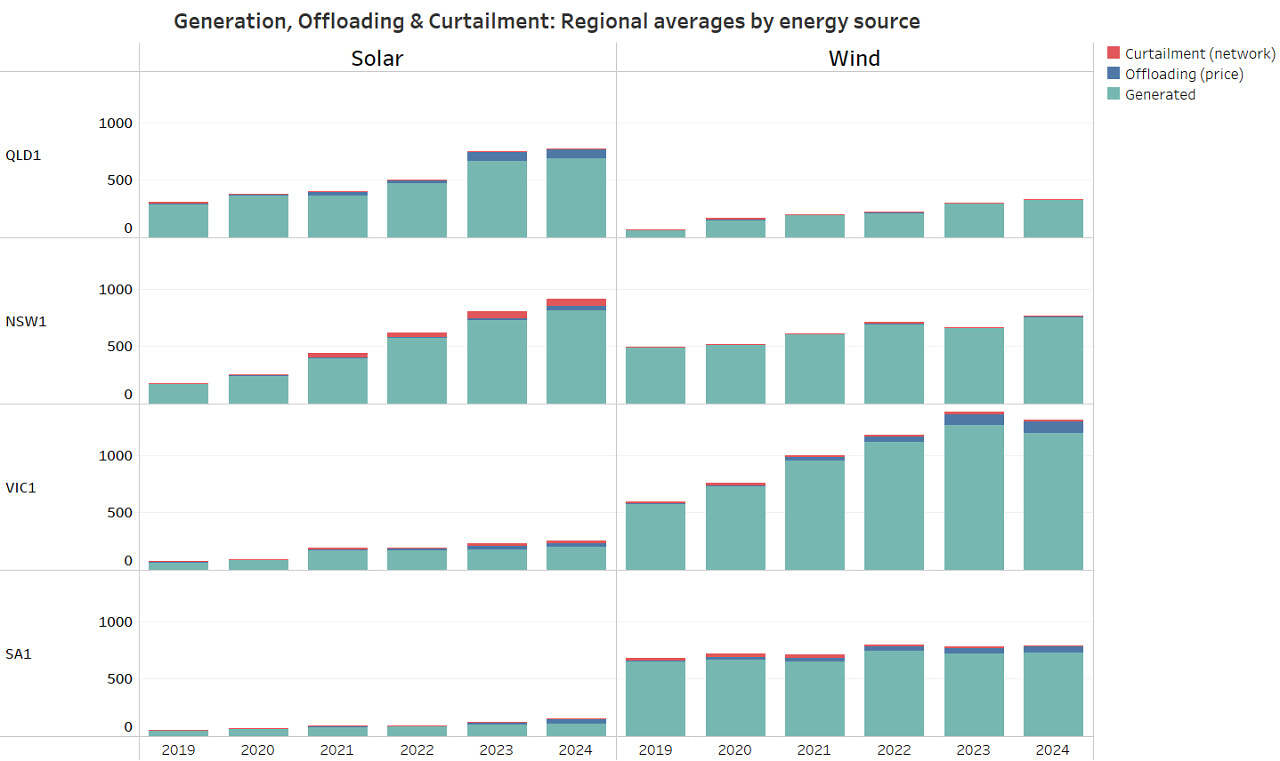
The six-year trend of average MWh network curtailment (red), economic curtailment (blue) and energy production (teal).
*Note economic curtailment is also referred to as ‘offloaded energy’.
Source: Allan O’Neil
The timing of those discussions coincided with the release of the latest edition of our Generator Statistical Digest (GSD) report. The report contains 1,330 pages worth of calculated and summarised performance statistics for each unit in the NEM over the last calendar year. Fortunately for my purposes here, this includes detailed unit curtailment data.
In this article, I’ll be utilising the curtailment data from the GSD in order to provide some further context about recent Variable Renewable Energy (VRE) performance in the NEM. This follows on from a similar analysis series that I published one year ago – Part 1 here and Part 2 here.
Measuring curtailment
As I’ve done in the past, this analysis focuses on four key metrics, which I’ve selected because they help us understand different proportions of energy, in relation to capacity utilisation:
- Capacity Factor – The ratio of energy actually produced, relative to maximum generating capacity over time.
- Network Curtailment Factor – The ratio of energy ‘spilled’ due to network or other constraints (e.g. thermal limits on transmission lines, system strength constraints, etc.), relative to maximum generating capacity, over time.
- Economic Curtailment Factor – The amount of energy ‘spilled’ due to pricing/bidding effects, relative to maximum generating capacity, over time.
- Unavailability Factor – The remaining portion of energy not produced or spilled (therefore unavailable), relative to maximum generating capacity, over time.
This approach differs from some other sources that report curtailment figures either in absolute terms, or in relation to total availability.
Seasonal Breakdown
To begin, we will look at the month-by-month figures for aggregated curtailment amongst the NEM’s semi-scheduled large solar and wind fleet. While data aggregated at this level does not provide detailed insights into specific cases or underlying drivers, it does help us identify seasonal patterns in solar and wind yields.
Large Solar
Solar production and curtailment tends to follow a predictable annual shape, illustrated in the chart below. Less daylight hours in winter results in a slow mid-year dip for production, and increased curtailment generally occurs during spring as mild temperatures across Australia often dampen demand for electricity.
From a glance at the data, I’ll share a few high-level observations about overall performance:
- For the solar fleet as a whole, there was no significant change compared to the previous year in terms of aggregate capacity factor (21.55% for 2024 calendar year compared to 21.4% for 2023 calendar year), network curtailment factor (1.17% in 2024, compared to 1.17% in 2023) and economic curtailment factor (2.23% in 2024, compared to 1.94% in 2023)
- Production was up (and curtailment was slightly down) both in relative and absolute terms between April and June compared to the previous year, with an additional 227.2 GWh of energy produced in those months – this effect is likely to be somewhat related to low levels of competing wind production.
- As we noted at the time, there was higher than usual curtailment amongst the solar fleet in August. The aggregate economic curtailment factor increased by 0.52% compared to August 2023 – representing an additional 39.6 GWh of spilled energy for economic reasons.
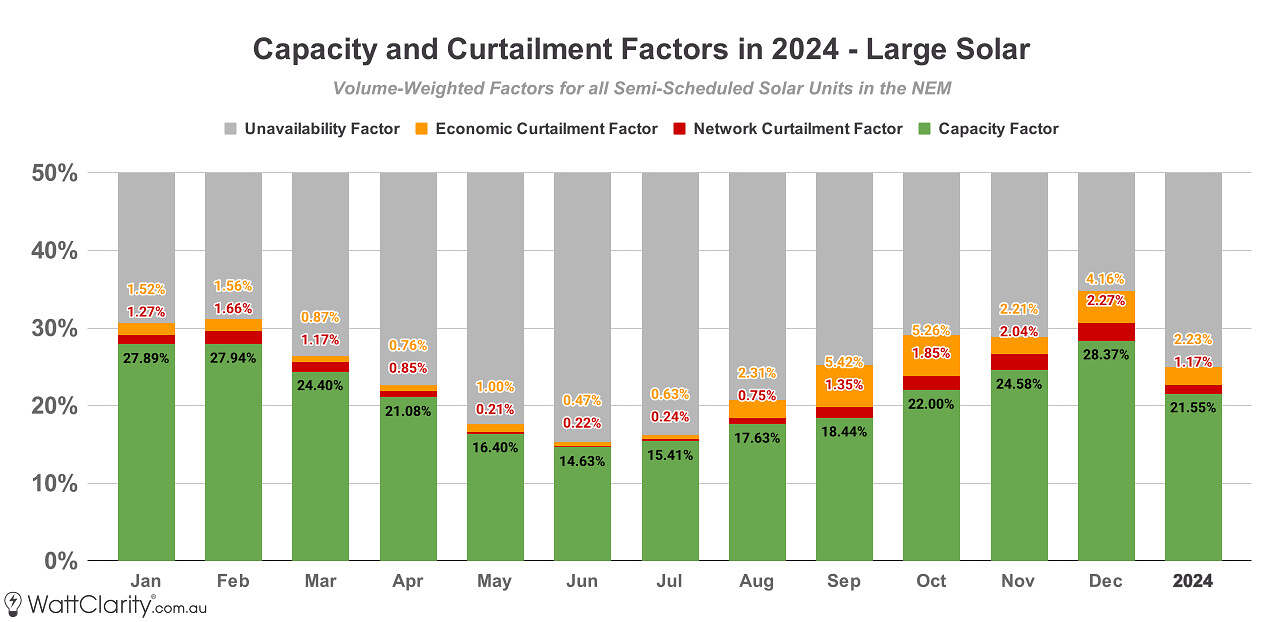
Large solar production and curtailment followed a very similar pattern in 2024 to 2023.
Note: Y-axis is capped at 50%, this has been done to zoom in on curtailment figures. Semi-Scheduled units only.
Source: GSD2024 Data Extract
Wind
Wind generation in the NEM had a turbulent year in 2024, characterised by a significant three-month wind drought which dampened wind speeds across the southern half of the country between April and June:
- The wind drought led to a notable dip in fleet-wide aggregate capacity factor (27.70% for 2024 calendar year compared to 29.99% for 2023 calendar year), a slightly lower aggregate network curtailment factor (0.33% in 2024, compared to 0.52% in 2023), but a slightly higher economic curtailment factor (1.63% in 2024, compared to 1.47% in 2023).
- There was an 11.02% difference in capacity factor (which represents a difference of 903.6 GWh in production) for the NEM’s wind fleet just between the months of June and July – visible in the chart below.
- Comparing the 2024 results to my analysis for the 2023 calendar year, we can see a 229.2 GWh decrease in production (and a 16.64% decrease in capacity factor) in June 2024 compared to June 2023, despite aggregate wind capacity increasing by 3.35% over that time.
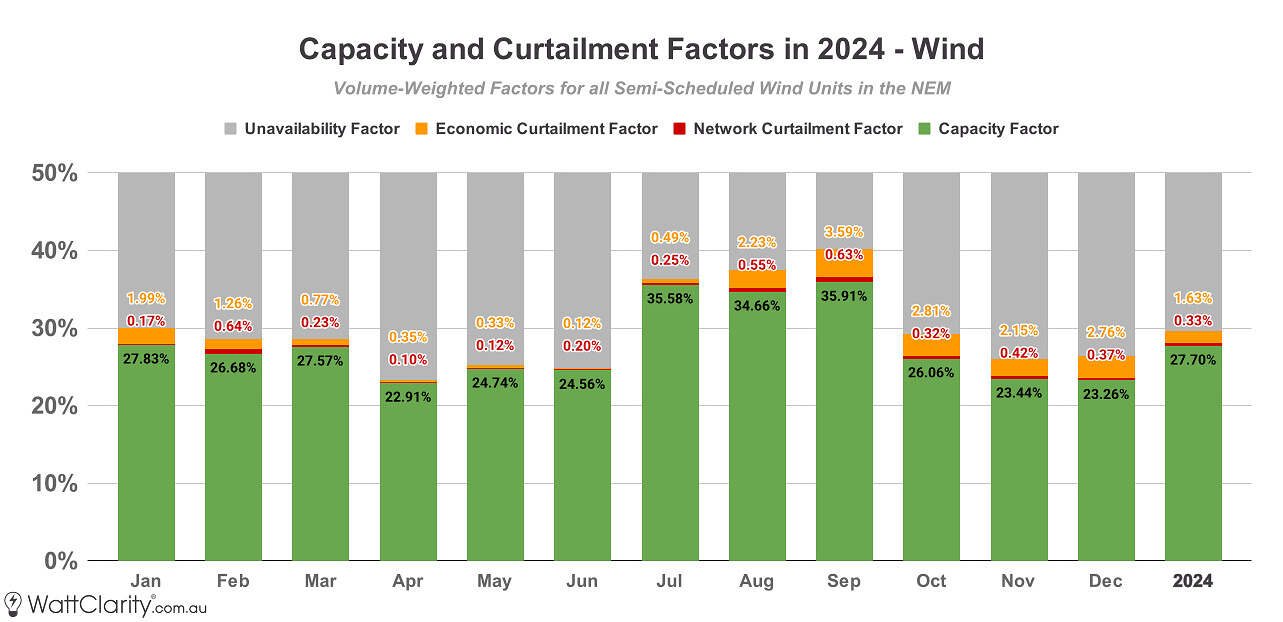
The wind drought that occurred between April and June resulted in a diminished and seasonally-different yield for wind generation, compared to previous years.
Note: Y-axis is capped at 50%, this has been done to zoom in on curtailment figures. Semi-Scheduled units shown only.
Source: GSD2024 Data Extract
Combined Large Solar and Wind
For further context, the chart below shows the combined view aggregating the underlying data for both large solar and wind.
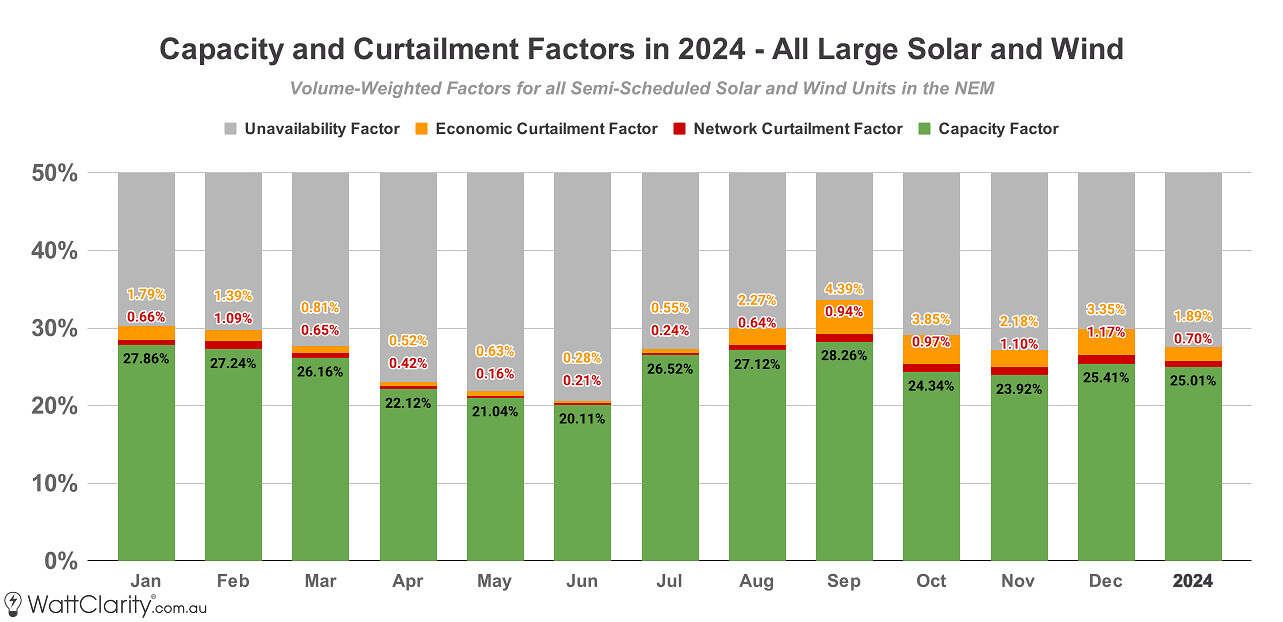
Q2 continues to be the most challenging part of the year for aggregate VRE production, whilst Q3 and Q4 continues to see the highest levels of curtailment.
Note: Y-axis is capped at 50%, this has been done to zoom in on curtailment figures. Semi-Scheduled units shown only.
Source: GSD2024 Data Extract
Locational Breakdown
To get an idea of the spatial spread of curtailment, in the image below I’ve mapped the individual factors for each solar and wind unit across the NEM. The size of the icons on the map are scaled to the unit’s network/economic curtailment factor.
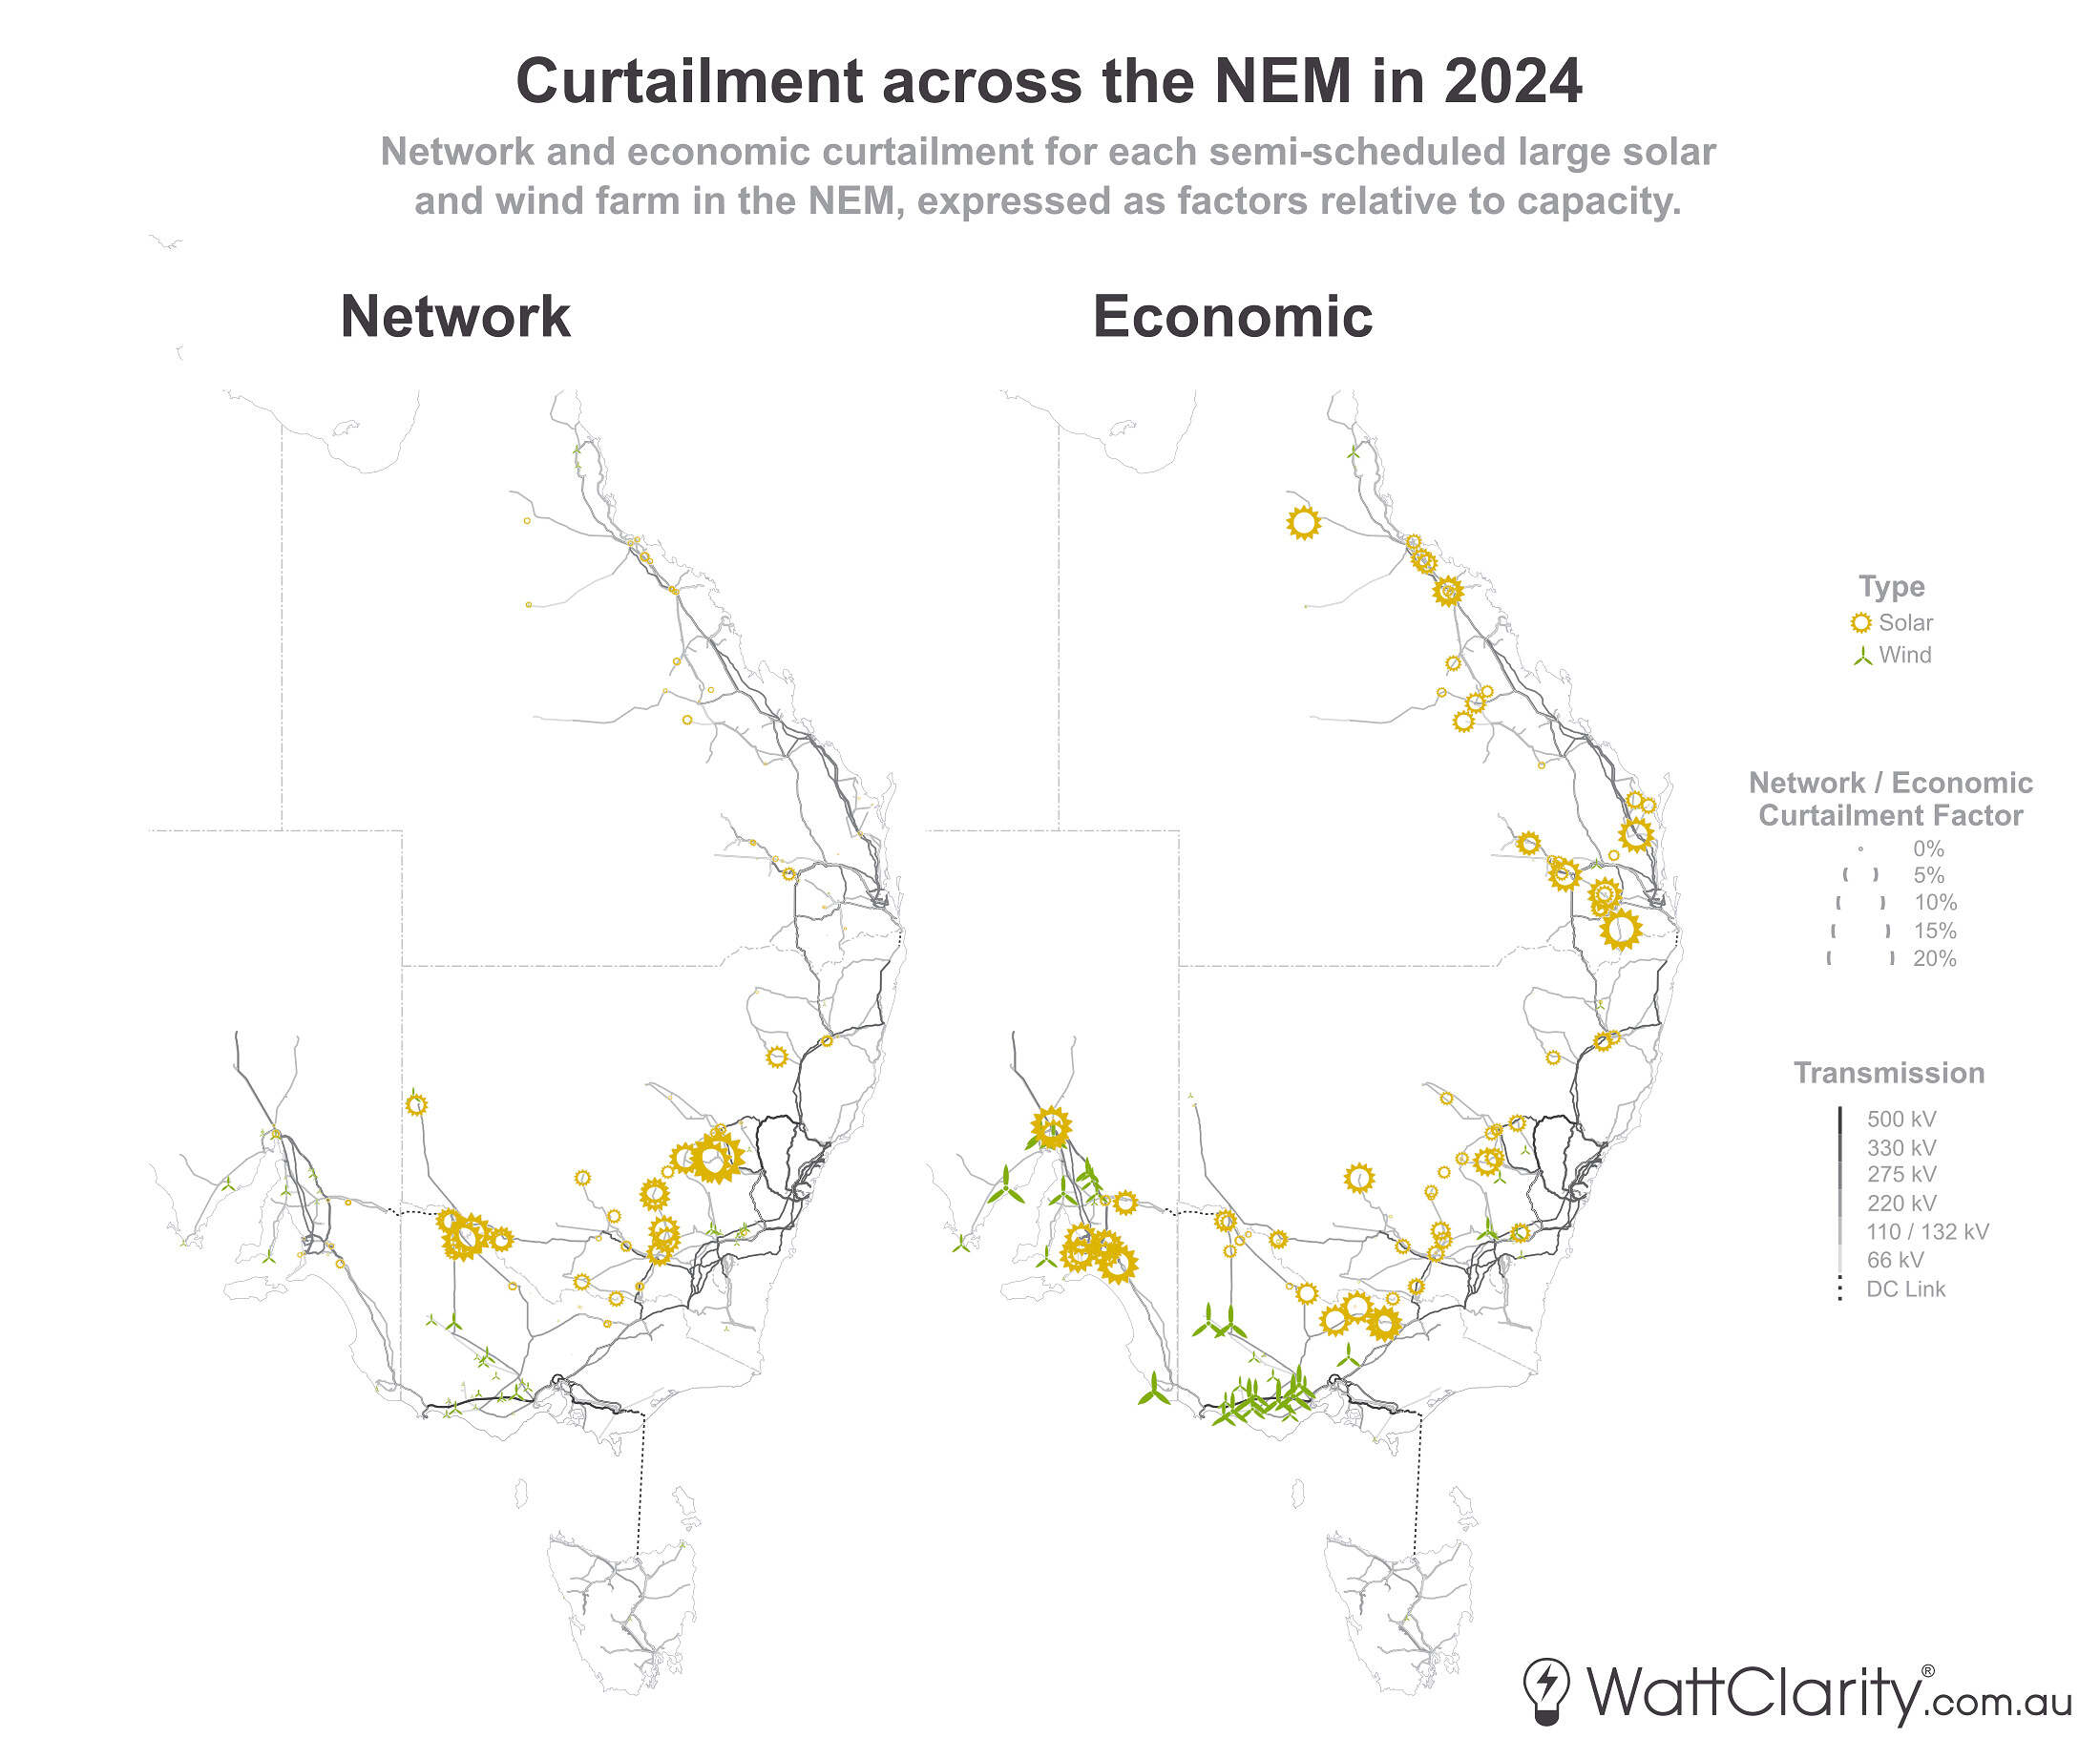 Network curtailment appears to be somewhat confined to two subsections of the grid, whilst economic curtailment is seemingly more universal.
Click here for a higher-resolution image.
Note: Semi-scheduled units only.
Source: GSD2024 Data Extract
As we’ve seen in recent years, network curtailment continues to affect a number of solar farms located on the 132kV section of Central New South Wales and on the 220kV section of North-West Victoria, whilst economic curtailment was more widely spread across the market.
Relative to their capacity, the three most network-curtailed units in the NEM were Molong Solar Farm (14.17%), Wemen Solar Farm (8.87%) and Bannerton Solar Farm (8.78%). The units facing the greatest amount of economic curtailment were Warwick 1 Solar Farm (9.02%), Bungala One Solar Farm (8.41%) and Tailem Bend Solar Farm (8.41%).
The table below shows the units with the biggest year-on-year change in network and economic curtailment factors between 2023 and 2024.
| Network Curtailment | |||
| Unit (DUID) | 2023 Network Curtailment (Factor) | 2024 Network Curtailment (Factor) | % Change in Factor |
| Wemen Solar Farm (WEMENSF1) | 49,642 MWh (6.45%) | 68,455 MWh (8.87%) | +2.42% |
| Sebastpool Solar Farm (SEBSF1) | 23,618 MWh (3.00%) | 38,489 MWh (4.87%) | +1.87% |
| Wagga North Solar Farm (WAGGNSF1) | 8,196 MWh (1.95%) | 14,757 MWh (3.51%) | +1.56% |
| Willogoleche Wind Farm (WGWF1) | 29,318 MWh (2.82%) | 5,579 MWh (0.53%) | -2.29% |
| Mt Millar Wind Farm (MTMILLAR) | 18,257 MWh (2.98%) | 6,792 MWh (1.11%) | -1.87% |
| Yatpool Solar Farm (YATSF1) | 35,631 MWh (5.07%) | 6,792 MWh (3.26%) | -1.81% |
| Economic Curtailment | |||
| Unit (DUID) | 2023 Economic Curtailment (Factor) | 2024 Economic Curtailment (Factor) | % Change in Factor |
| Mt Millar Wind Farm (MTMILLAR) | 15,722 MWh (2.57%) | 46,420 MWh (7.56%) | +4.99% |
| Mt Mercer Wind Farm (MERCER01) | 30,858 MWh (2.69%) | 79,017 MWh (6.88%) | +4.19% |
| Kidston Solar Project (KSP1) | 8,462 MWh (2.06%) | 24,602 MWh (5.96%) | +3.9% |
| Clare Solar Farm (CLARESF1) | 76,990 MWh (8.79%) | 22,543 MWh (2.56%) | -6.23% |
| Numurkah Solar Farm (NUMURSF1) | 91,438 MWh (10.44%) | 48,196 MWh (5.49%) | -4.95% |
| Emerald Solar Farm (EMERASF1) | 47,480 MWh (7.53%) | 16,596 MWh (2.62%) | -4.91% |
The three biggest movers in each direction regarding network and economic curtailment factors, between 2023 and 2024.
*Semi-scheduled units only. Units commissioned in 2023 or 2024 have been excluded from this table.
Source: GSD2024 Data Extract
Without further in-depth analysis or an understanding of commercial arrangements, it’s difficult to pinpoint the drivers behind these year-on-year changes, but they are likely influenced by a mix of shifting market dynamics, adjustment to operational or bidding strategy, among other factors.
‘Fixing’ Curtailment?
It’s important to understand that economic and network curtailment are not entirely independent of each other, and hence we should be cautious about prescribing a ‘fix’ – e.g. shutting down Eraring, building more batteries, building more transmission, etc.
Since the NEM has a zonal pricing model, with five distinct pricing regions connected by intricate inter-regional transmission paths – it could be argued that some amount of economic curtailment could be seen as a symptom of inadequate interconnector capacity.
More importantly, economic curtailment is (at least conceptually) a measure of how many megawatt-hours were bid below eventuating spot prices – but the biggest driver of spot prices is often network constraints.
Since re-creating the dispatch process and rerunning it with different inputs is practically impossible – even with the advent of ChatGPT and DeepSeek – fully quantifying the overlap between these effects remains challenging.
Key Takeaways
Curtailment is a natural and sometimes even sensible outcome in any highly renewable grid. That’s one of the realities of trying to match two uncontrolled variables (solar and wind) against a third uncontrolled variable (demand) on an ongoing basis, and through a large electricity network with several types of physical constraints.
Depending on your perspective, extreme cases of curtailment may signal an opportunity for storage, an opportunity for flexible demand, or simply past missteps by developers. In any case, we’ve seen that both seasonal and locational challenges must be addressed to effectively utilise VRE.
—
Further Reading
The data contained in this analysis has been taken from our GSD2024 data extract, released yesterday. The curtailment data is only a small section of what’s inside the report – we summarise operational and financial performance metrics to gain an overview of spot revenue, constraint impacts, bidding strategy, FCAS costs, etc. for each operating unit in the NEM. The GSD2024 is available to purchase using this order form here.

The profile for Moree Solar Farm from our GSD2024 – showing a ten year summary between 2015 to 2024 on the left page, and a one year summary of 2024 on the right page.
Click here for a higher-resolution image.
Source: GSD2024
Leave a comment