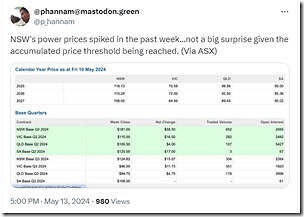
A journalist had called up yesterday to ask questions about what had happened on Wednesday 8th May 2024 in NSW, and I had explained what we’ve already written about (with respect to the physical market) in prior articles on WattClarity … and also commented that, though I had not checked, I would have expected
Later that day, I’d seen that a different journalist (Peter Hannam at the Guardian) had tweeted about the same thing:
During the day on 8th May (i.e. before the Cumulative Price hit the CPT) I’d written ‘More considerations, about the possible extension of Eraring Power Station’, and had included a trend from NEMreview v7 to show how the rumours of an extension to Eraring had coincided with, and probably contributed to, a drop in traded prices for baseload futures contracts in NSW.
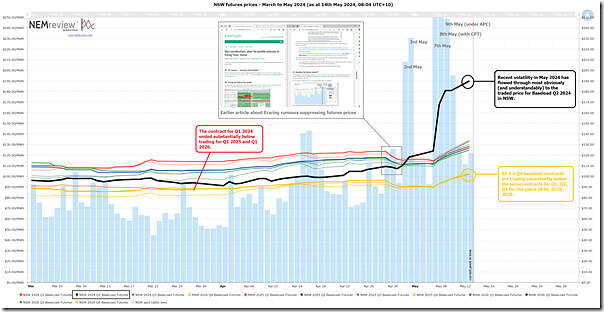
Given the above I thought I would repurpose that same query to produce this updated trend of spot and contract prices in NSW over the past couple months:
Remember that this with a licence to the software can open their own copy of this query here.
With respect to this chart, we can see a number of things:
1) The thick black line shows the trended end-of-day price for NSW 2024 Q2 baseload (i.e. the current quarter) … and in this we clearly see the price jumping up with each burst of spot price volatility …
(a) Which is indicated in the time-weighted (i.e. ‘base load’) average price for each day in NSW in bars at the back
(b) Particularly we see …
i. smallish steps up following brief burst of volatility on Thursday 2nd May and Friday 3rd May evenings;
ii. A much bigger jump following Tuesday 7th May and Wednesday 8th May (the day the CPT was reached); and
iii. Even some movement upwards after that point (noting that Thursday 9th May saw a TW average spot price for the day of $249/MWh, despite Administered Pricing being in place … remember the price cap is now $600/MWh not $300/MWh)
(c) This is understandable, given the direct linkage.
2) We also see that all the contracts pertaining to future quarter periods also increasing:
(a) Not by the same amount as for 2024 Q2 – but these all quite similar in gradient for the future quarters;
(b) That’s for 10 different contracts (i.e. 2024 Q3 through until 2026 Q4);
(c) Which is another illustration that these types of hedge contracts trade (at least partly) on sentiment (or, stating another way, the volatility in May 2024 has reminded traders that volatility can happen, and led at least some to modify their view on what it might mean in future quarters).
3) So it’s not too much of a stretch to wonder how (and when) this might flow through to retail contract prices.
That’s all for now…


Leave a comment