Hot on the heels of yesterday’s price spike at 13:10 in QLD (and several DIs in NSW) – and a smaller excursion to $3,500/MWh in the 18:35 dispatch interval on Sunday 15th which did not get its own article – the price spiked in QLD again today coincidentally at 13:10.
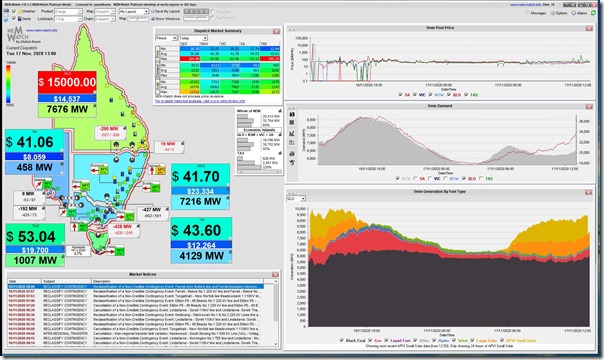
Here’s a snapshot from the NEMwatch v10 entry-level dashboard marking the broader lay-of-the-land:
As noted yesterday, you need our higher-end dashboard product (ez2view) to understand more of what’s happening in the market
… and ideally you’d wait until ‘next day’ when AEMO publishes a much larger ‘Next Day Public’ dataset that helps to identify things like ‘who bid what?’ and gives us a chance at guessing why.
… but (self-evidently) I can’t wait on this occasion either.
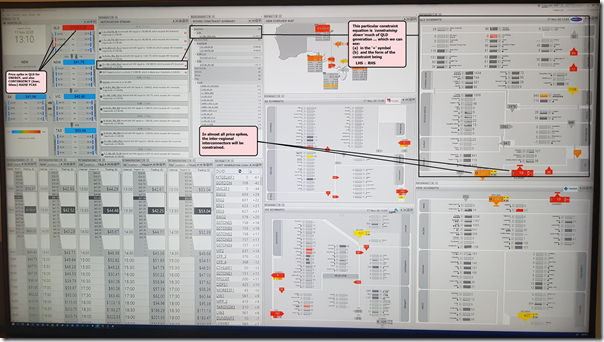
Here’s the view of what I could see of the broader market in the 13:10 dispatch interval:
(click on these images for a larger view)
A big thanks to those who provided comments on yesterday’s article (both online and offline).
For other readers, it’s probably worth re-iterating that this articles on WattClarity are not intended to be read as comprehensive, in terms of everything that contributed to a spike, but moreso:
1) some factors that were apparent at the time and/or
2) that we found interesting or
3) had some other reason to comment about.
… The NEM is a complex place, and there are almost always multiple factors at work in producing any outcome.
The limited nature of these articles is especially the case with these ‘on the day’ articles:
1) that don’t have the benefit of the ‘Next Day Public’ data –
2) and which are also quite susceptible to busyness on the day.
… Where events are particularly interesting (or a pattern later emerges, or for other reasons) we sometimes have time to come back later and investigate more, in which case having a contemporaneous record to refer to is useful.
With that in mind, please read on.
Factor 1 = Many units ‘constrained down’
I’ve highlighted in the ez2view image above a particular constraint equation ‘Q>>NIL_CLWU_RGLC’ which was ‘constraining down’ the majority of the units across the QLD region. This particular constraint operates as ‘System Normal’ (i.e. always invoked) to ‘avoid O/L Raglan to Larcom Creek (8875) on trip of Calvale to Wurdong (871) line’.
When I have more time, will flesh out this page explaining Constraint Equations in the evolving Glossary on this site.
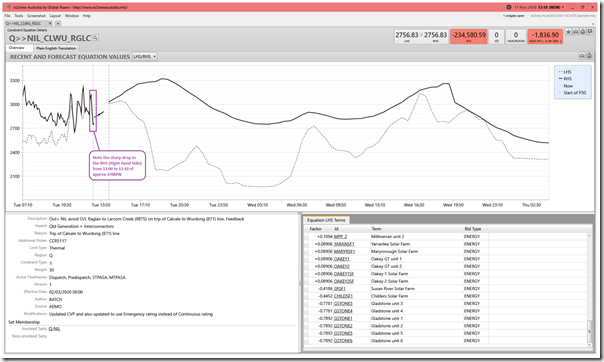
Given time constraints today, all I have time to do is load this ‘Constraint Details’ widget from ez2view, pointed at 13:10 via Time-Travel, to highlight the sharp drop in the RHS from 13:00 to 13:10:
This drop:
1) calculates as a drop of approximately 370MW on the RHS;
2) was matched with a large collective reduction of output from all of the units on the LHS with a positive factor (see them all in the
(a) The actual size of the MW reduction in output I’ve not included here, but note it will be different to (and probably larger than) the 370MW reduction in the RHS … because of the Factors that apply to each DUID (which are less than 1.0).
(b) Collectively, this reduction in output will have been one of the reasons why the price spiked.
(c) We can see on the larger image above that the only units ‘constrained up’ by this constraint were at Gladstone coal-fired power station and the Susan River and Childers Solar Farms.
Possible Factor 2 = who bid what?
If I have time in the subsequent days (which I probably won’t) it would be of interest to review today’s bids, when they are public, in order to see how different portfolios responded … and whether:
1) proactively ahead of time (i.e. did they see the constraint coming) or
2) reactively after the price spike (hence leading to the negative prices in the remains of the trading period).


Leave a comment