
Two weeks ago on Tuesday the 21st of May, the AEMO released an update to the latest Electricity Statement of Opportunities (ESOO) – a document that intends to inform planning and decision-making for new investment in the NEM. But in perhaps a sign of the times, 48 hours later the report and its modeling became partially outdated with the announcement of an extension to the was-soon-to-be-retired Eraring Power Station, the largest station in the NEM.
The updated document superseded the original report released 9 months prior, and highlighted significant delays to major projects whilst simultaneously reporting the inclusion of 4.6 GW of sufficiently advanced projects over a longer time horizon.
–
In the 1942 Looney Tunes short ‘Who’s Who in the Zoo’ the narrator follows zookeeper Porky Pig, profiling different animals in a zoo and their oddities: a giraffe, a laughing hyena, etc. In the spirit of that cartoon, I will play the role of Porky Pig and identify the most intriguing projects that have changed statuses between the two versions of the ESOO. Hopefully, this will help our readers ponder the state of the project development pipeline, and the modelling that relies upon it.
What’s changed?
For context, the AEMO has three general categories in which they classify the status of new projects. These projects are assessed based on their procurement progress against five key criteria (land, contracts, planning, finance and construction). At a high-level, these three categories are:
- Committed – Projects that will proceed as they satisfy all five criteria. In some cases, projects are marked as committed but with an asterisk if they satisfy land, finance and construction criteria, and are in the process of finalising either contract or planning obligations.
- Anticipated – Projects that meet at least three of the five criteria. If the developer does not submit survey information back to the AEMO at least once every 6 months, the project is bumped back to ‘publicly announced’ or withdrawn from the database.
- Publicly Announced – Projects that have been announced/proposed by a developer. These do not necessarily need to meet any of the five key criteria. The ‘likelihood of proceeding’ of the projects within this category varies significantly.
On page 44 of the original 2023 ESOO, the AEMO clarified that ‘anticipated’ projects had begun to be included in the reliability forecast (Central scenario), this was a shift as projects with this category had not been included in this forecast in previous years. As anticipated projects may not have submitted an expected completion date in their survey submission, the AEMO states that a modelling assumption was made in those cases, such that each is assumed to be completed at T-3 years (July 1st 2027).
Delays
Let’s start with identifying which projects have been delayed since the original ESOO 2023 in August. Colin Packham of the Australian recently reported that 15 of 76 new projects faced delays, by his count, since halfway through last year. Below I have attempted to put together my own list tracking down each of these delayed projects. In order to compile this list I’ve had to navigate and scrape various archived versions of the Generation Information Spreadsheet maintained by the AEMO. As others may have experienced, the spreadsheet is not the most user-friendly or dissectable dataset, especially for longitudinal analysis. I will elaborate on why that may be an issue in a follow-up Part 2 of this analysis, but in the meantime, if you spot any omissions or errors in the table below, then please leave a comment.
|
ESOO 2023 |
||||
| Project | Region |
Original (August 2023) |
May 2024 Update |
|
|
Network |
Project Energy Connect Stage 1 (150 MW Transfer Capacity) | SA, NSW | Expected July 2024 | Expected November 2024 |
| Project Energy Connect Stage 2 (800 MW Transfer Capacity) | SA, NSW | Expected July 2026 | Expected July 2027 | |
| Central West Orana REZ Link | NSW | Expected September 2027 | Expected August 2028 | |
| Generation | Borumba Pumped Hydro (1,998 MW / 48,000 MWh) | QLD | Anticipated – Expected June 2030 | Anticipated – Expected September 2031 |
| Cultana Solar Farm (357 MW) | SA | Anticipated – Expected April 2026* | Anticipated – Expected July 2026 | |
| Derby Solar Farm (95 MW) | VIC | Anticipated – Expected September 2024 | Anticipated – Expected March 2025 | |
| Frasers Solar Farm (77 MW) | VIC | Anticipated – Expected November 2024 | Anticipated – Expected October 2025 | |
| Gnarwarre BESS (290MW / 550MWh) | VIC | Anticipated – Expected June 2024 | Anticipated – Expected January 2026 | |
| Melbourne Renewable Energy Hub A (600 MW / 1,600 MWh)** | VIC | Anticipated – Expected August 2025 | Committed – Expected November 2025 | |
| New England Solar Farm BESS (50 MW / 50 MWh) | NSW | Anticipated – Expected June 2024 | Anticipated – Expected December 2026 | |
| Orana BESS (408 MW / 1,660 MW) | NSW | Anticipated – Expected May 2025 | Anticipated – Expected December 2026 | |
| Riverina Solar Farm (32 MW) | NSW | Committed – Expected June 2024 | Committed – Expected June 2025 | |
| Sapphire Wind Farm BESS (30 MW / 38 MWh) | NSW | Anticipated – Expected December 2024 | Anticipated – Expected June 2025 | |
| Templers BESS (111 MW / 291 MWh) | SA | Anticipated – Expected May 2025 | Committed – Expected August 2025 | |
| Ulinda Park BESS (155 MW / 298 MWh) | QLD | Anticipated – Expected December 2024 | Anticipated – Expected December 2025 | |
| Wunghnu Solar Farm (94 MW) | VIC | Committed – Expected August 2024 | Committed – Expected October 2024 | |
*Completion date has changed multiple times since the July 2023 update of the Generation Information dataset
**Project structure has changed
If you spot any errors or missing information in the table above, please leave a comment.
As almost half of those generation projects are storage, it is worth noting:
- With respect to big batteries, we recently published an analysis examining the actual development timelines for each of the existing twenty big batteries in the NEM. The second graphic in that article highlighted that the nine most recent BESS projects had taken from 16 up to 26 months to go from financial close to full operations.
- With respect to pumped hydro, the shifting expected completion date of Snowy 2.0 has been well publicised. This is perhaps a lesson that anticipating a completion date for a project of that size and complexity is difficult.
Leaving the market
In addition to the announced 2-to-4-year extension of Eraring, announced two days after the release of the ESOO update, it was announced that three units will be leaving the market since the original ESOO.
|
ESOO 2023 |
||||
|
Project |
Region |
Original (August 2023) |
May 2024 Update |
|
| Generation | Torrens Island B Unit 1 (200 MW) | SA | Expected to return from mothballing in November 2024 | Not Expected to Return (Closure in June 2026) |
| Port Lincoln Diesel Generator (73.5 MW) | SA | In Service | Mothballed and Not Expected to Return (Closure in January 2028) | |
| Snuggery Diesel Generator (63 MW) | SA | In Service | Mothballed and Not Expected to Return (Closure in January 2028) | |
If you spot any errors or missing information in the table above, please leave a comment.
Newly progressed capacity
The ESOO update highlighted that ‘4.6 GW of new capacity had advanced enough to be considered’ within their modelling.
I won’t list these in this article but hope to cover each of these projects in Part 2 in coming weeks.
A slightly longer view of development
Below is a simplified Sankey diagram I’ve created using archived versions of the AEMO’s Generation Information spreadsheet. The diagram does not track flows of individual projects as some projects occasionally get withdrawn, have their status bumped back, or can skip steps – but rather, the diagram tracks the net change in flows from the four project stages.
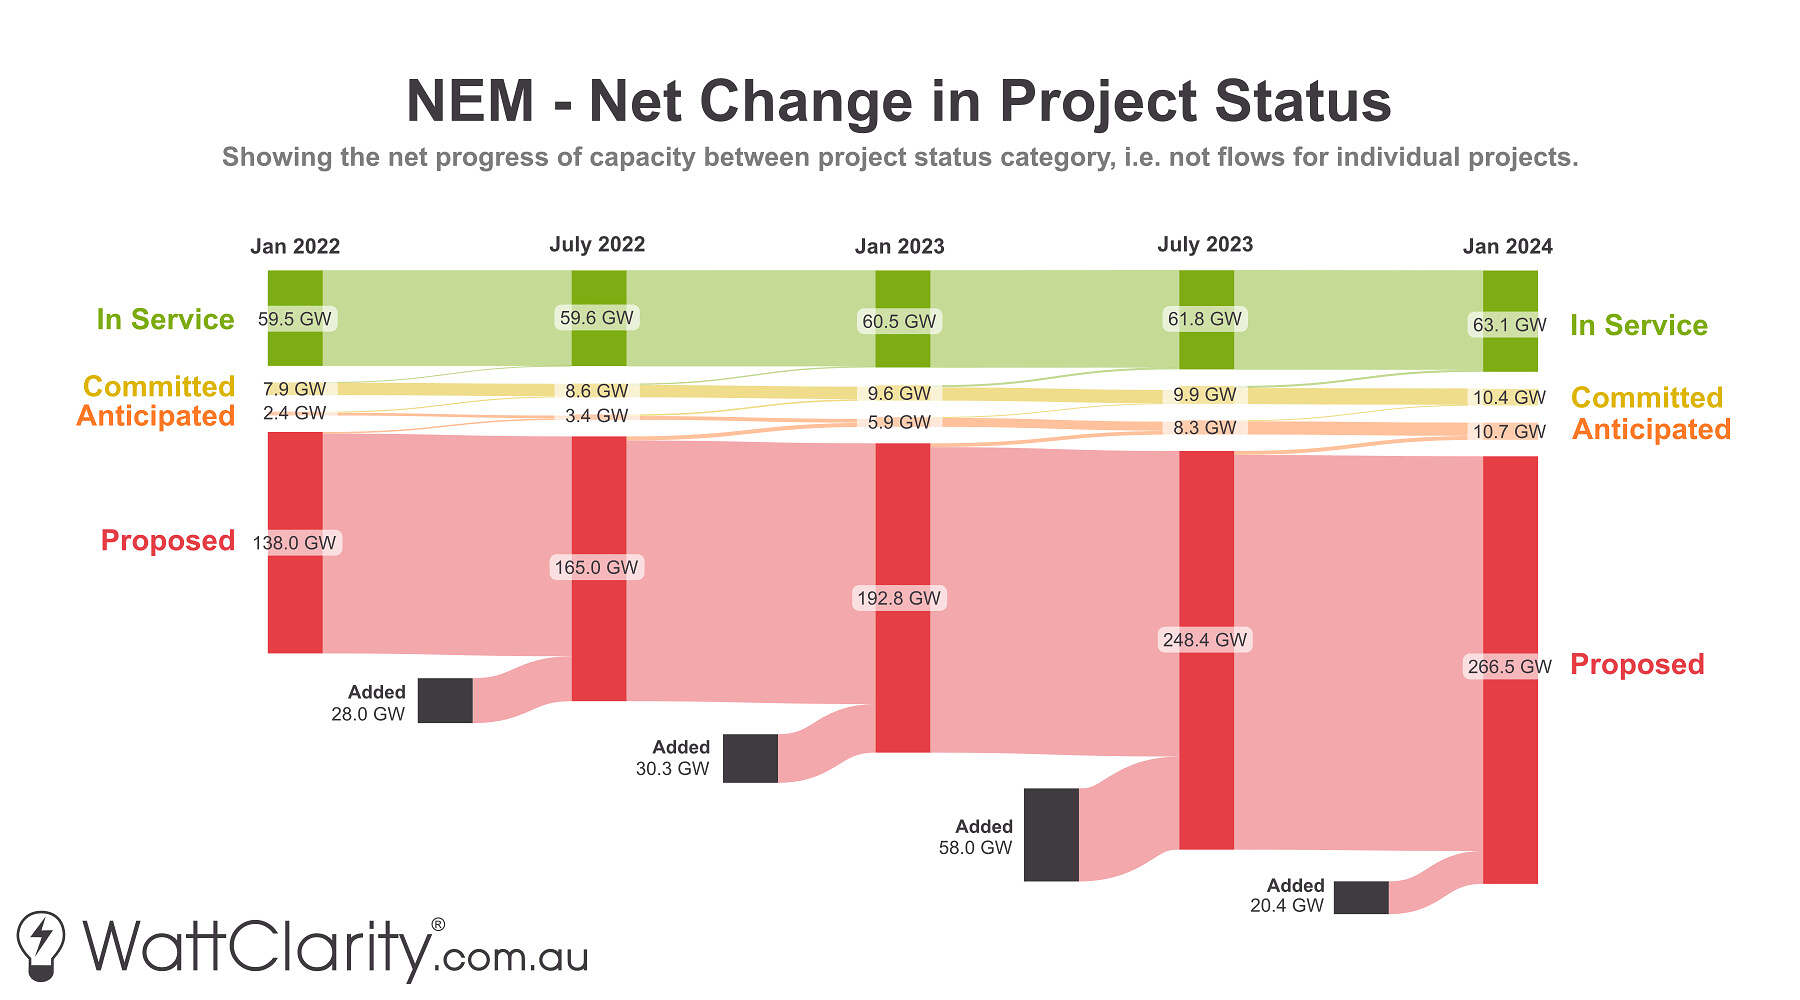
The net change between projects proposed and in service across the NEM between January 2022 to January 2024.
Source: AEMO Generation Information
As time permits I’ll endeavour to update and expand upon this diagram in future articles, but for now, two key points stand out:
- It’s clear that the amount of capacity ‘In Service’ and at the ‘Committed’ stage has largely stalled. If we consider just the capacity losses from eventual coal retirements, it’s hard to see how a net gain of 2.5 GW of new project committments over a two-year period is keeping up with the speed of the transition.
- The sheer volume of proposed projects dwarfs the number actually being progressed. Perhaps others more knowledgeable than myself could provide insight (via the comment section) as to whether this may be causing bottlenecks in itself? And their thoughts on whether this is an efficient allocation of resources and skills in terms of addressing the biggest problems in the energy transition (an honest question, not a statement).
As the Australian reported yesterday, some industry executives have suggested that the incoming Capacity Investment Scheme may even further strangle development progress in the short-to-medium term, as developers face more variables and complexity when evaluating their bid parameters.
Key Takeaways
As time permits, I will publish a second instalment of this analysis, but from Part 1 today I’ll finish with a couple of takeaways:
- Projects already committed and anticipated continue to face delays. A significant number of these delays relate to storage projects. In that regard, it is a much different development environment from the ‘100 days or it’s free’ promise that Elon Musk delivered seven years ago.
- We may be building anticipation faster than we’re actually building new projects. The disparity between the volume of proposed projects and those advancing through to completion should perhaps raise some concern about a ‘perception vs reality’ dilemma.
In your 15 March 2024 article “Need for speed: How long has each battery project in the NEM taken to deliver?” you recorded Tailem Bend Battery as being partial operational from 27 October 2023. To date I have not seen any activity in the AEMO data for the battery.
Hi Alex, I checked again and from what I can see in the AEMO data there was non-zero SCADA output for the generation-side DUID for that battery at 13:25 and again 16:30 on the 27th October 2023. This could have been very early testing or a SCADA anomaly as it doesn’t look like there was any other activity until last Tuesday the 3rd of June 2024 – where it looks like it output 42MW at around 18:00