

Callum’s already noted ‘Callide C3 & C4 unexpectedly trip’, shortly after it happened on Thursday afternoon 15th January 2026.
Since that first article:
1) We noted ‘Simultaneous with trip of Callide C3 and C4 (frequency impacts … a first look)’.
… With that first look at (albeit suspect) frequency data, it appears that a more precise time of the coincident trips was 16:55:21.7 (NEM time).
2) We also recorded how ‘2 hours after coincident trip of Callide C3 and C4 (QLD price spikes >$1,000/MWh)’; and
(a) noting that it took 2 hours for the price to jump that much, in this article we’re going to focus much nearer term with respect to a few dispatch intervals after the trip, in order to ascertain what the immediate effect was
(b) in doing this, readers might wish to reference this first step into the complexities of the dispatch interval in the real world, in order to refresh their memories of the timing, and context, of the ‘magic happens’ stage of each dispatch interval.
For this analysis we’re going to utilise two instances of the ‘Forecast Convergence’ widget in ez2view, in a window time-travelled to 17:25 (NEM time):
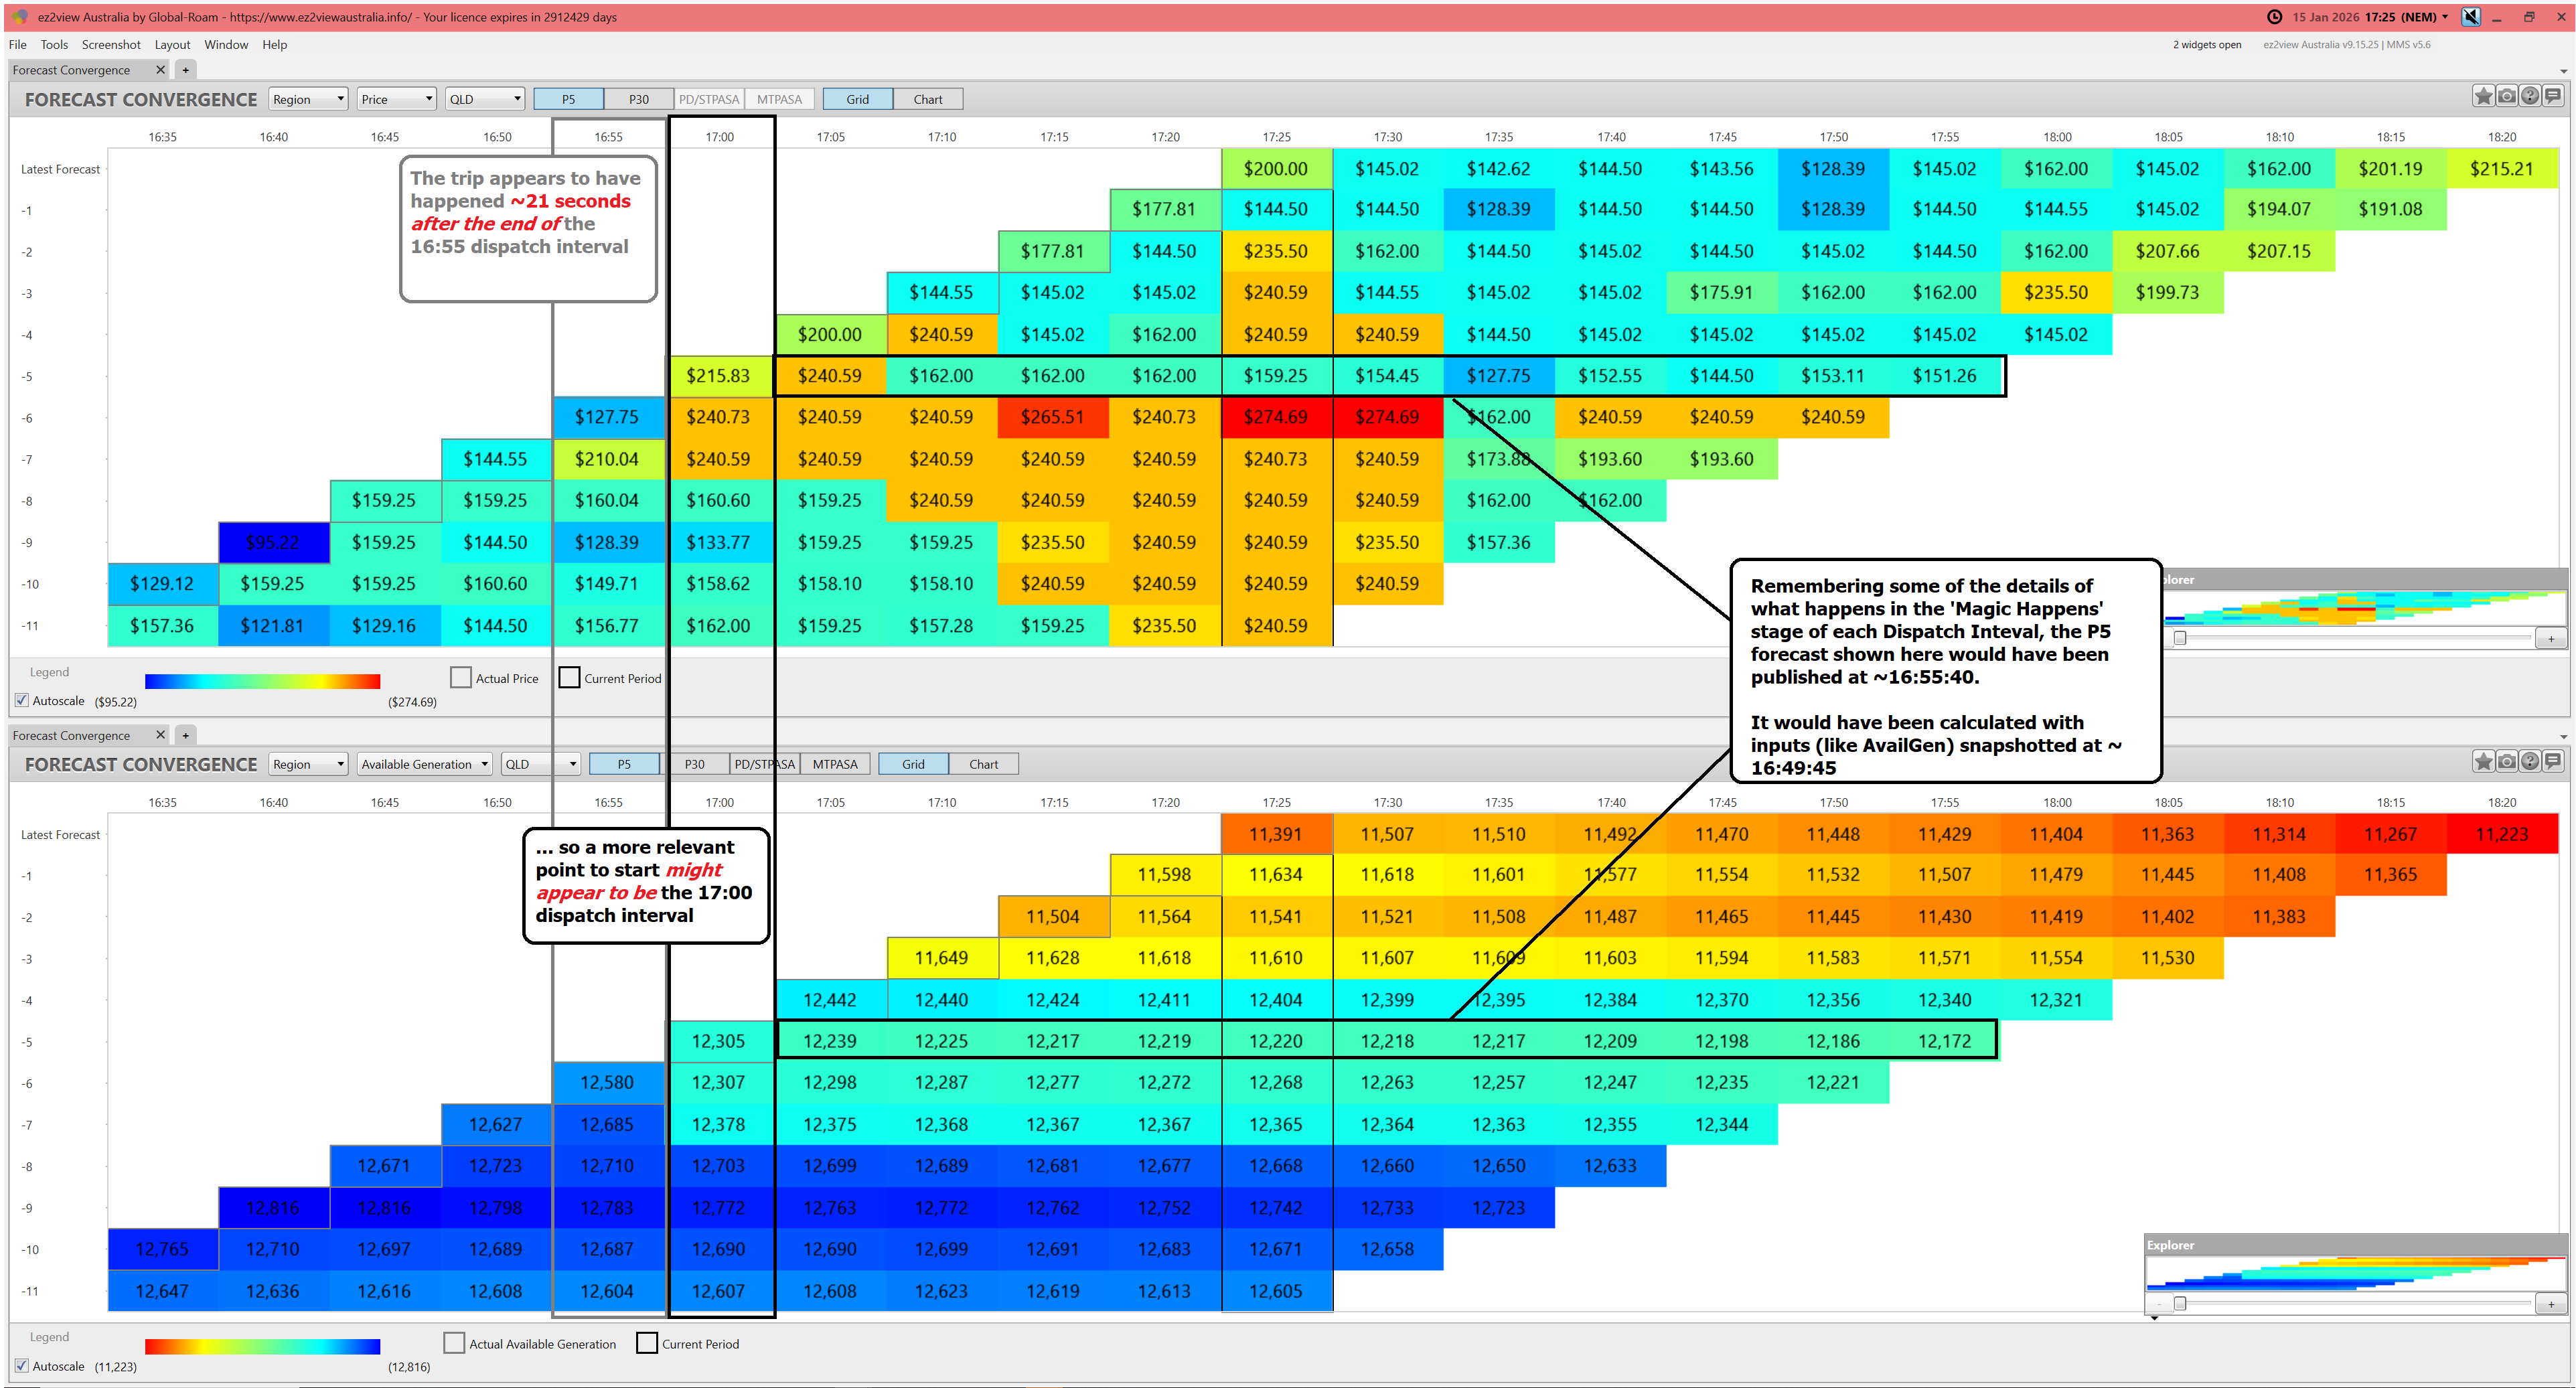
With this image:
1) Remember that the ‘Grid’ view in this widget allows one to ‘look up a vertical’ in order to see ‘that other dimension of time’
2) We also try to set up images such that you can click on an image to open a larger screen view.
With reference to the above image, let’s do a first pass of what we can see happening in both data sets, and try to think through what the impact is on price outcomes (both actuals, and P5 predispatch forecasts):
The 16:50 dispatch interval
No confusion that this one was definitely before any trip of the Callide C’s!
But it is worth noting that (even when this dispatch interval was calculated at ~16:45:05) there was already expectation that the Available Generation for the 17:00 dispatch interval would be ~325MW lower than the expectation had been 5 minutes beforehand.
1) In other words:
(a) from 12,703MW for 17:00 (in the P5 forecast published at ~16:45:40)
(b) forecast to drop 325MW down to 12,378MW (in the P5 forecast published at ~16:45:40)
2) And, with that, a shift in the P5 price forecasts
(a) from $160.60/MWh rising to $240.59/MWh;
(b) definitely influenced by the lower AvailGen, but perhaps also influenced by other changes.
Worth readers noting, to ensure no confusion in interpreting changes that were yet to happen, at this point.
The 16:55 dispatch interval
As noted in the image above, the entire 16:55 dispatch interval would be fully completed before the units had even tripped offline (i.e. we’d already past the end of the dispatch interval).
So that row is definitely prior to any trip of the Callide C’s.
The 17:00 dispatch interval
Furthermore, it’s quite likely that (assuming we’re correct in the timing of the trip being 16:55:21.7), all the ‘Magic Happens’ stages were effectively completed prior to any trip of the Callide C’s.
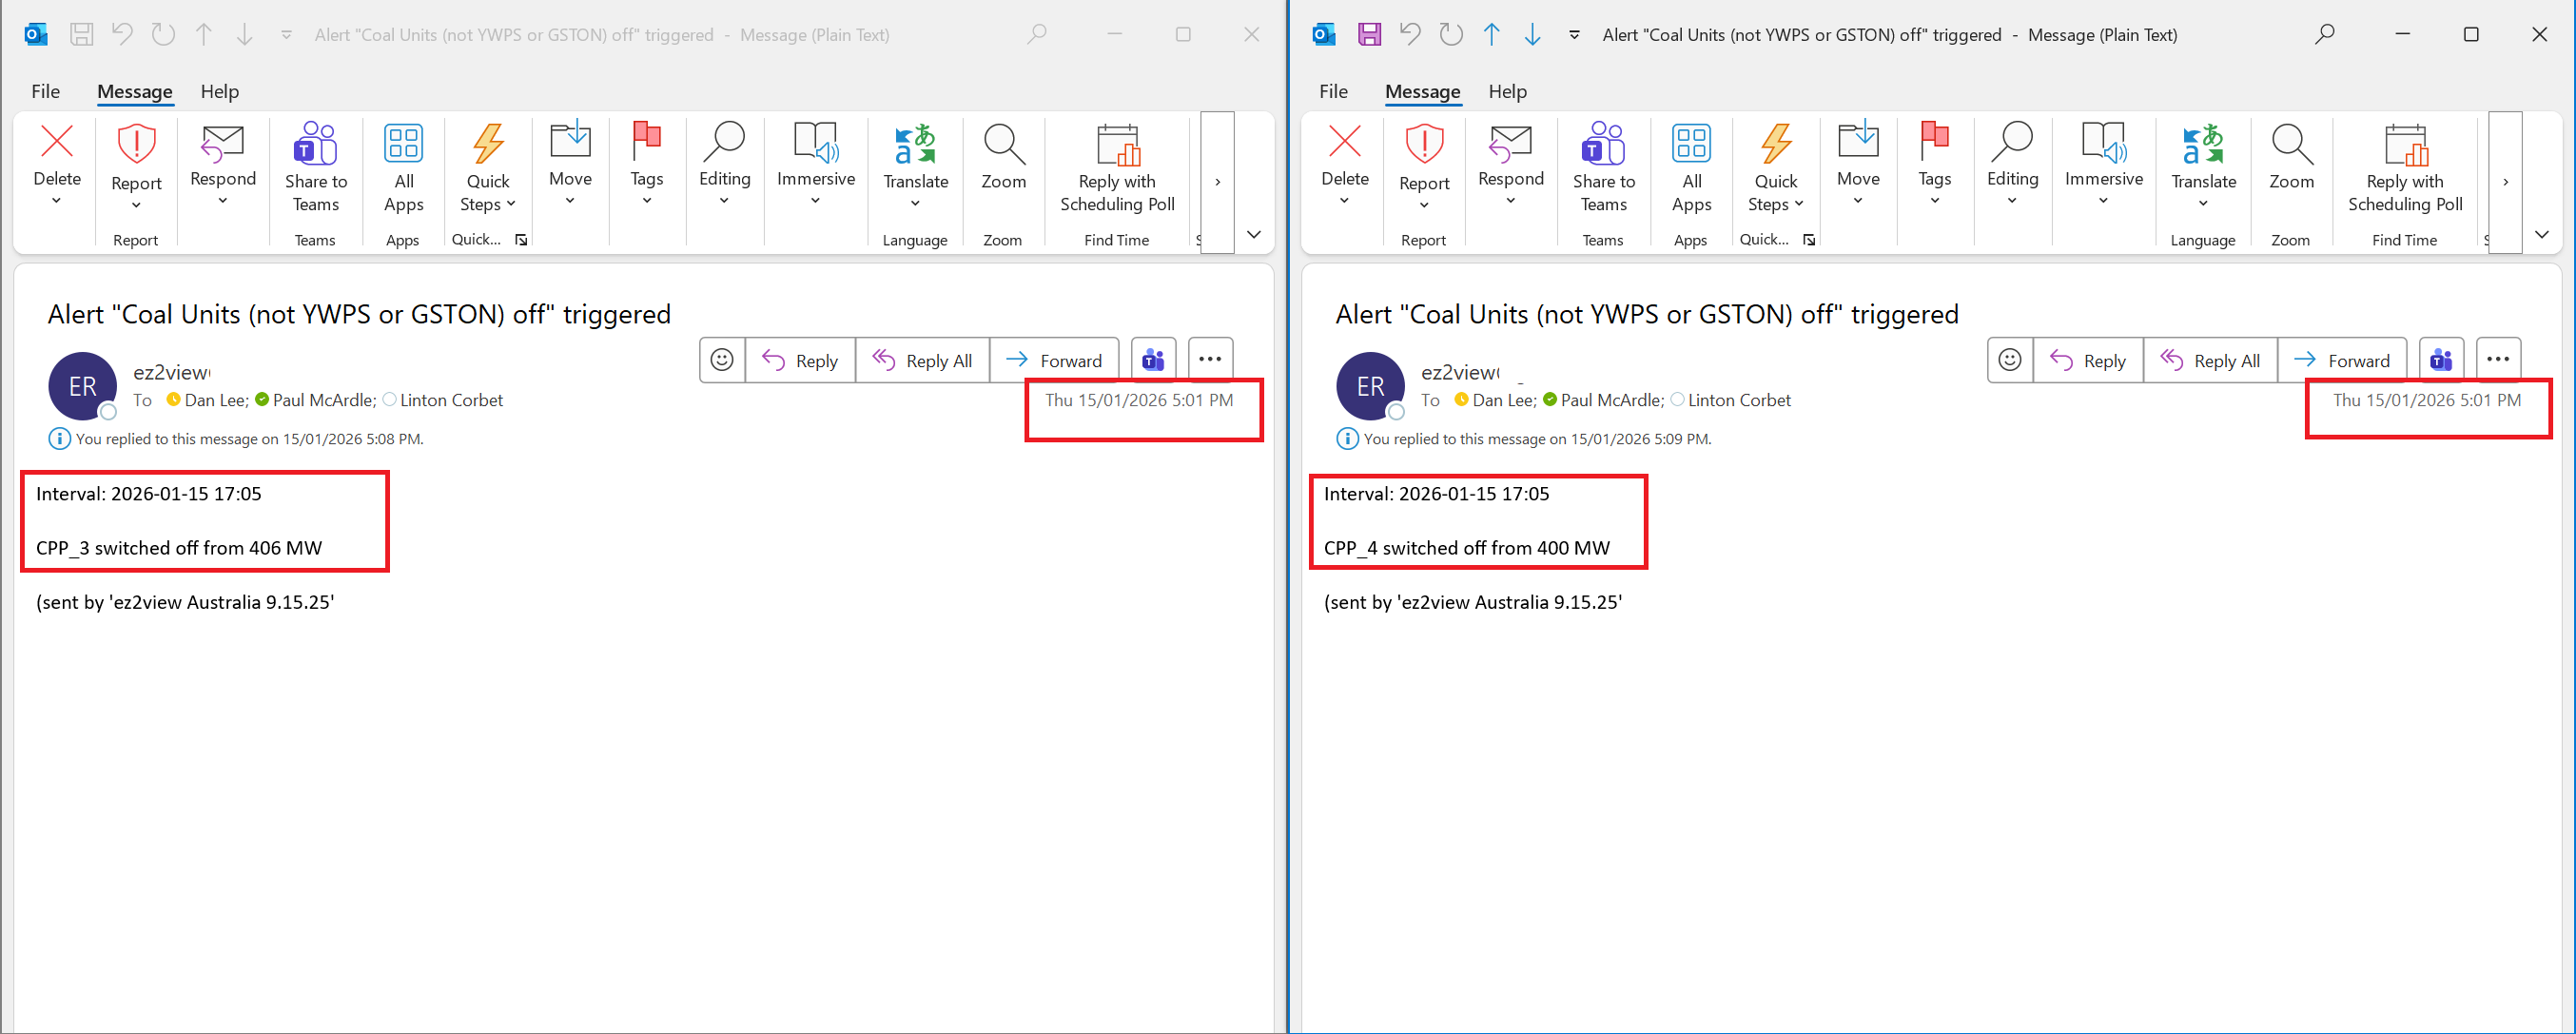
To illustrate this, we’ve captured two (almost identical) email alerts triggered by the ‘Notifications’ widget at 17:01 from within a display copy of ez2view which helps to reinforce that:
1) Even though (we believe) the time of the trips was was 16:55:21.7;
2) This was not communicated to the market for another 5 minutes;
3) It’s also clear that this data was represented as InitialMW for 17:00 … so that means could only be used as an input into the 17:05 dispatch interval.
The 17:05 dispatch interval
It seems clear (at least at this point) that 17:05 is the first dispatch interval in which the trips could have had some effect.
But what effect could it have had? Let’s think, before jumping to conclusions….
1) Given that InitialMW for both Callide units we have seen above was 0MW for this dispatch interval, NEMDE would have limited its calculated Target by the ROCUP rate in the bid for the unit
(a) we don’t fully know what that was until ‘next day public’
(b) but based on historic practice for coal units, it means that the Target output for the units can’t have been anywhere near the 800MW lost
2) So this could possibly have had some impact on price outcomes.
(a) however that’s not actually discernible in results
(b) we see the preceding P5 forecast for price at 17:05 being $240.59/MWh but the actual price for 17:05 was actually lower, at $200.00/MWh
(c) which is most likely due to just so many other changes occurring in the underlying data at the same time.
The 17:10 dispatch interval
For the 17:10 dispatch interval, we see
1) That the Available Generation has dropped:
(a) From 12,440MW (expectation in prior P5 run) to 11,649MW
(b) That’s a drop of 791MW
2) With this:
(a) It seems reasonable to guess that this drop might be as a result of CS Energy rebidding the capacity of the two units to zero?
(b) As the 791MW drop roughly equates to the 806MW loss of what the units were supplying
3) But, counterintuitively (at a simplistic level) we see the price actually drop below the earlier P5 forecast for this dispatch interval.
The 17:15, 17:20 and 17:25 dispatch intervals
Across the next 3 dispatch intervals:
1) We see the Available Generation continue to drop compared to expectations published in the P5 predispatch run at ~17:05:20:
(a) From 11,610MW down to 11,391MW
(b) A (further) drop of 219MW.
2) We also see the actual price follow reasonably compared to earlier expectations
In summary:
1) No ‘out of the blue’ (even minor) price blips ~25 minutes after the coincident trip
2) As noted before, no major spikes until ~2 hours after the trip (and we presume this was also the result of some rebidding).

Be the first to comment on "Quickly following the trip of Callide C3 and C4 (initial pricing impacts)"