

As noted to a client in a conversation just now, we’ve been hearing (with increasing frequency) about other parties* claiming to have built ‘better’ price forecasts than what the AEMO deploys via NEMDE and delivers in the P5, P30 and 7-day predispatch processes.
* certainly not us (call us sceptics of those claims).
Entirely coincidentally, here’s a snapshot of NEMwatch at the 15:00 dispatch interval (NEM time) on Thursday 8th January 2026, noting the SA price up at $980.89/MWh:

We’ve highlighted the sharp escalation in ‘Market Demand’ in South Australia over the past hour.
… but is that the only reason the price has climbed to close to $1,000/MWh?
I think not.
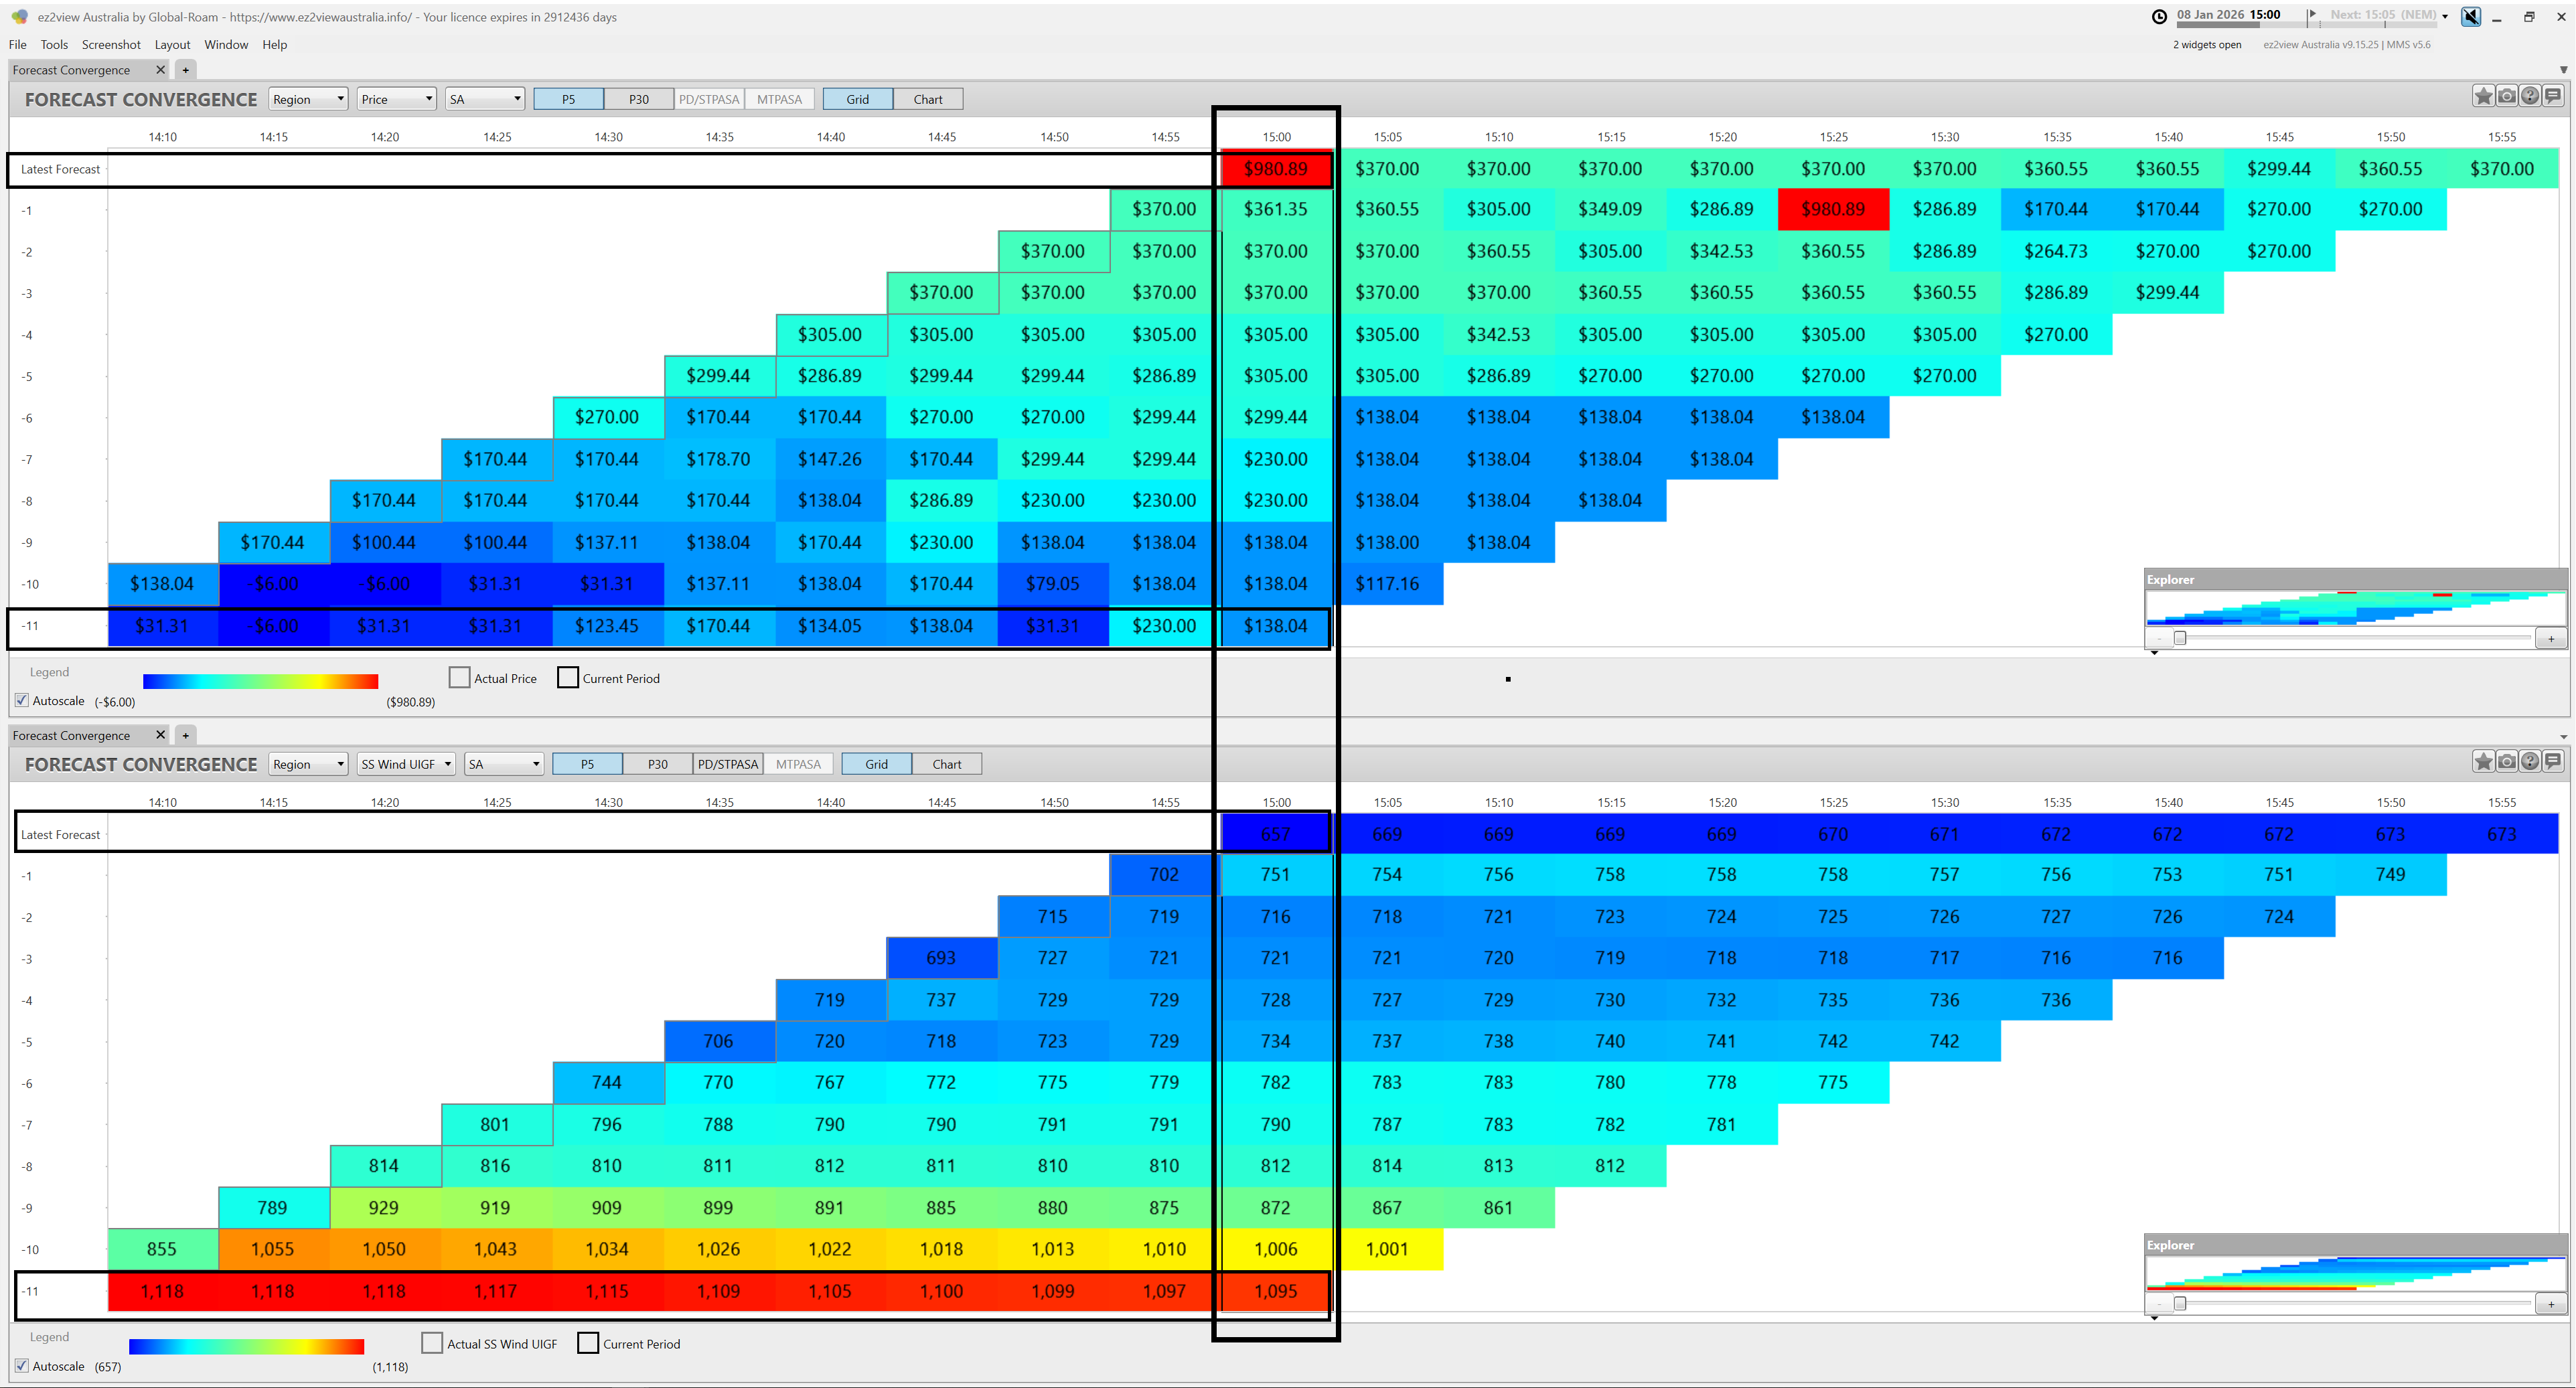
As an illustration of just one component (there are many!) of the challenges in producing a ‘better’ price forecast, here’s a view of two copies of the ‘Forecast Convergence’ widget in ez2view looking at two different AEMO forecasts for South Australia in the P5 predispatch time horizon:
Quick notes:
1) Remember this widget is designed to enable the user to ‘look up a vertical’ in order to see ‘that other dimension of time’ … and that you can click on an image for a larger view in another tab;
2) With this image:
(a) We’re focused on the same 15:00 dispatch interval (NEM time) on Thursday 8th January 2026;
(b) But the row at the bottom (i.e. the –11 forecast run) was produced 55 minutes earlier (i.e. roughly over the same period we see the ‘Market Demand’ rapidly climbing above.
3) In the top ‘Forecast Convergence’ widget we’re looking at the spot price
… and we can see that, whilst it landed at $980.89/MWh, 55 minutes earlier it was forecast to be ‘only’ $138.04/MWh
4) Whilst part of the reason for this difference (which some might mistakenly call an ‘error’) might have been the sharp escalation in demand, the bottom ‘Forecast Convergence’ widget reveals another factor
(a) This widget compares AEMO-produced UIGF aggregated across all Wind Farms in South Australia
(b) Whilst 55 minutes earlier, the forecast was that there would have been 1,095 MW of unconstrained availability;
c) We see that, at the point of dispatch:
i. That UIGF had dropped by 438MW, or 40% (i.e. less than an hour later)
ii. Down to 657 MW
5) So…
(a) We see both a sharp escalation in demand (seen in NEMwatch above, but noting that we have not looked into how unexpected this was)
(b) A sizeable unexpected drop in aggregate wind capability will certainly have been a factor delivering a higher-than-expected price outcome
… and just one more example feeding into the ‘is VRE forecastable’ debate.
(c) Note that there are quite likely to have been other factors, as well!

Be the first to comment on "Who’d try to create a ‘better’ price forecast than what the AEMO provides in P5, P30, 7DAY predispatch"