
In late September, I presented at the IEEE’s Australasian Universities Power Engineering Conference (AUPEC) in Brisbane, where I spoke about reserve-activation mechanisms and demand forecasting performance in the NEM, using one particular case study day — January 22nd, 2024 — as an example of the pressures facing modern power system and market operators.
This particular day stood out because it highlighted several operational stresses that we are seeing more regularly as the energy transition advances, including:
- the inherent limitations of short-term (e.g. hours-ahead) demand forecasting under high Distributed Energy Resource (DER) variability
- evidence that price signals, last-line-of-defence reserve mechanisms and distribution-level demand response programs do not always align
- a gap between market design assumptions and the complexities that operators actually face in real time
Our accompanying conference paper titled “Managing Reserve Uncertainty in High-DER Power Systems During Peak Demand Events: An Australian Case Study” — is now available via the IEEE Xplore portal for those with access. For those who don’t have access, this article summarises some of the high-level findings from the paper.
An unanticipated step-change in Queensland’s demand record
The paper undertakes a forensic examination of the operational, meteorological and DER-related factors that shaped what became a historically unprecedented day for electricity system operations in Queensland.
On the afternoon of January 22nd, 2024, Queensland’s demand exceeded 11 GW for the first time, and in the process saw an 8.6% jump over the previous record — the largest single-day step-up in regional peak demand in more than two decades, by far. What made the event so striking was that the peak demand trend in the region in the preceding summers had remained relatively flat. The chart from the paper reproduced below highlights the demand shape and peak on the case study day.
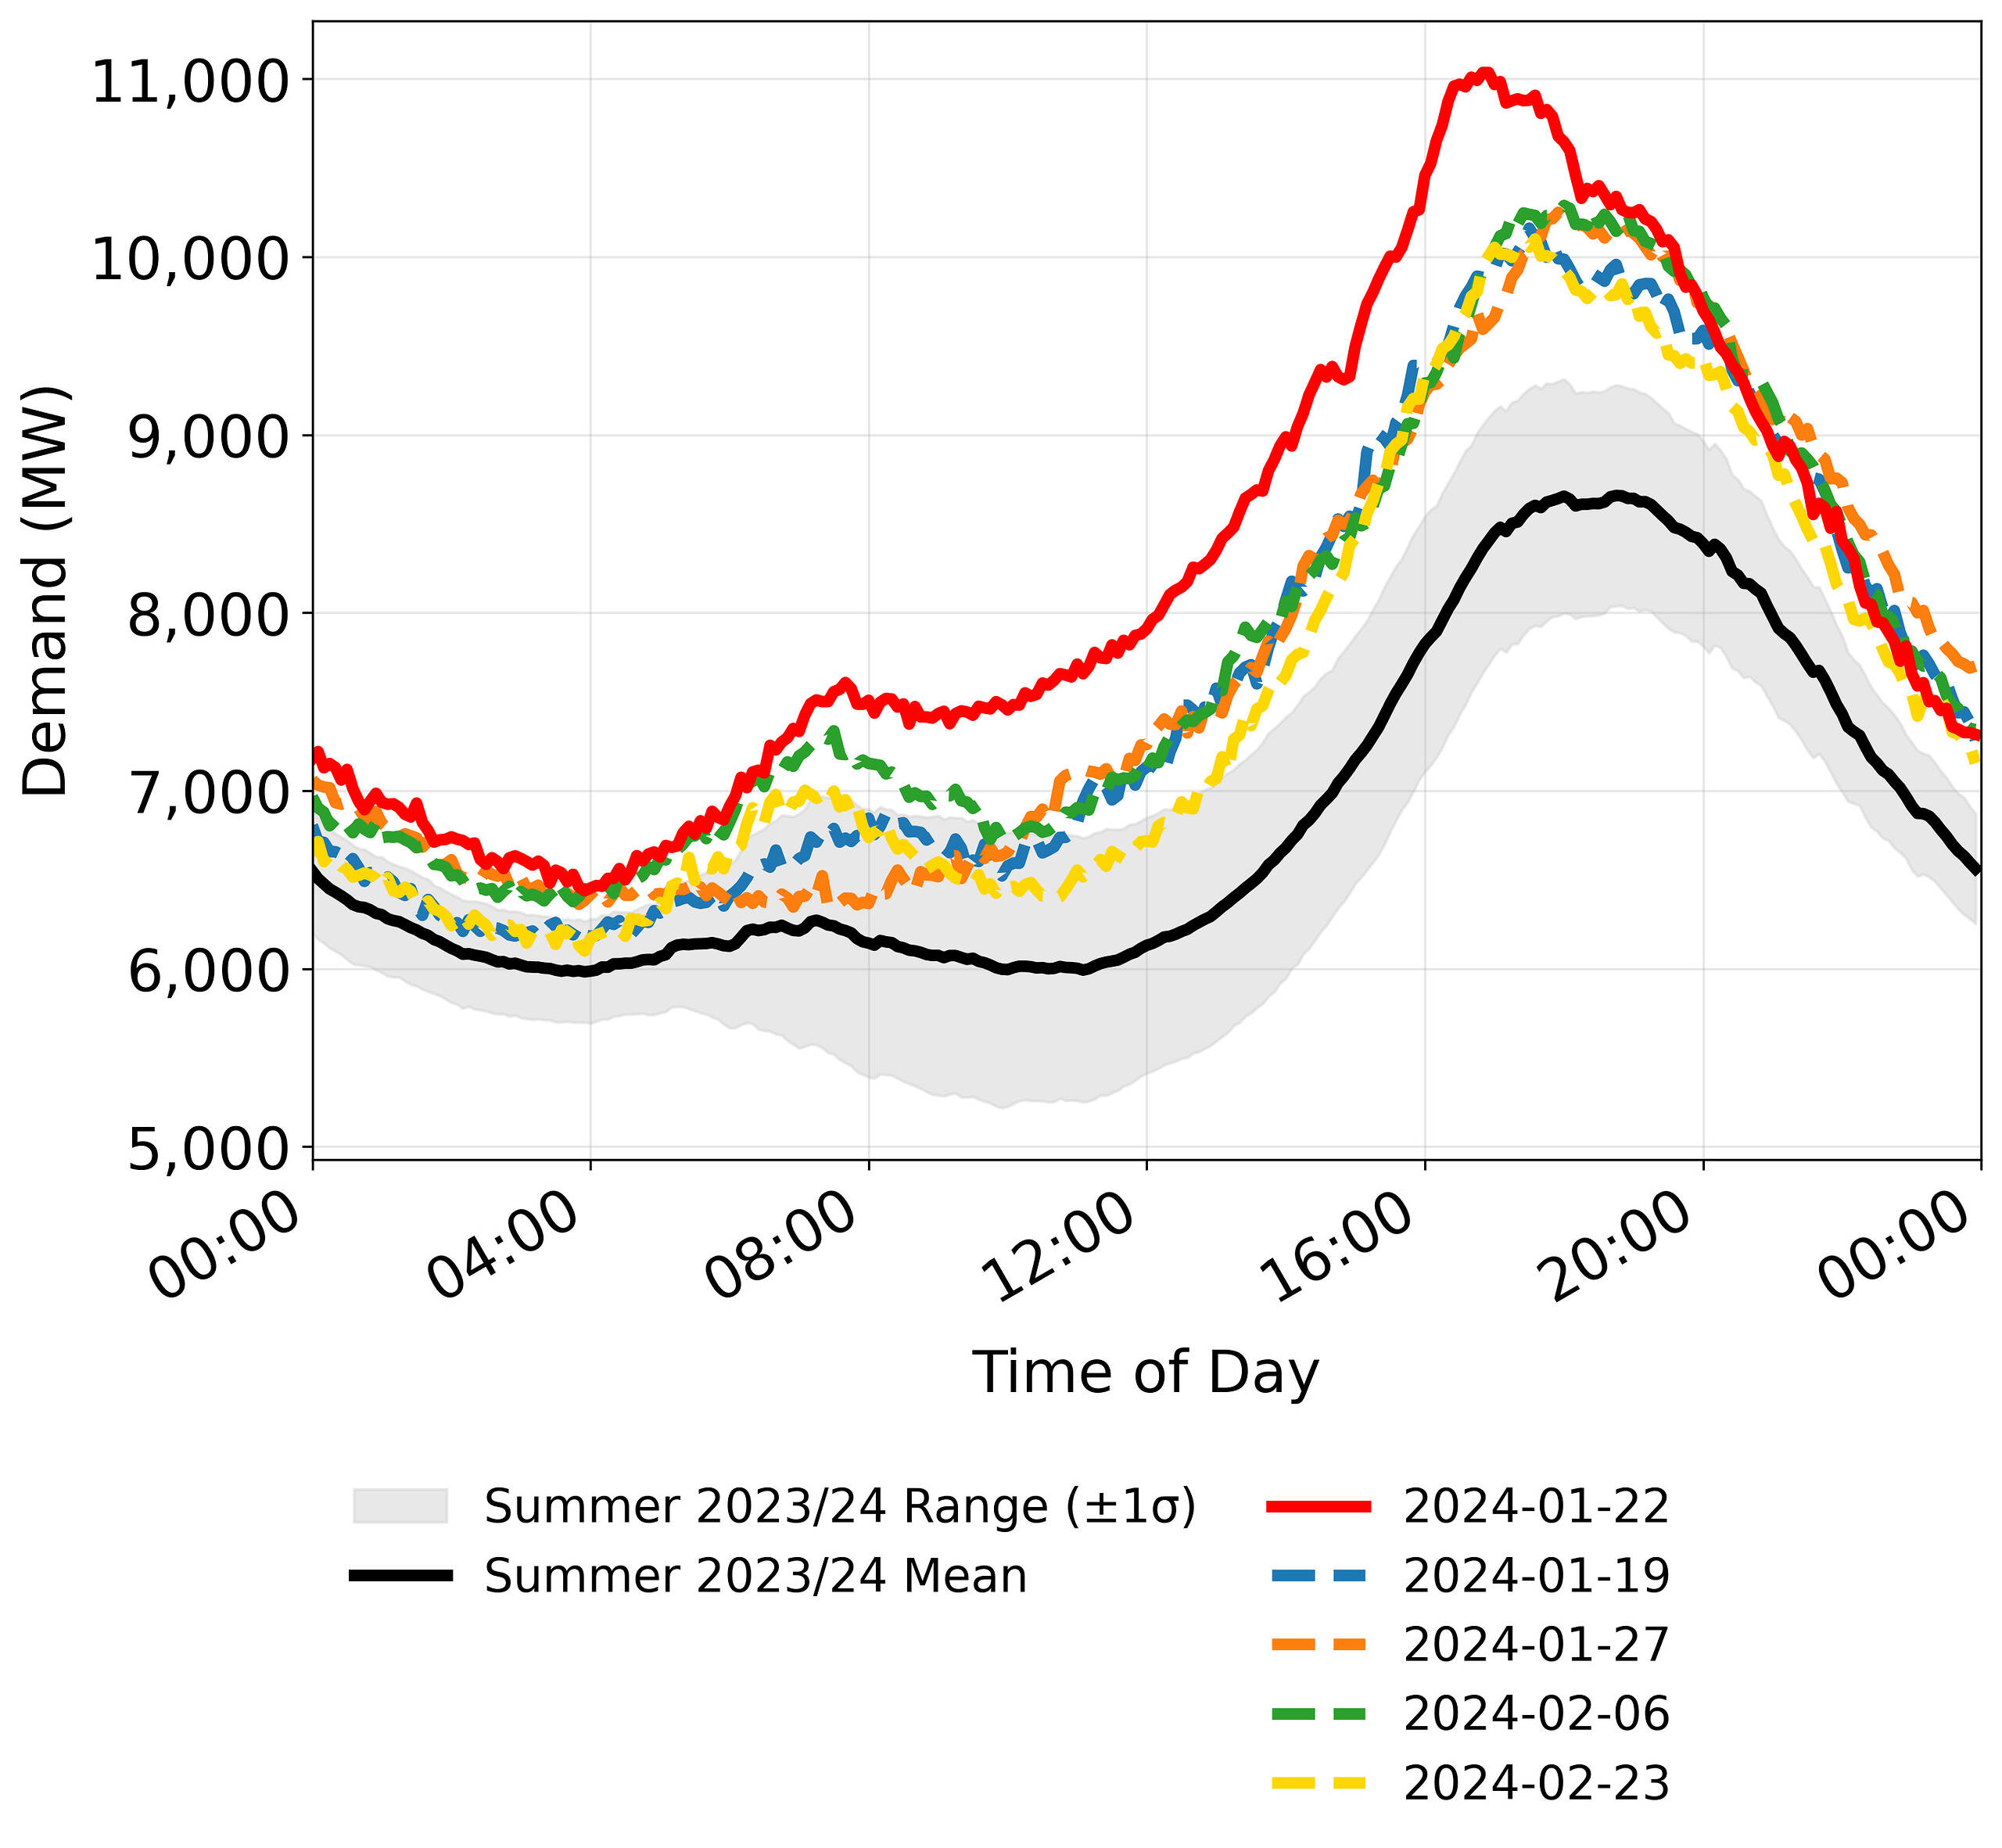
Comparison of QLD’s demand profile on 22nd January 2024 vs the next four highest peak days (and mean) of summer 2023-24, illustrating the atypically steep afternoon ramp and significantly higher peak.
Note: Market demand was the measure of demand used in the case study.
Data source: AEMO. Chart reproduced from Lee & Lane (2025).
Conditions leading up to and during the event
The arrival of strong El Niño conditions in Summer 2023-24 reset the meteorological backdrop after several milder La Niña or neutral ENSO years between 2019 and 2023.
On January 22nd 2024, exceptionally high temperatures across Queensland’s major load centres drove electricity demand significantly above typical summer levels. The apparent temperature at Brisbane’s Archerfield Airport reached 42.5°C at 13:20 local time — the highest observation for this weather station over the summer — resulting in a substantial surge in air-conditioning load.
Compounding this, Queensland’s usual duck-curve-shaped demand profile shifted with a shaper rise, particularly from around 16:00, coincident with a dense cloud band beginning to move south-to-north over the Brisbane metropolitan area, significantly reducing behind-the-meter rooftop PV output (and hence increasing net market demand).
Demand began to flatten from around 16:20 aligning with the activation of Energy Queensland’s PeakSmart demand response program (curtailing up to 280 MW of air-conditioning load) and several distribution-network outages across South-East Queensland (with 40,000+ properties in the region losing power). These outages were not considered load shedding, but it is possible that parts of the South-East Queensland distribution network tripped or failed under the extreme network stress — particularly given that many of the affected outage areas experienced no thunderstorms or other relevant weather events.
Excess available generation fell rapidly over the next two hours — due to lowering VRE conditions, interconnector constraints, and other supply-side factors — and by 18:30 the region’s Instantaneous Reserve Plant Margin (IRPM) had dropped to 4.09% — representing just 425 MW of excess available generation.
The chart below illustrates how excess available generation — measured via IRPM — steadily declined through the early evening. As IRPM approached its lowest point, the region saw the activation of the PeakSmart demand-response program and a brief spot price spike, although neither aligned perfectly with the full window of supply–demand tightness.
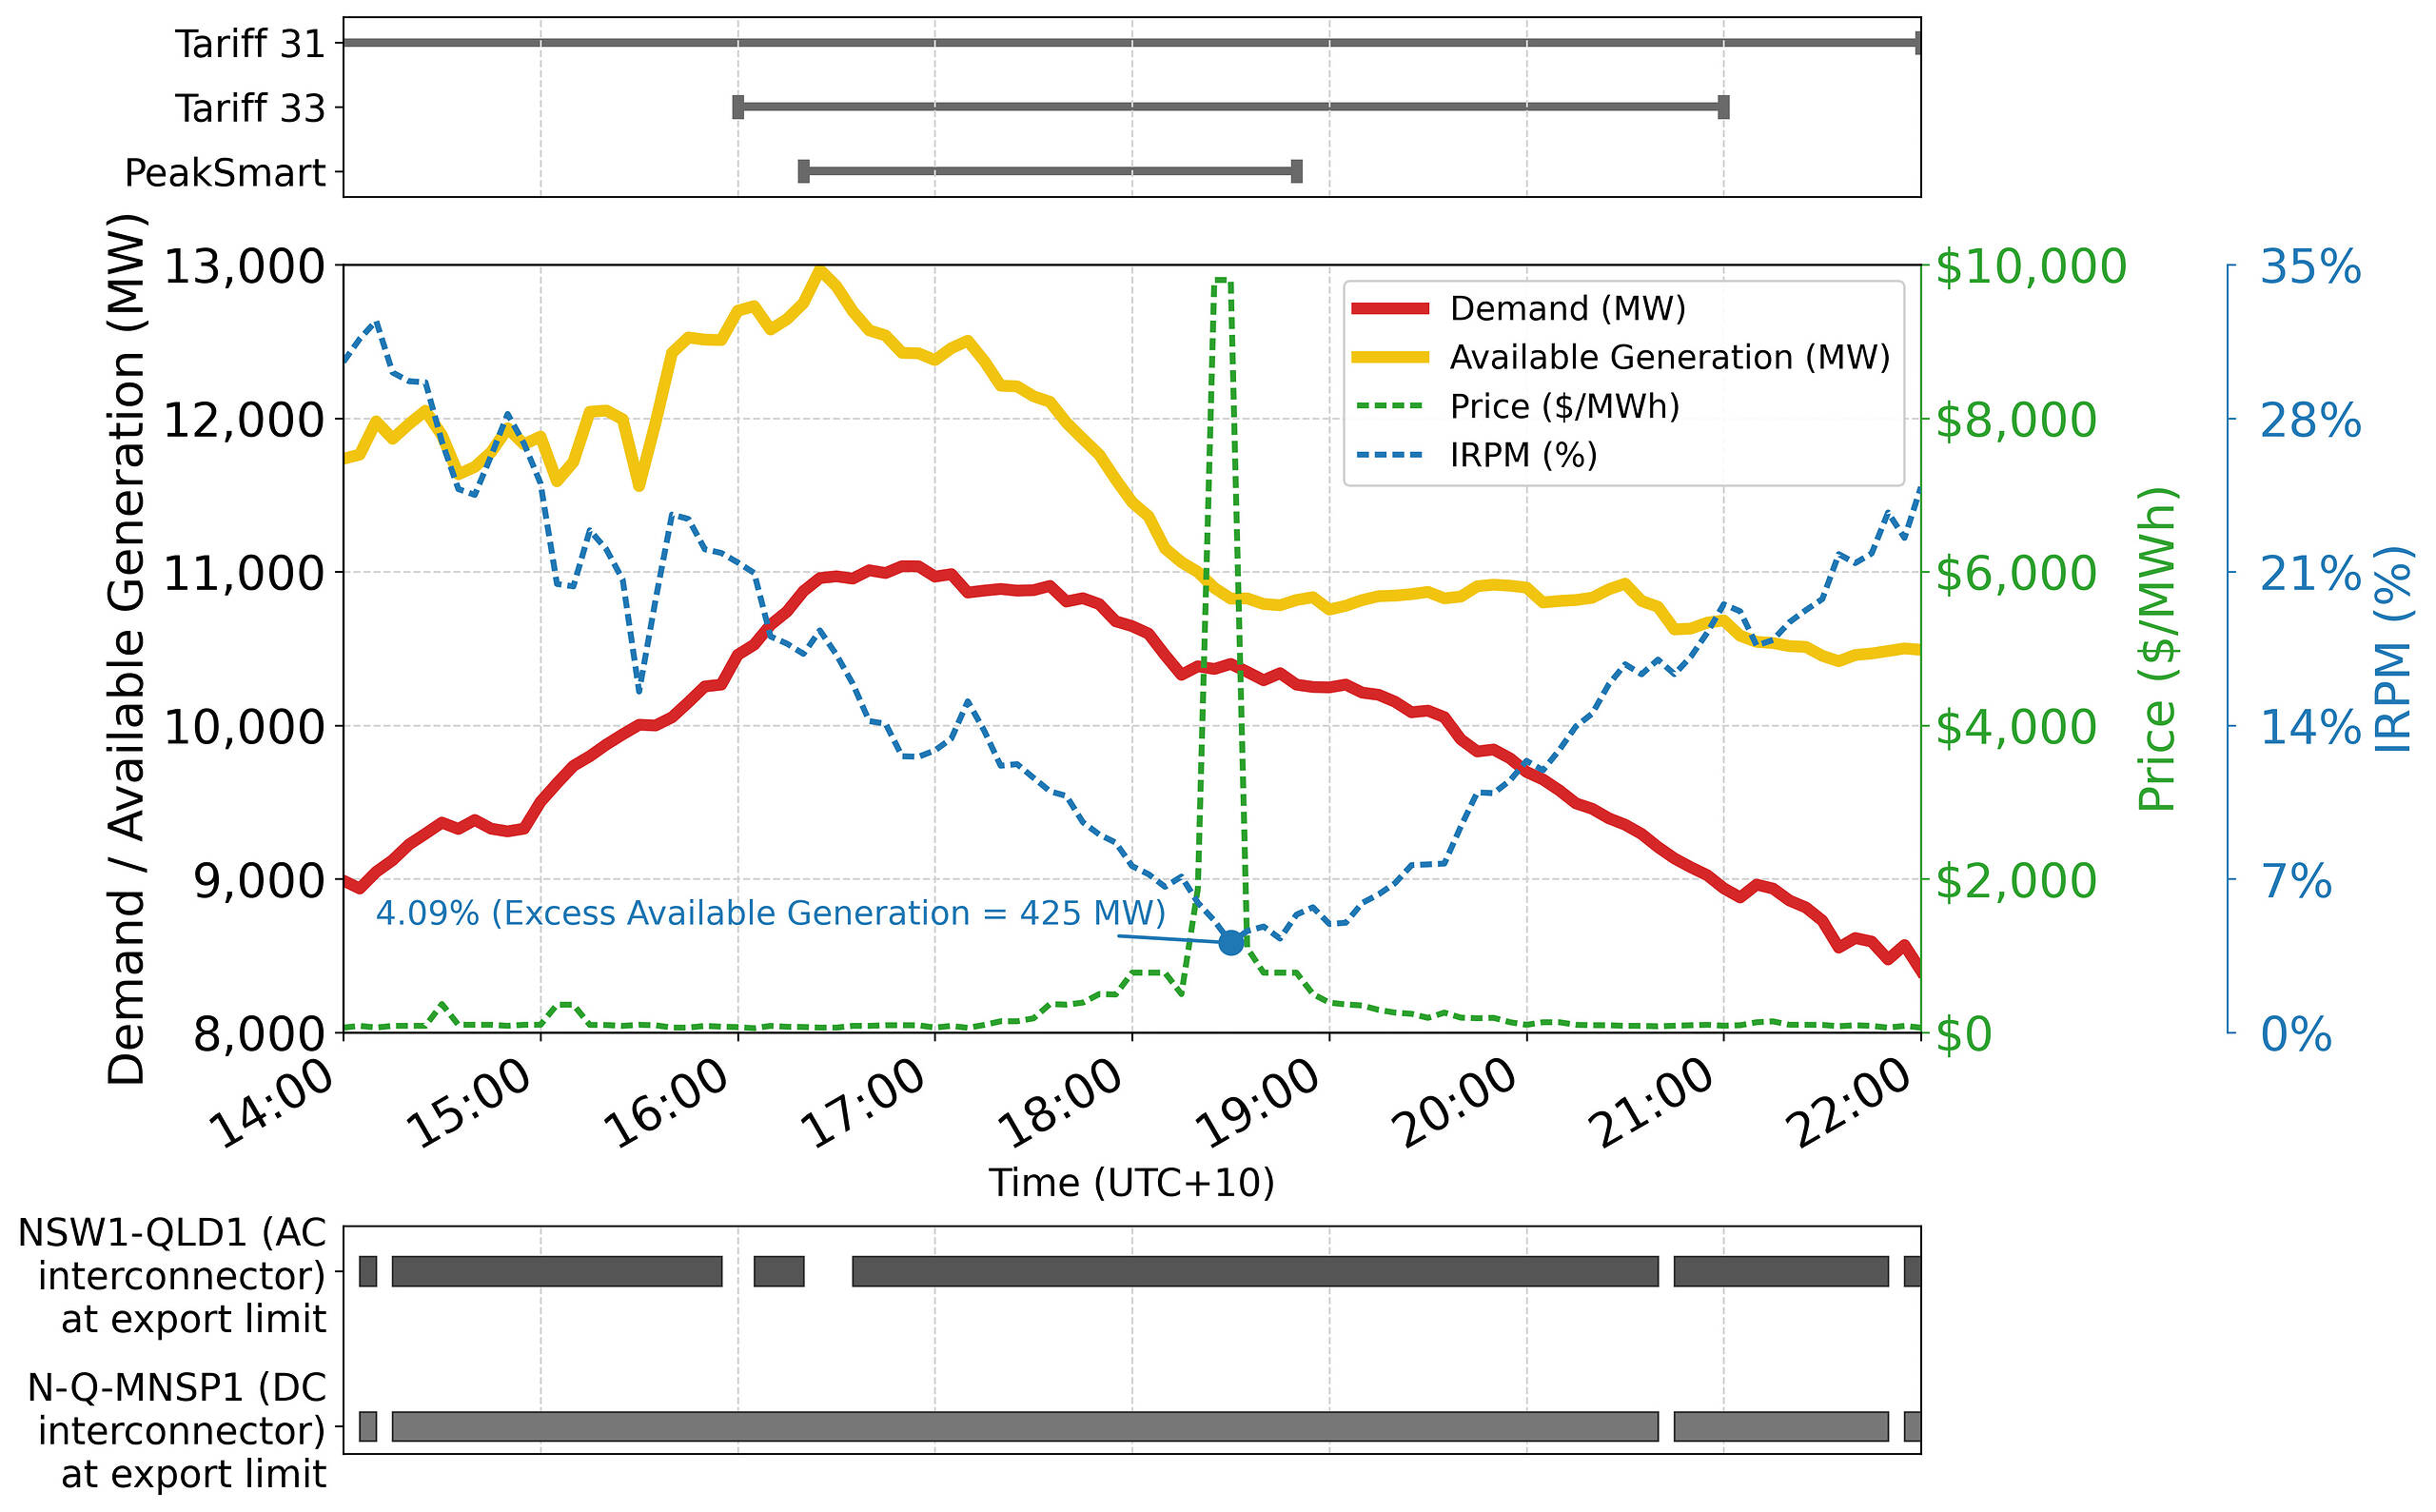
A timeline of high-level system conditions in Queensland on 22nd January 2024.
Data source: AEMO. Chart reproduced from Lee & Lane (2025).
A key contributing factor to the earlier sudden rise in demand was the behaviour of small-scale rooftop PV. Output was among the highest of the season in the middle of the day but collapsed rapidly around 16:30 as dense cloud systems passed over South-East Queensland. The resulting downward rate-of-change (ROC) exceeded 1,500 MW/hr (based on the AEMO’s 30-minute small-solar estimates), the steepest drop seen that summer. With limited real-time telemetry for behind-the-meter solar, operators could observe the impact only indirectly via rising net demand. This “invisibility” amplified uncertainty just as reserve margins were tightening — exactly the sort of operational blind spot that is becoming more material as DER penetration continues to grow.
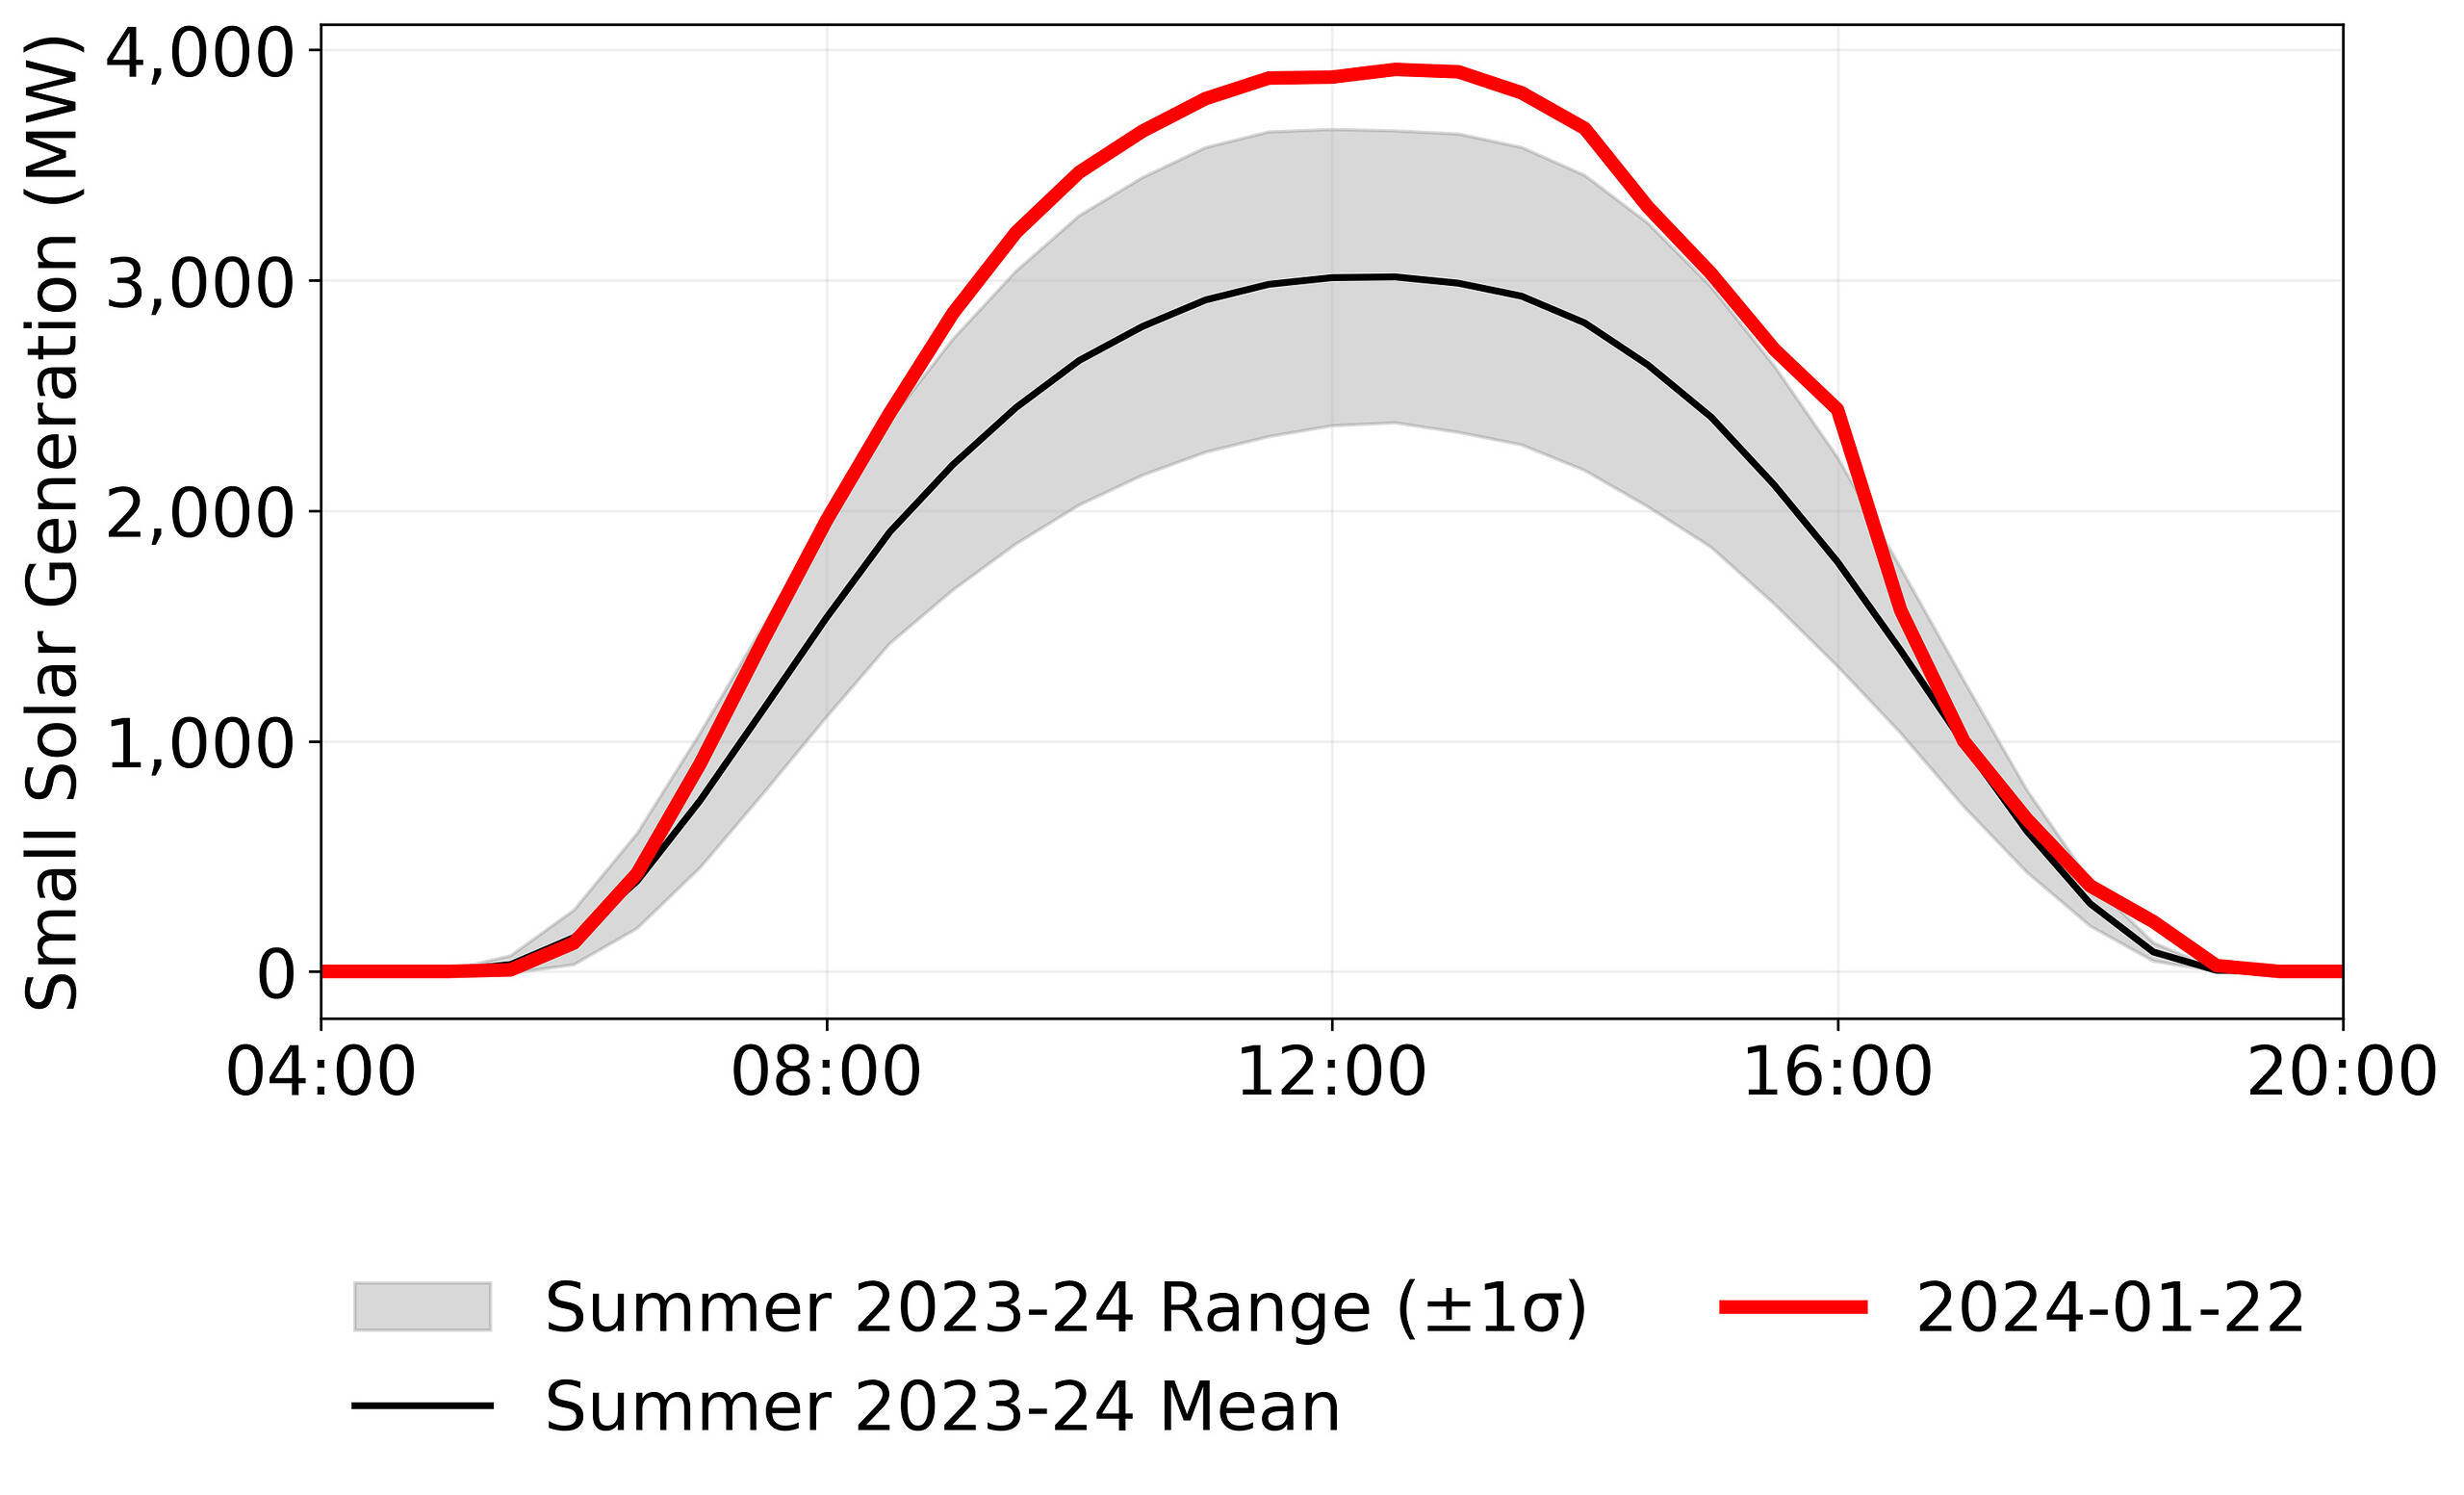
The sharp reduction in estimated small-scale solar (e.g. rooftop) PV output between 16:00 and 16:30 observations reflects the passage of dense cloud bands that moved over Brisbane that afternoon, contributing to net demand volatility.
Data source: AEMO. Chart reproduced from Lee & Lane (2025).
The figure below shows the top ten days in terms of maximum small-scale solar output in QLD over Summer 2023-24, with the corresponding minimum downward ROC in output on each of those days shown underneath.
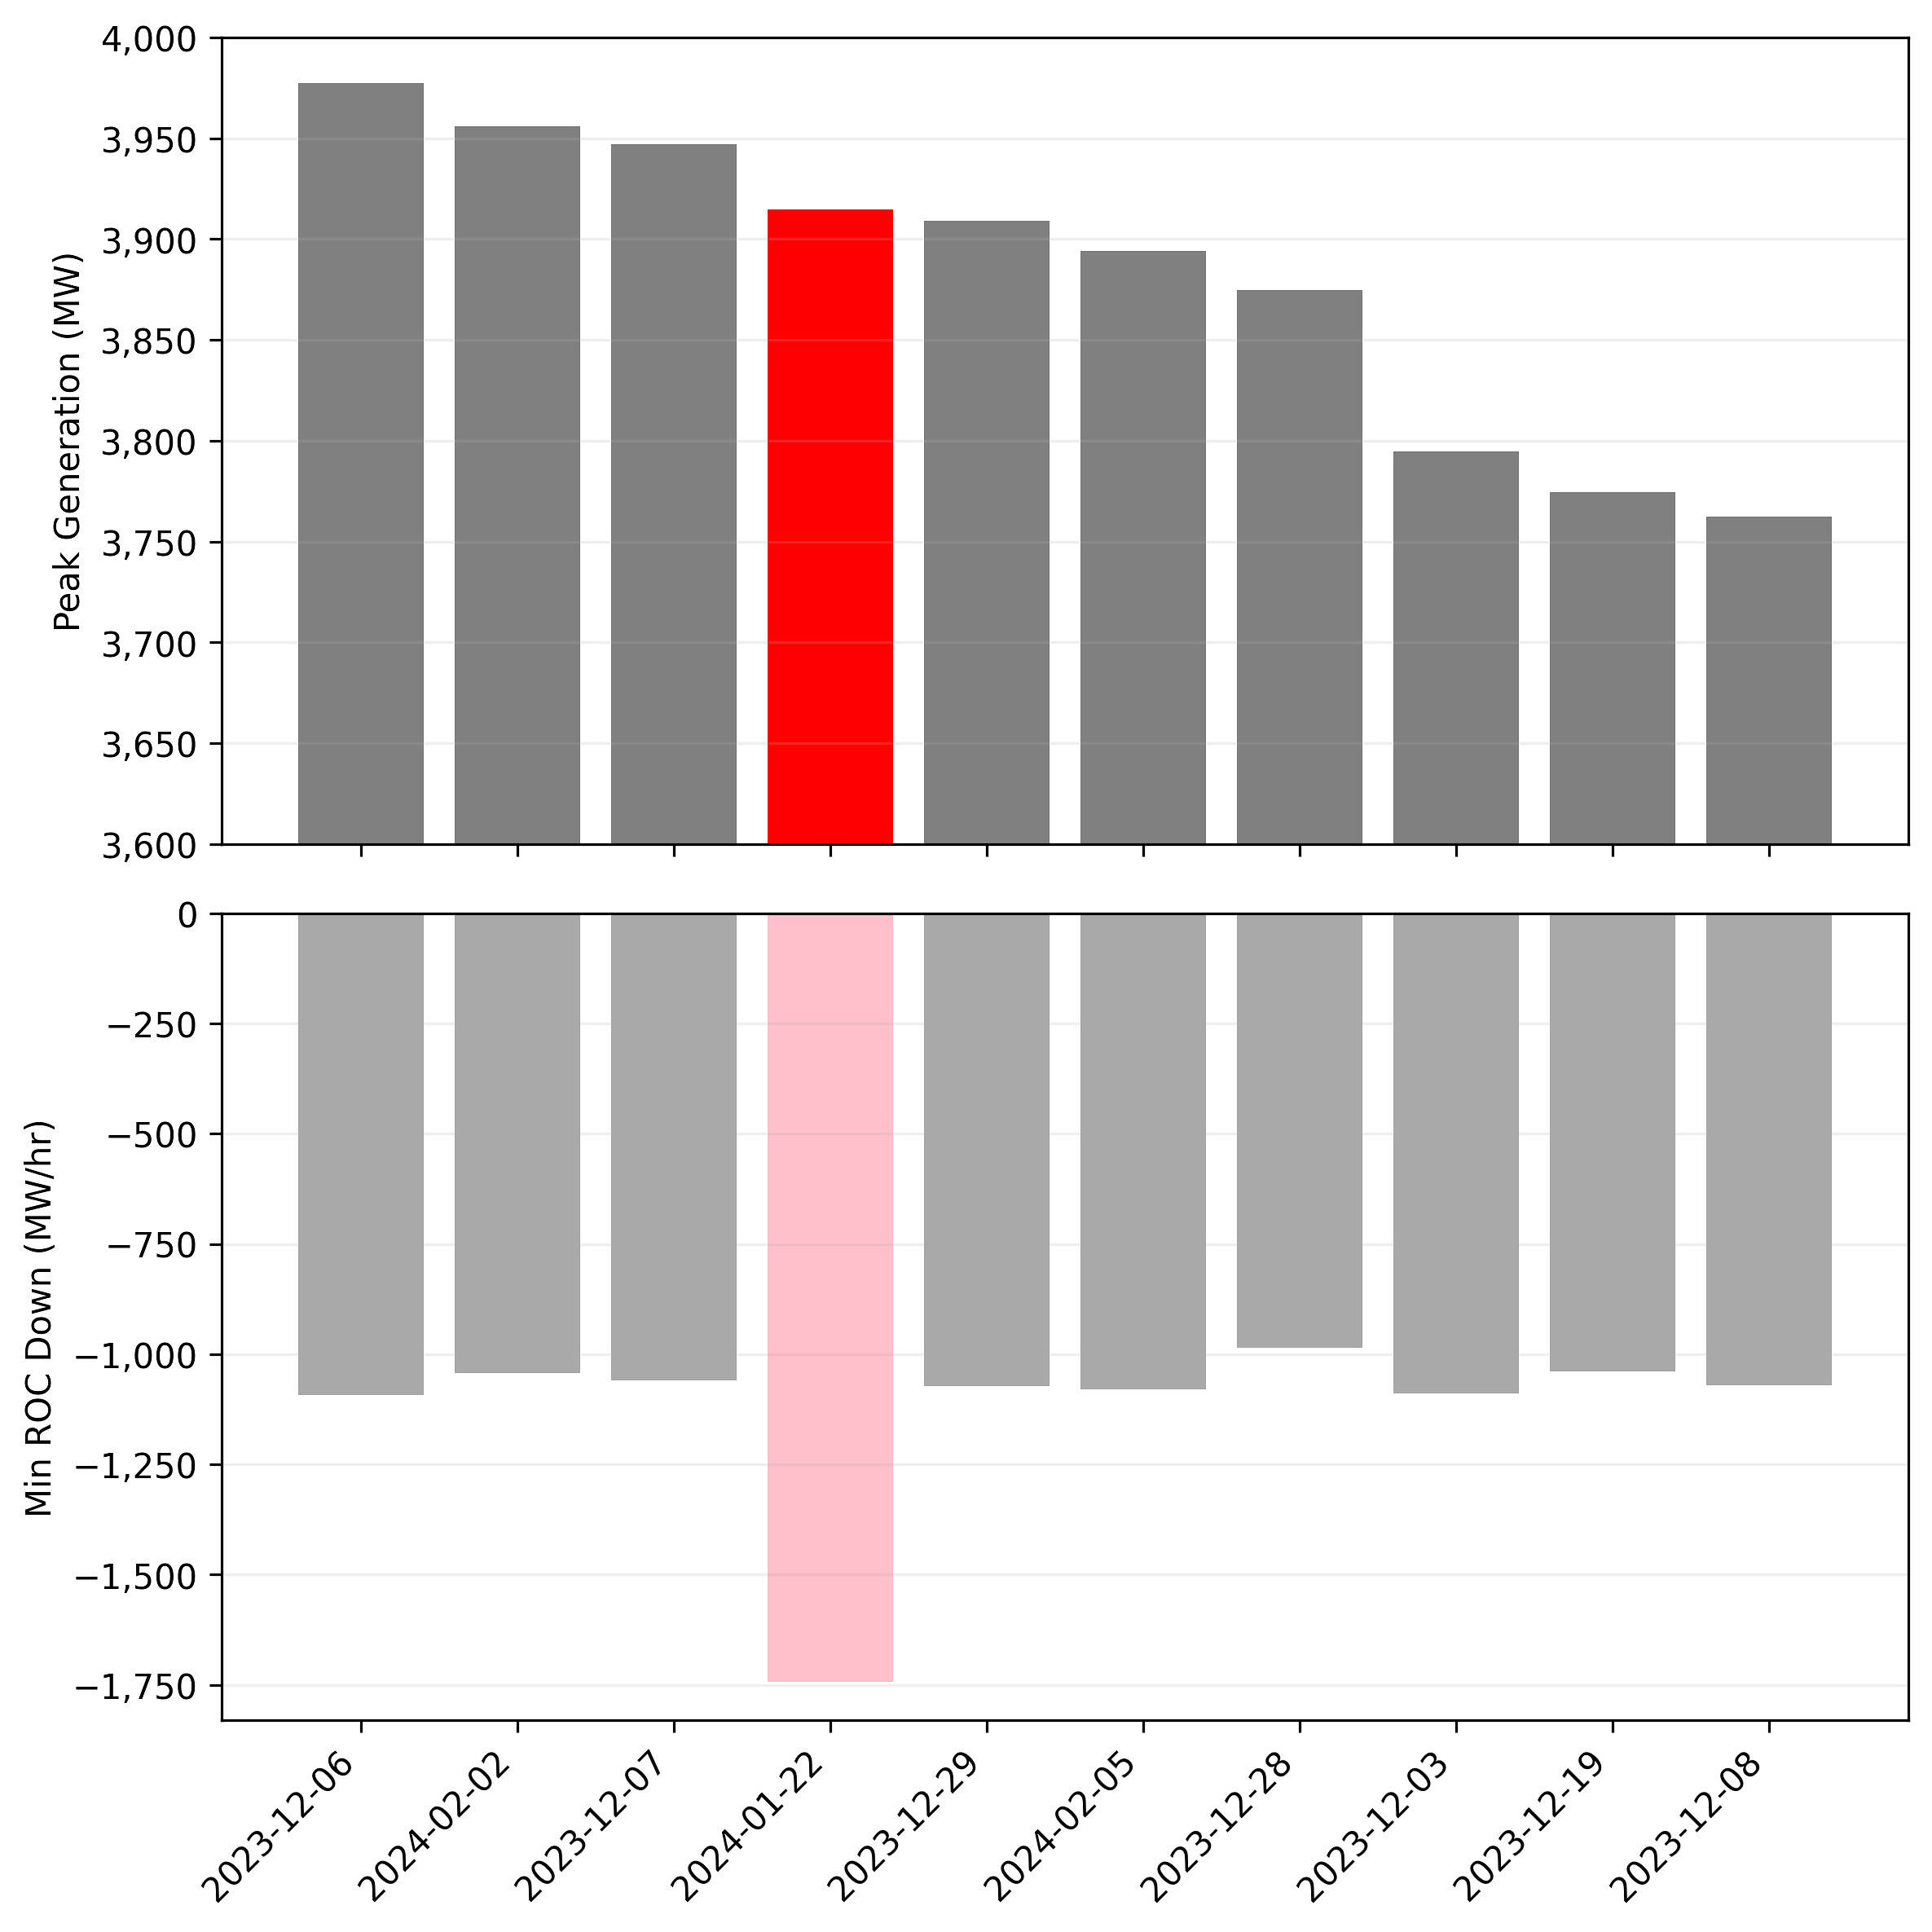
The case study day produced the steepest decline of the season, exceeding 1,500 MW/hr.
Data source: AEMO. Chart reproduced from Lee & Lane (2025).
Forecasting limitations: a central theme
One of the central findings of the paper relates to operational forecasting performance, particularly over the lead times that matter for reserve-activation decisions.
Under the NEM’s current design, the market’s last-line-of-defence reserves — the Short-Notice Reliability and Emergency Reserve Trader (RERT) mechanism — can only be initiated when a credible LOR2 or LOR3 condition is forecast, and only if that forecast occurs with at least three hours’ notice. While this mechanism formally relies on ST PASA demand forecasts, our analysis focused on the more granular and operationally proximate P5 and P30 pre-dispatch forecasts which are expected to be more accurate.
On the case study day, those pre-dispatch forecasts materially underestimated demand at exactly the point when accurate signals were most critical for reserve decisions. As shown in the chart below, the day stands out as a clear outlier for forecast performance, with forecast errors up to 750 MW off even at one-hour-ahead, above the 99th percentile of AEMO’s P30 pre-dispatch error distribution.
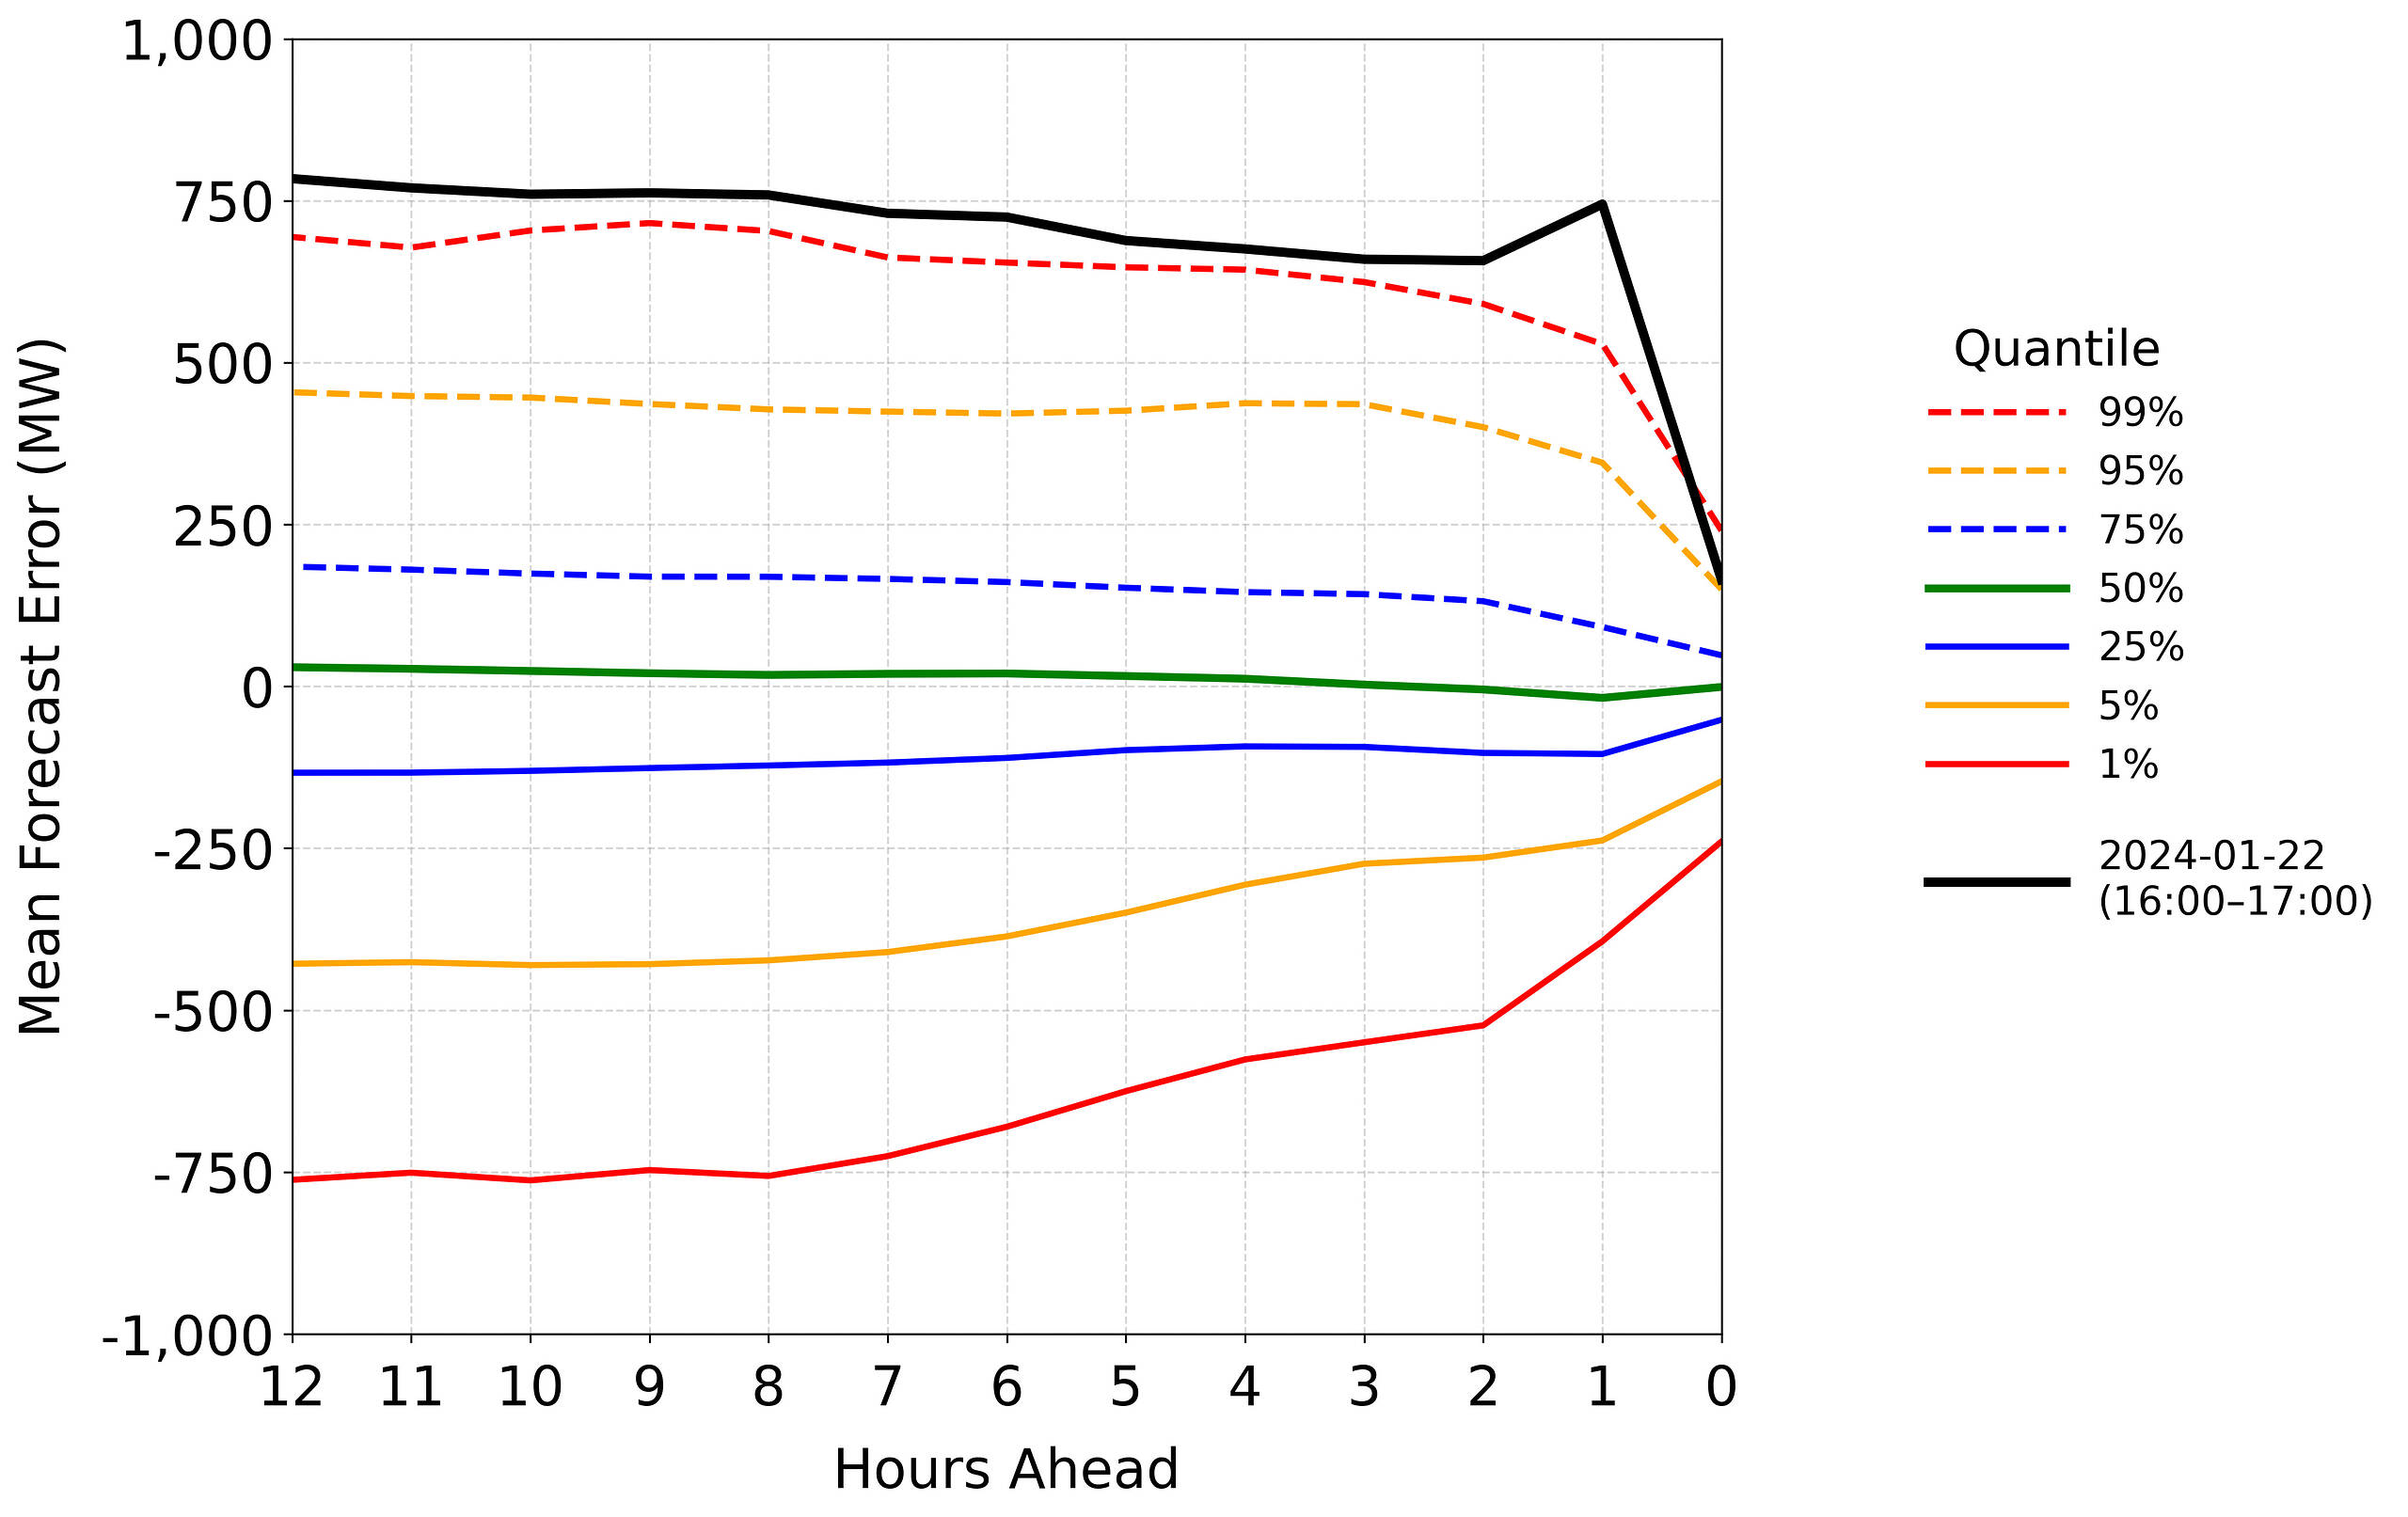
The mean forecast error of AEMO’s P30 pre-dispatch models for QLD demand on 22nd January 2024 for the 16:00 to 17:00 period, compared against the distribution of forecast errors over summer 2023–24.
Note: Forecast error is calculated as actual value minus forecast value. Hence a positive forecast error represent an under-forecast, and vice versa.
Data source: AEMO. Chart reproduced from Lee & Lane (2025).
Errors of this magnitude sat well outside the normal distribution for Summer 2023–24. To provide longer context, we also benchmarked the AEMO P30 models’ demand forecasting performance for the QLD region across seven summers (representing a range of El Niño and La Niña conditions). The violins below illustrate how mean forecast accuracy deteriorated in summer 2022–23, improved somewhat in summer 2023–24, but with a wider error spread — hinting at growing structural volatility rather than a temporary anomaly. Mean forecast error performance also appeared to deteriorate again during Summer 2024-25.
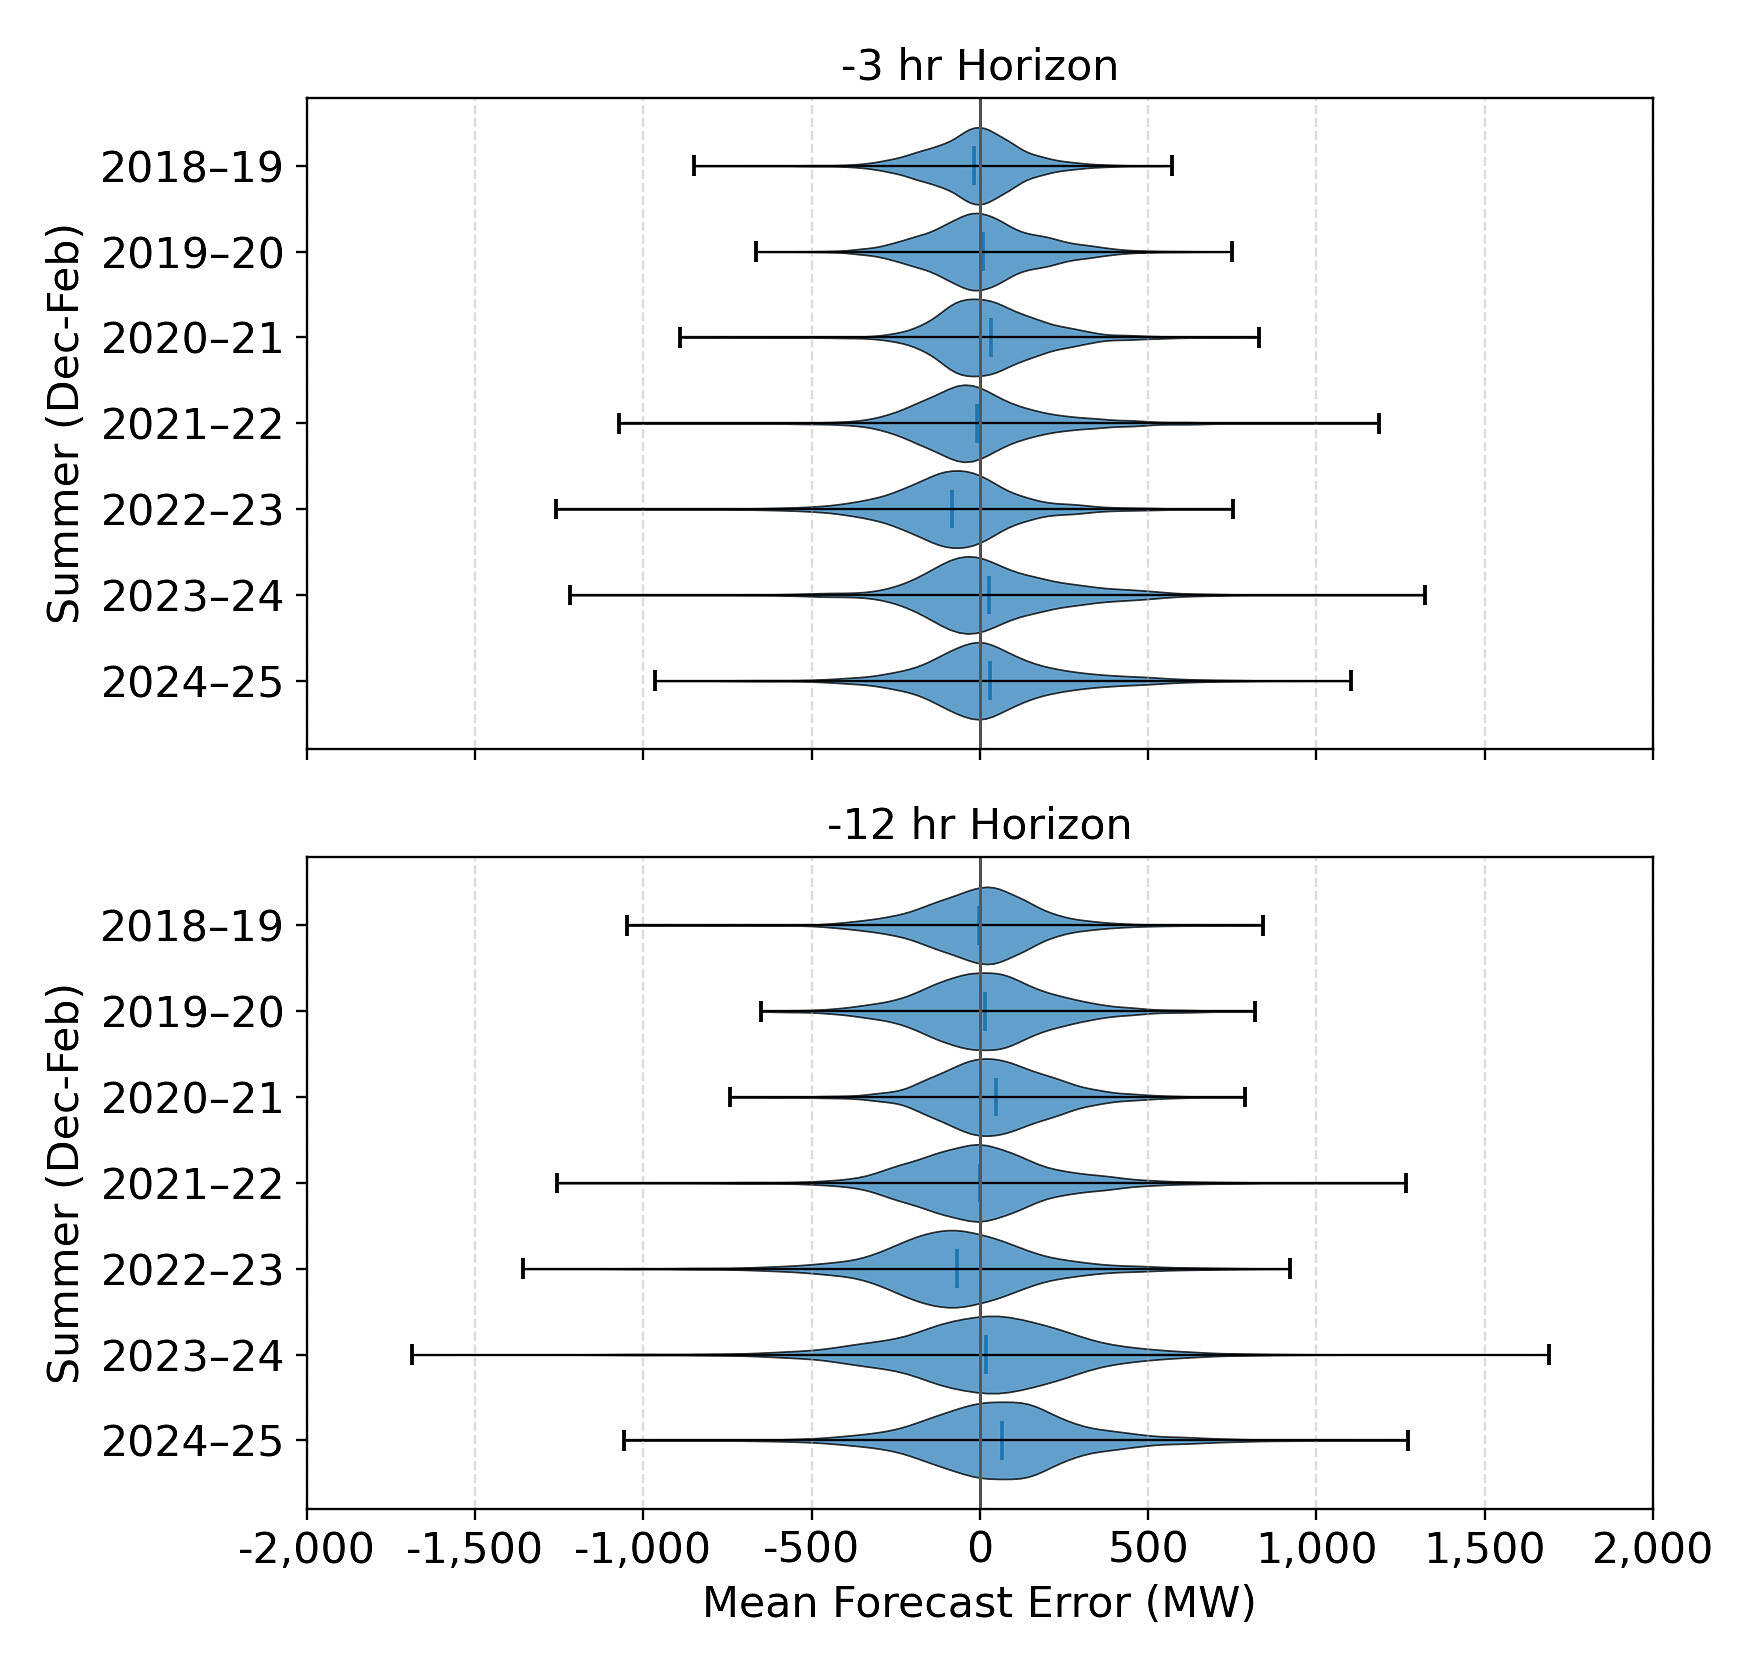
The distribution of P30 forecast errors on a t-minus-3-hour and t-minus-12-hour time horizon for QLD demand.
Data source: AEMO. Chart reproduced from Lee & Lane (2025).
Implications for reserve activation decisions
Importantly, on the afternoon of January 22nd 2024, RERT negotiations did not commence, despite excess available generation for the QLD region falling to just 425 MW. An earlier market notice (Market Notice #113602) at 14:26 announced that an LOR2 condition was forecast for that evening, but this was later downgraded to an LOR1 condition at 16:00 (right before the collapse in small-scale solar generation) — the original market notice stated that the reserve requirement for the region that evening was 631 MW.
To somewhat account for forecast inaccuracies, the calculation of the LOR trigger value considers a Forecast Uncertainty Measure (FUM). This is a metric derived from probabilistic forecast distributions to account for variability in demand and supply forecasts within a 72-hour window in order to increase headroom during events with significant forecast volatility. The FUM, however, is not necessarily designed to capture proximate late changes to forecast values (such as from a sudden unexpected drop in DER output).
Key Takeaways
Formal load shedding was ultimately avoided in Queensland on January 22nd 2024, but the region came far closer than planners or operators would (or should) be comfortable with. At the tightest point, excess available generation fell to just 425 MW, with both the PeakSmart demand-response program and more than 40,000 distribution-network outages materially preventing that number from reaching a lower point.
Stepping back from these details, the case study reinforces a number of overarching themes that are becoming more prominent as the NEM transitions. The paper’s key discussion points and conclusions can be summarised as follows:
- Demand forecast uncertainty appears to be widening at the tail ends in recent years — larger tail-risk deviations undermine the intended operation of reserve-activation mechanisms such as the RERT. It is possible that the shift to El Niño conditions in Summer 2023-24 after three consecutive summers of La Niña or neutral ENSO conditions contributed to forecast inaccuracies especially for the Queensland region. Some evidence also suggests that the AEMO transitioned to machine-learning-based forecasting models during this time, so the model’s early training data may not have been representative of such extreme weather conditions.
- Limited visibility of behind-the-meter DER complicates operational decision-making, especially during fast DER ramps and weather-driven volatility. High rooftop PV penetration increases the magnitude of potential late-afternoon drops, resulting in larger absolute declines when cloud bands move across metropolitan areas.
- The current suite of reliability mechanisms are not always aligned within operational time frames — distribution-level demand response schemes, RERT triggers, and real-time price signals do not always act in a coordinated way. This is despite the fact that each mechanism is, to a large extent, intended to address the same core challenge: managing supply–demand tightness.
Although the paper focuses on a single case study day, we’ve seen similar events elsewhere in the NEM in recent years that exhibit some of these same operational challenges — including November 27th 2024, April 12th 2025, June 12th 2025, among others.
And with Queensland being one of the highest–rooftop-PV jurisdictions globally, this case study may offer an early glimpse into the forecasting and operational challenges that power systems with high DER penetration elsewhere in the world may confront as the energy transition progresses.
—
The full conference paper has been published as part of the conference proceedings and can be found on the IEEE Xplore portal.
Thank you to my supervisor for the project, Dr Joe Lane, and the University of Queensland’s Gas and Energy Transition Research Centre for supporting this work.
Hey Dan, nice paper
Did you look separately at daily max demand / demand at time of minimum reserve? And bucket by max demand?
Anecdotally AEMO was consistently under-forecasting QLD evening peak demand through Q1 2024 – you might hope there was a human in the loop to nudge the forecast in the right direction, it took their model several weeks at least. Constantly had a forecast lower than prior day’s outturn, despite similar or hotter weather…
It’s much harder to unpick now given the impact of rooftop solar, but you did used to see demands outperforming AEMO PD for some time before the forecast changed to something more realistic (see Allan’s forecast progression chart https://wattclarity.com.au/articles/2017/02/initial-analysis-sa-load-shedding-wed-8-feb-2017/ )
Thank you and I agree on all points.
I have made an attempt to create the visualisation you’ve described and it confirms this thinking. Will post as an article in the coming days/weeks (when I find time!)
See here: https://wattclarity.com.au/articles/2025/12/the-long-term-trend-of-forecast-errors-for-daily-peak-demand-in-qld-over-the-past-seven-summers/