
With yesterday’s (19th August 2025) frequency excursion we reflect on challenges in increasing clean energy generation from renewables. It was a few days earlier that, on the 7th, we pondered concerns in ‘Would it even be possible to operate the NEM to achieve 82% renewable energy in 2030 (if the Semi-Scheduled category continues in its current form)?‘
Here, following on from ‘High level view of some contributing factors to 19 August frequency spike’ we review dispatch outcomes on the 19th over the time period that the frequency excursion occurred.
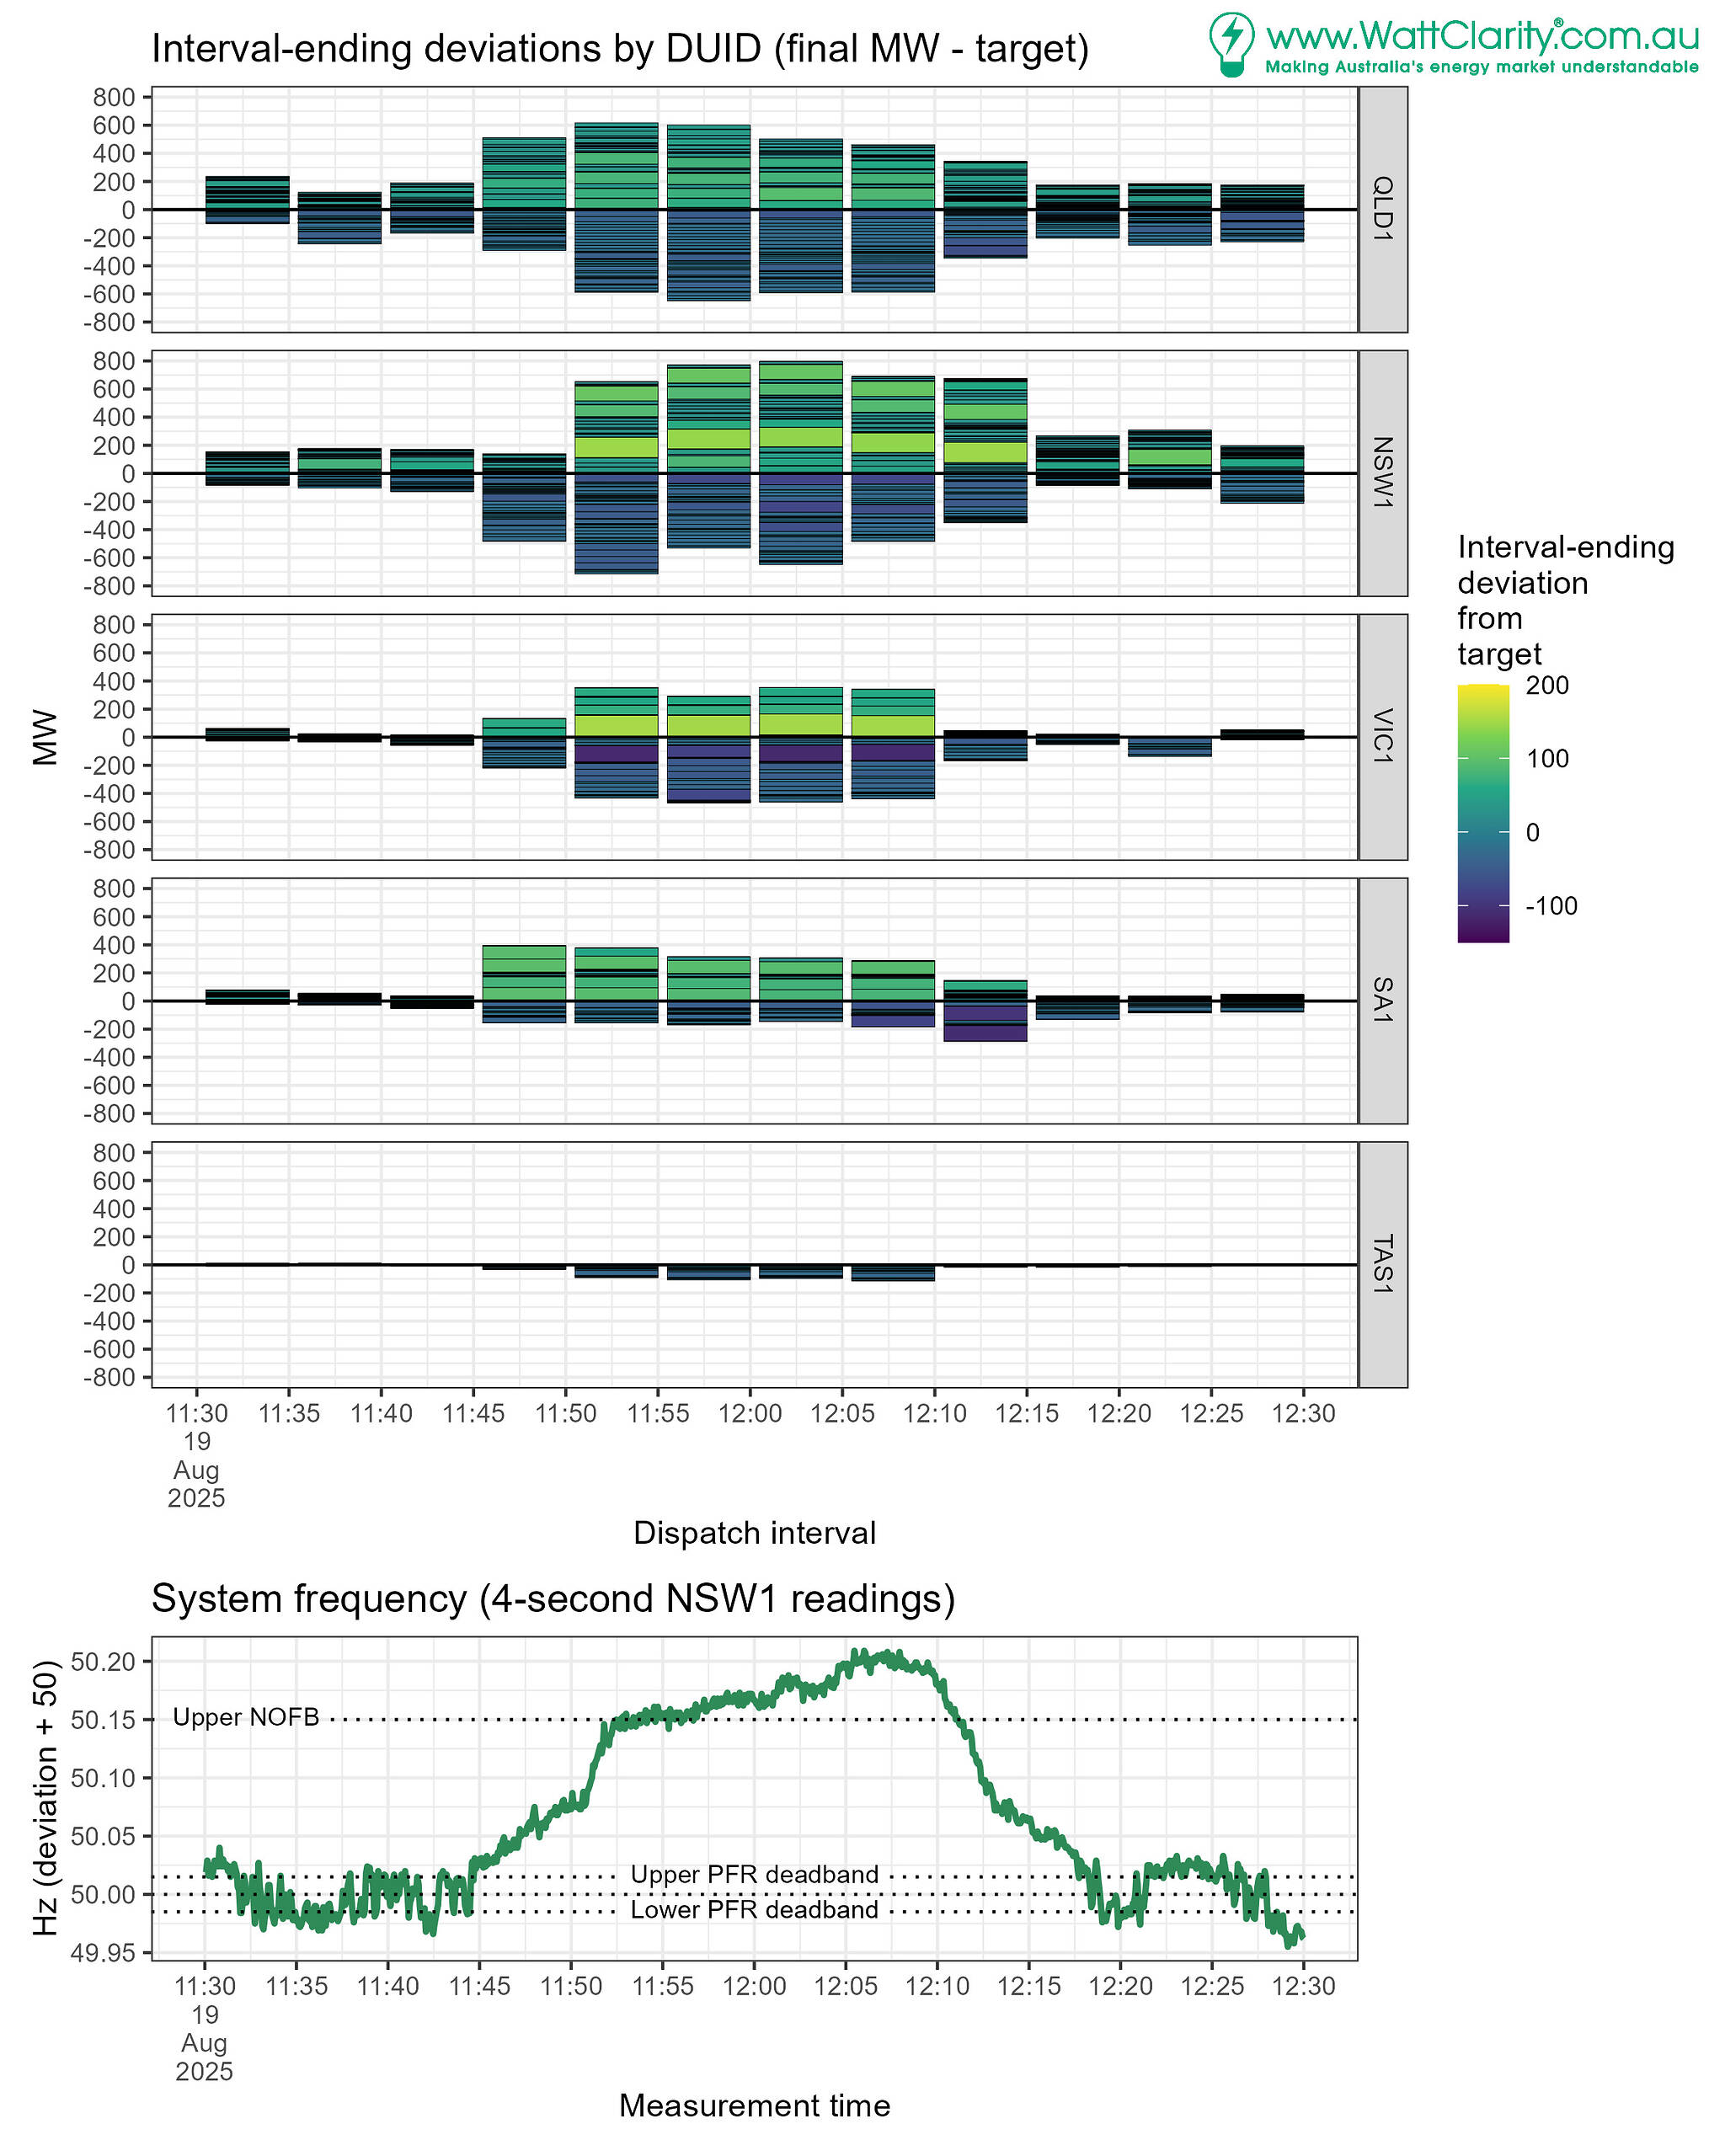
On the 19th, generating units produced higher than their dispatch targets which led to an imbalance between supply and demand. This drove system frequency high.
Units off target
We observe large positive individual deviations from units in VIC and NSW (associated with the lighter colours and larger MW segments in the chart).
To a lesser (but still material in aggregate) extent positive individual deviations are also observed in QLD and SA.
The chart presents interval-end datapoints:
- Units over-producing at the end of the interval have positive deviations.
- Units under-producing have negative deviations.
Positive deviations will have driven the frequency high. Negative deviations (in that 11:45 to 12:20 timeframe) will have restrained it.
Fuel type differences
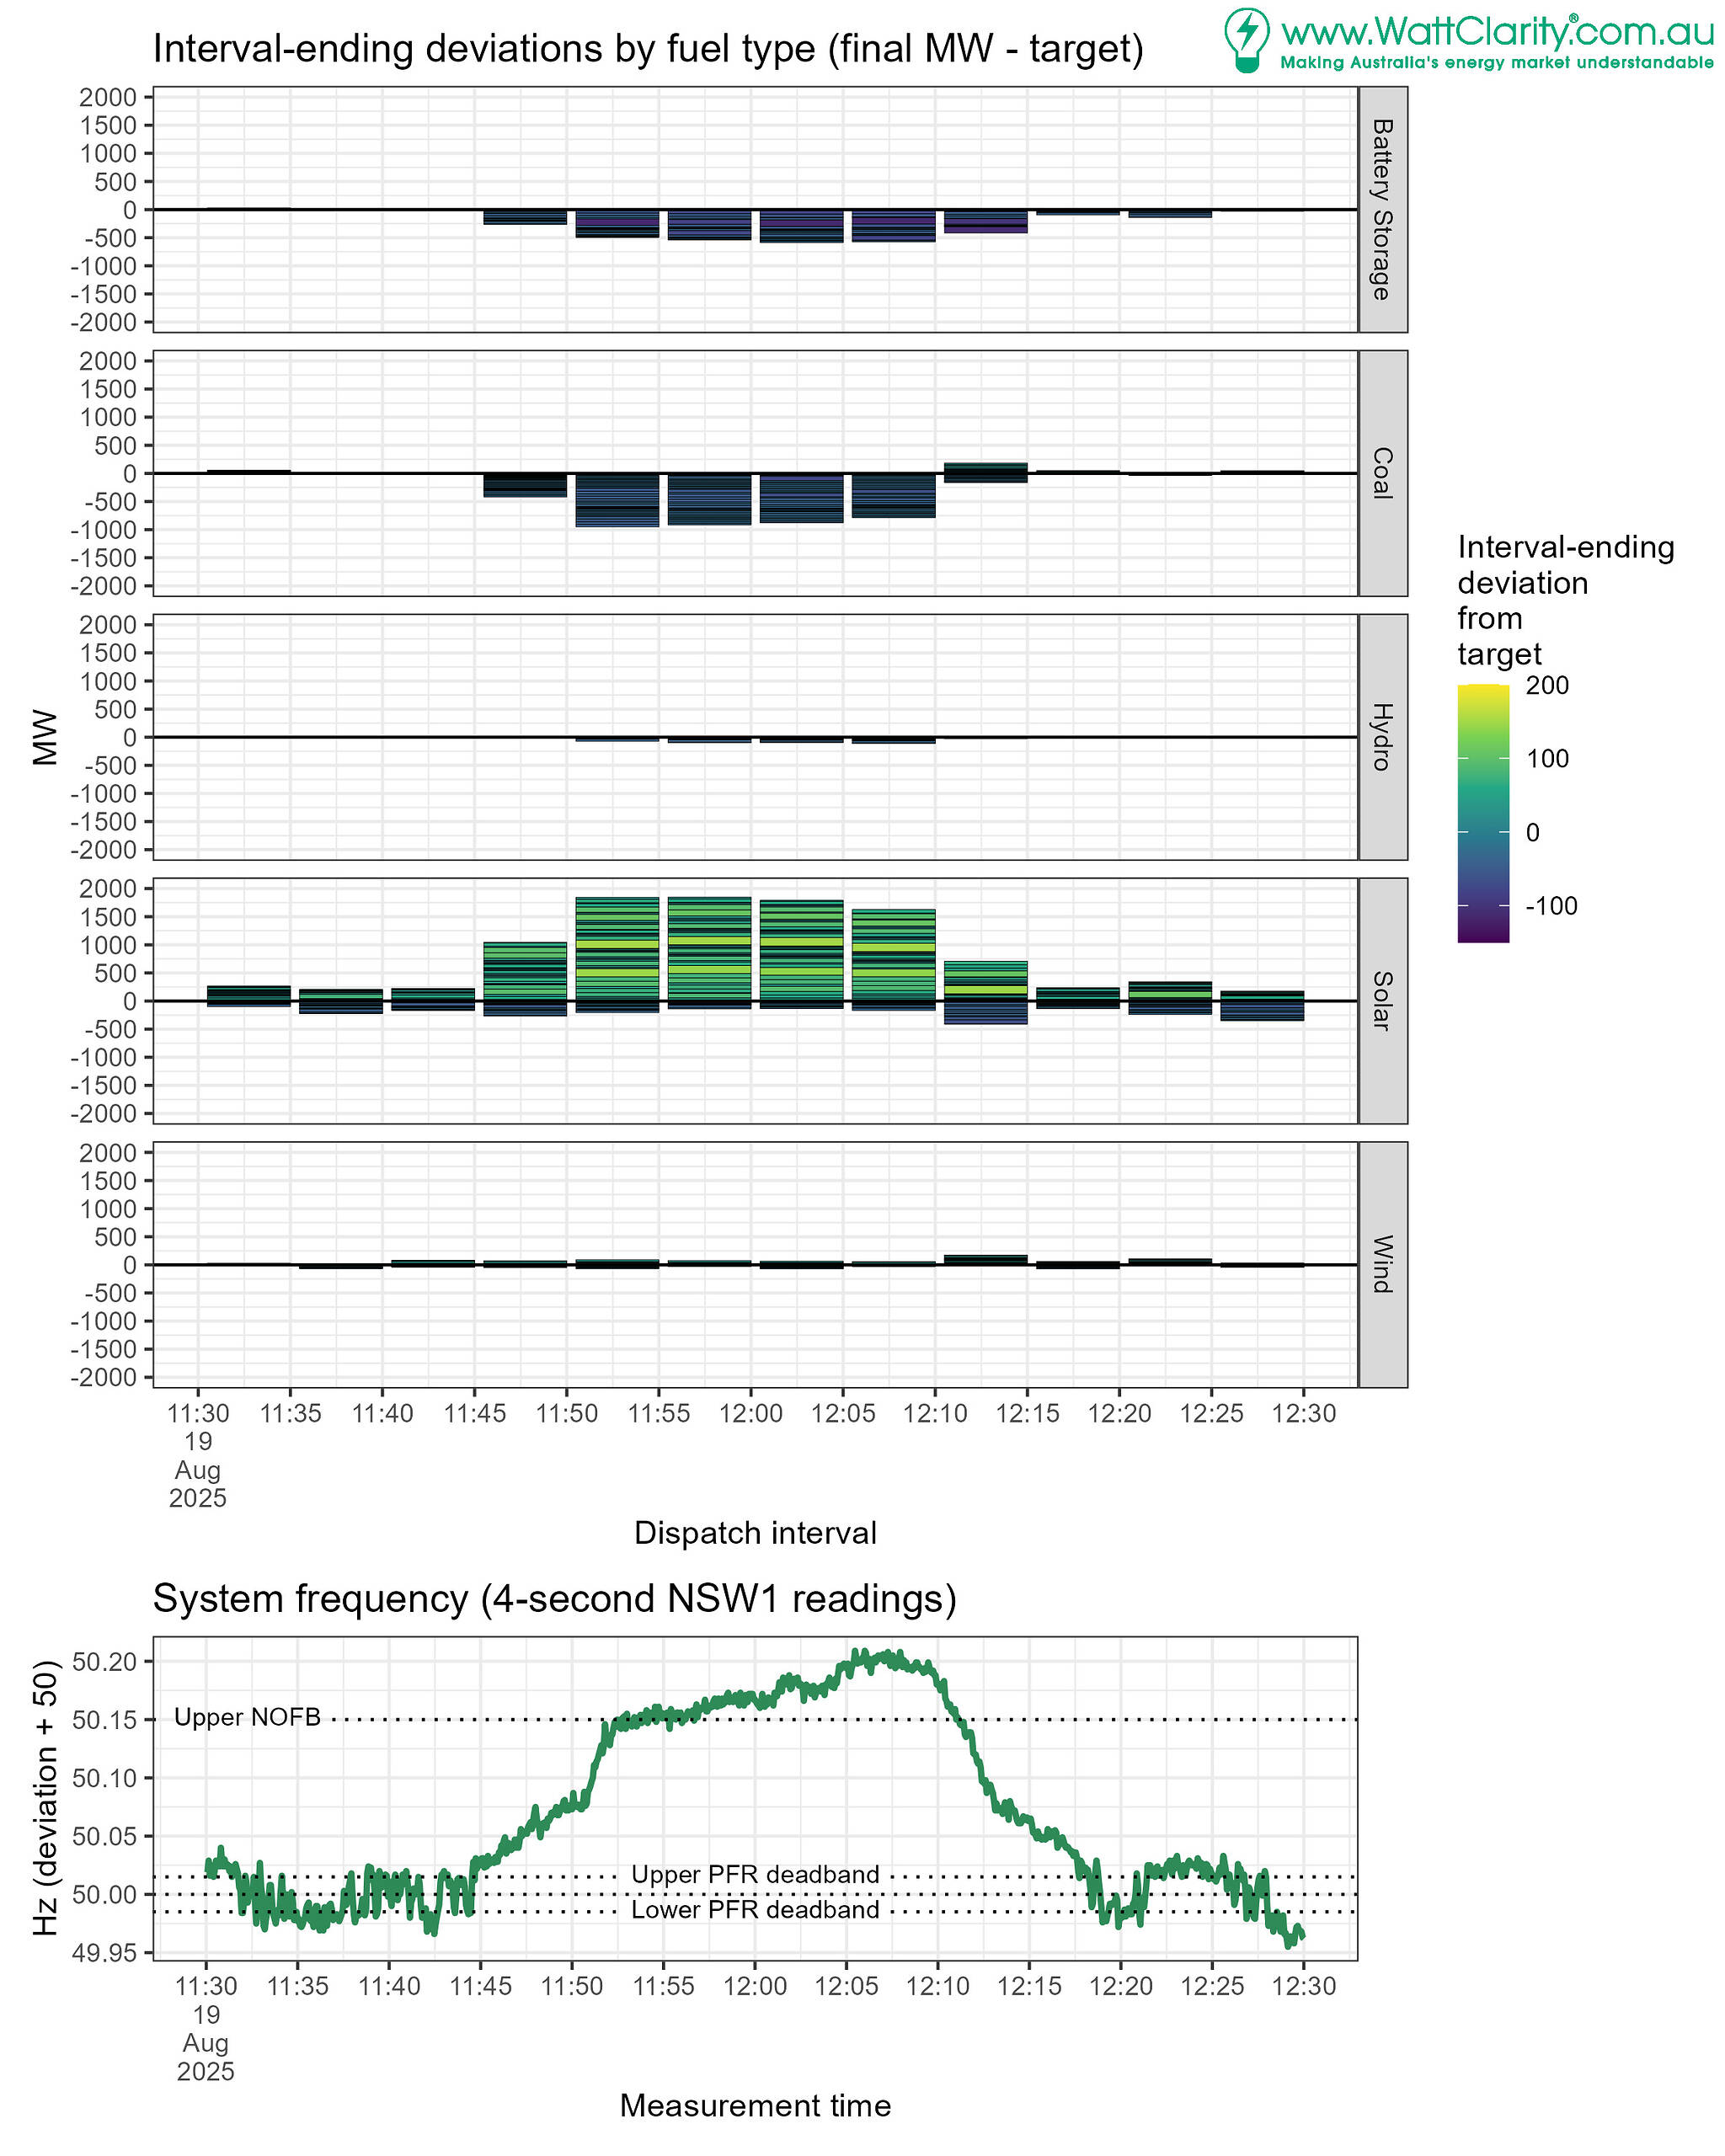
It is evident that some (not all) solar units deviated above target while system frequency was high.
Counteracting the over-production, battery storage, coal and hydro units deviated below target. Many of these may have been enabled for some form of FCAS, in addition to delivering PFR. More on that later.
Wind units appear to have behaved somewhat typically.
Viewing by fuel type we can start to match up prior analysis which indicated that there was a glitch in some solar UIGFs. Solar units deviated above-target when low UIGFs were used to produce low targets (strictly ‘dispatch levels’) that were not met.
In the chart below we present the deviations, separating units by fuel type.
Principally, it was solar units off target
Jumping back to a region-level grouping we review the deviations for just solar units, following findings from the section above.
Many units in QLD and NSW appear to have reduced output (potentially in response to locally detected frequency).
The chart below also shows:
- No solar units are in TAS.
- Positive deviations occurred in all Mainland regions.
- Positive interval-ending deviations dominate with 2 units off by up to 150MW at specific intervals (one in VIC and one in NSW).
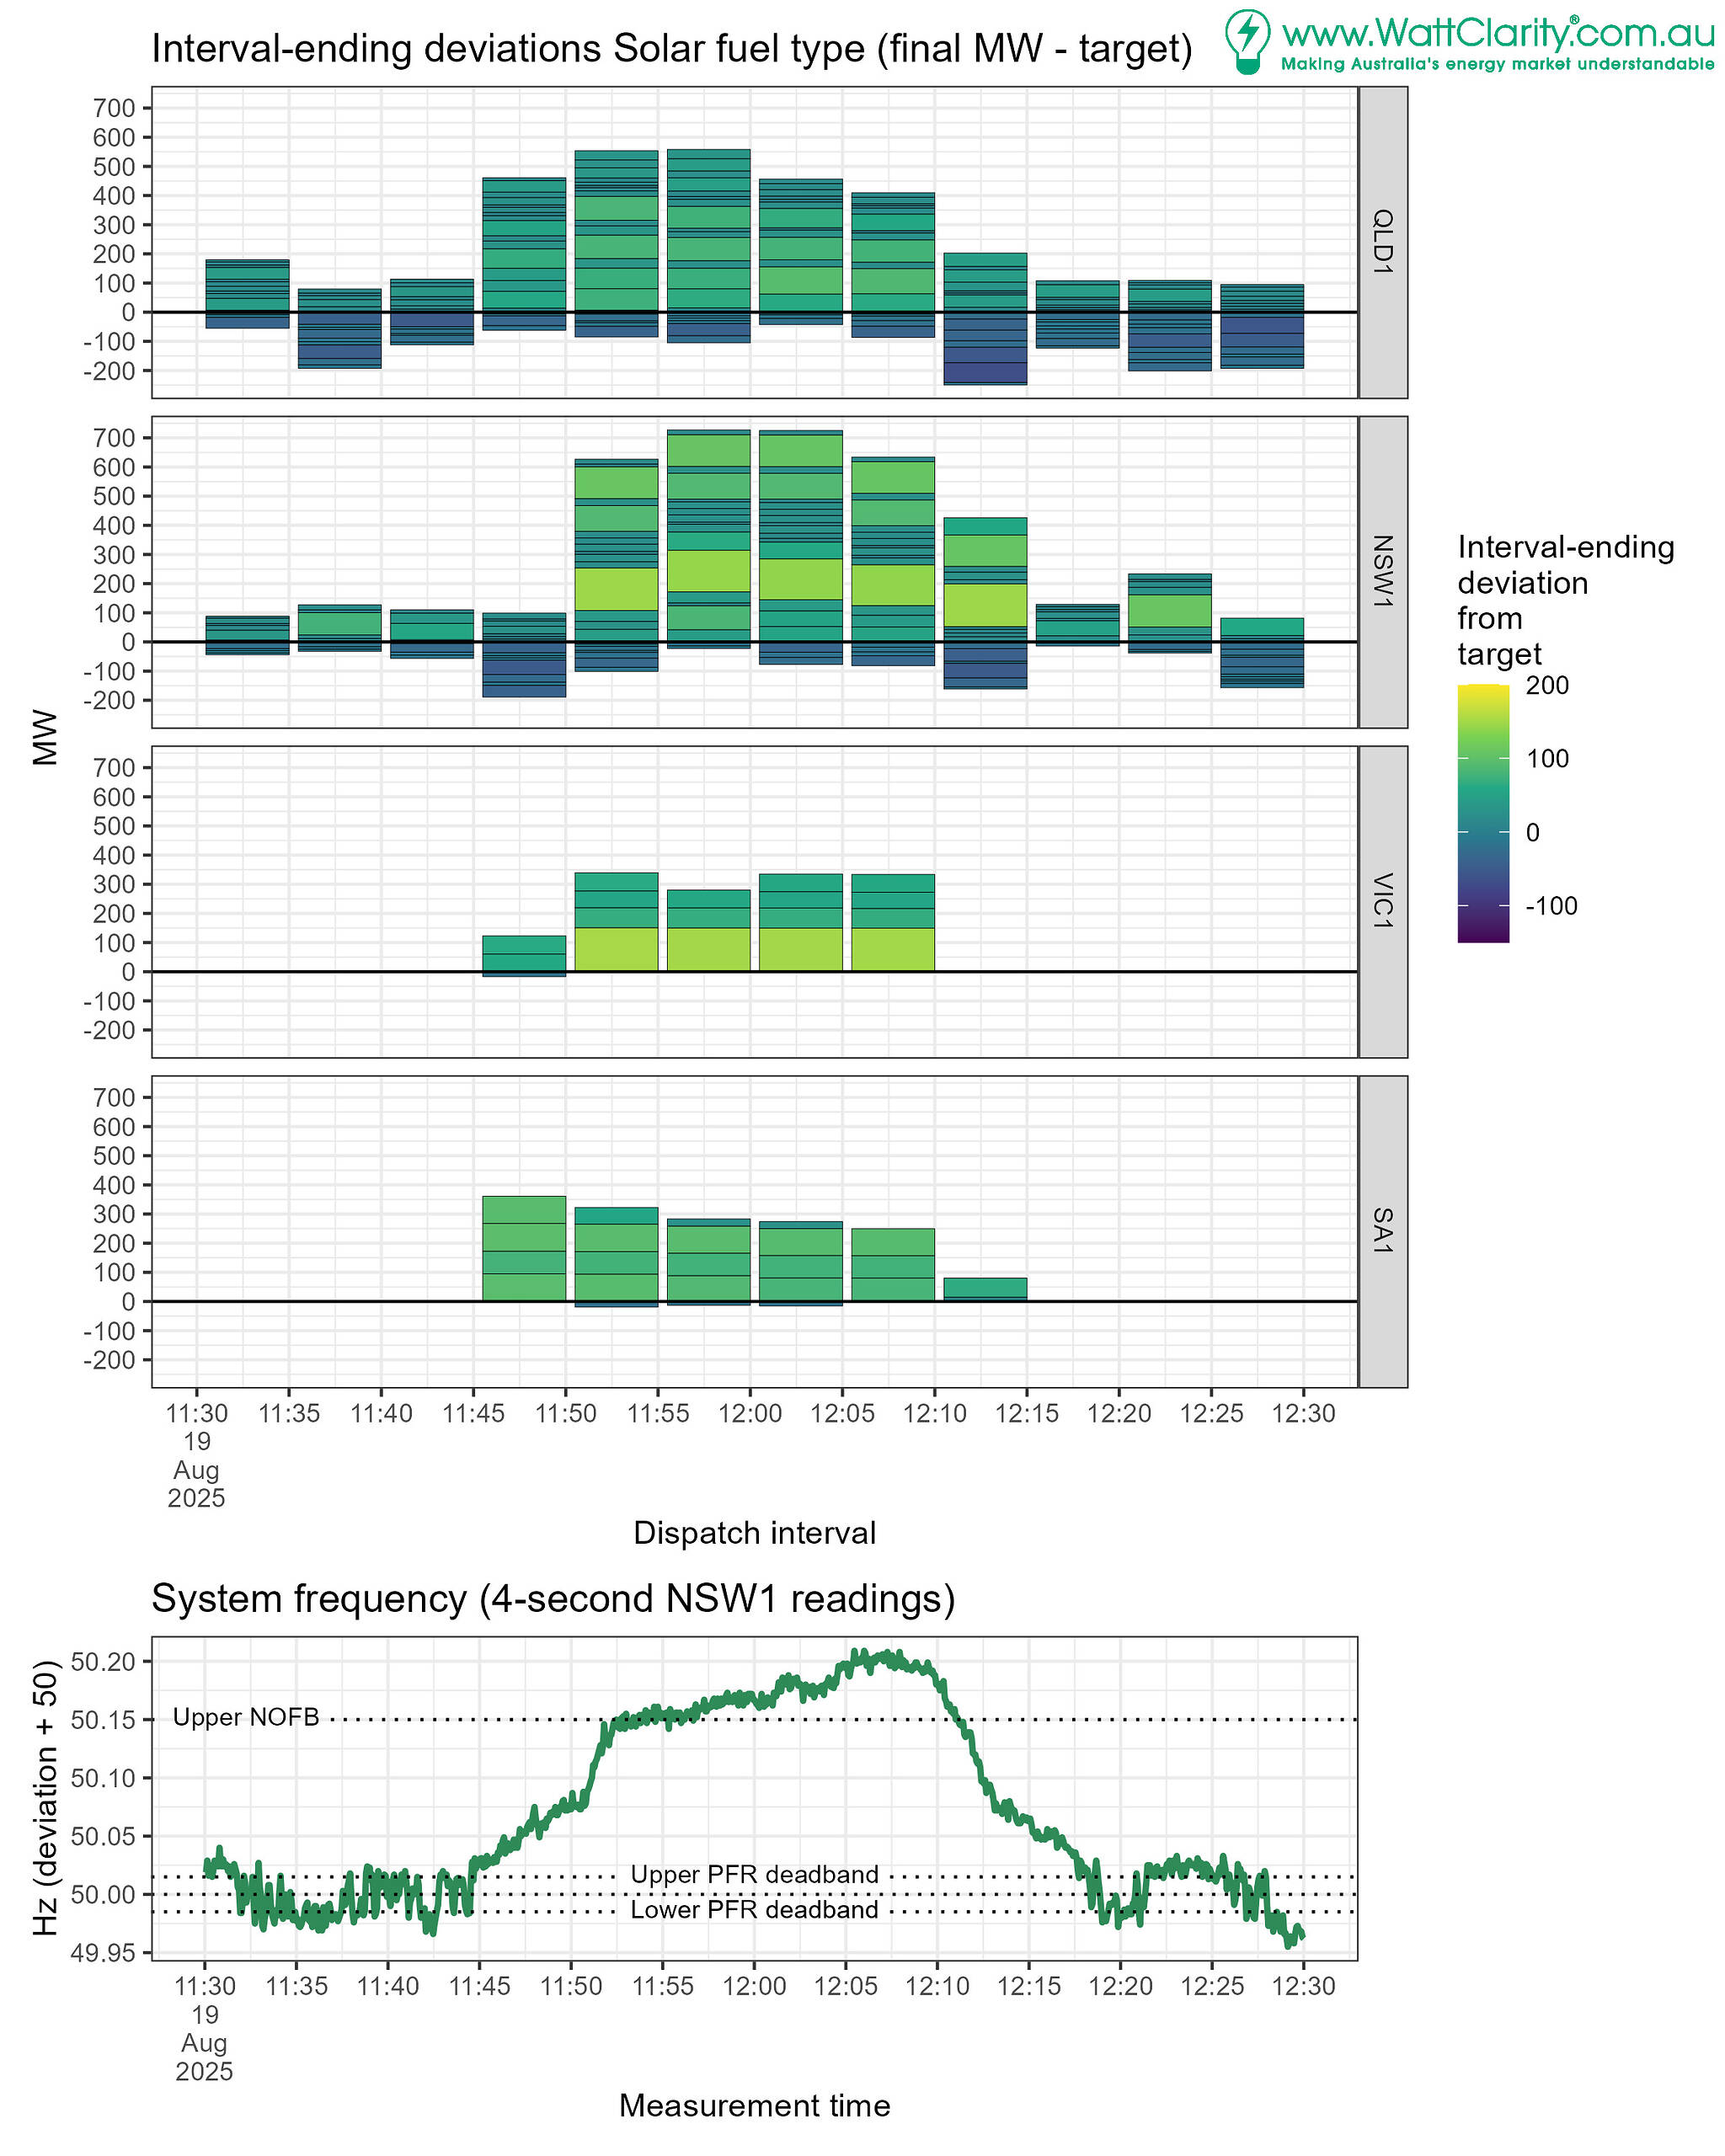
It’s worth noting that semi scheduled units are permitted to deviate from target as the resource varies, in the absence of a limiting instrument (e.g. a semi-dispatch cap which would restrict them from over-producing). The intent is to permit some flexibility in unit output given that there is inherent variability in the renewable resource.
In this case, however, it appears it was the availability used to set the target for dispatch that went awry, rather than the output. See Example solar situation, below.
Units resisted and corrected the imbalance with negative deviations
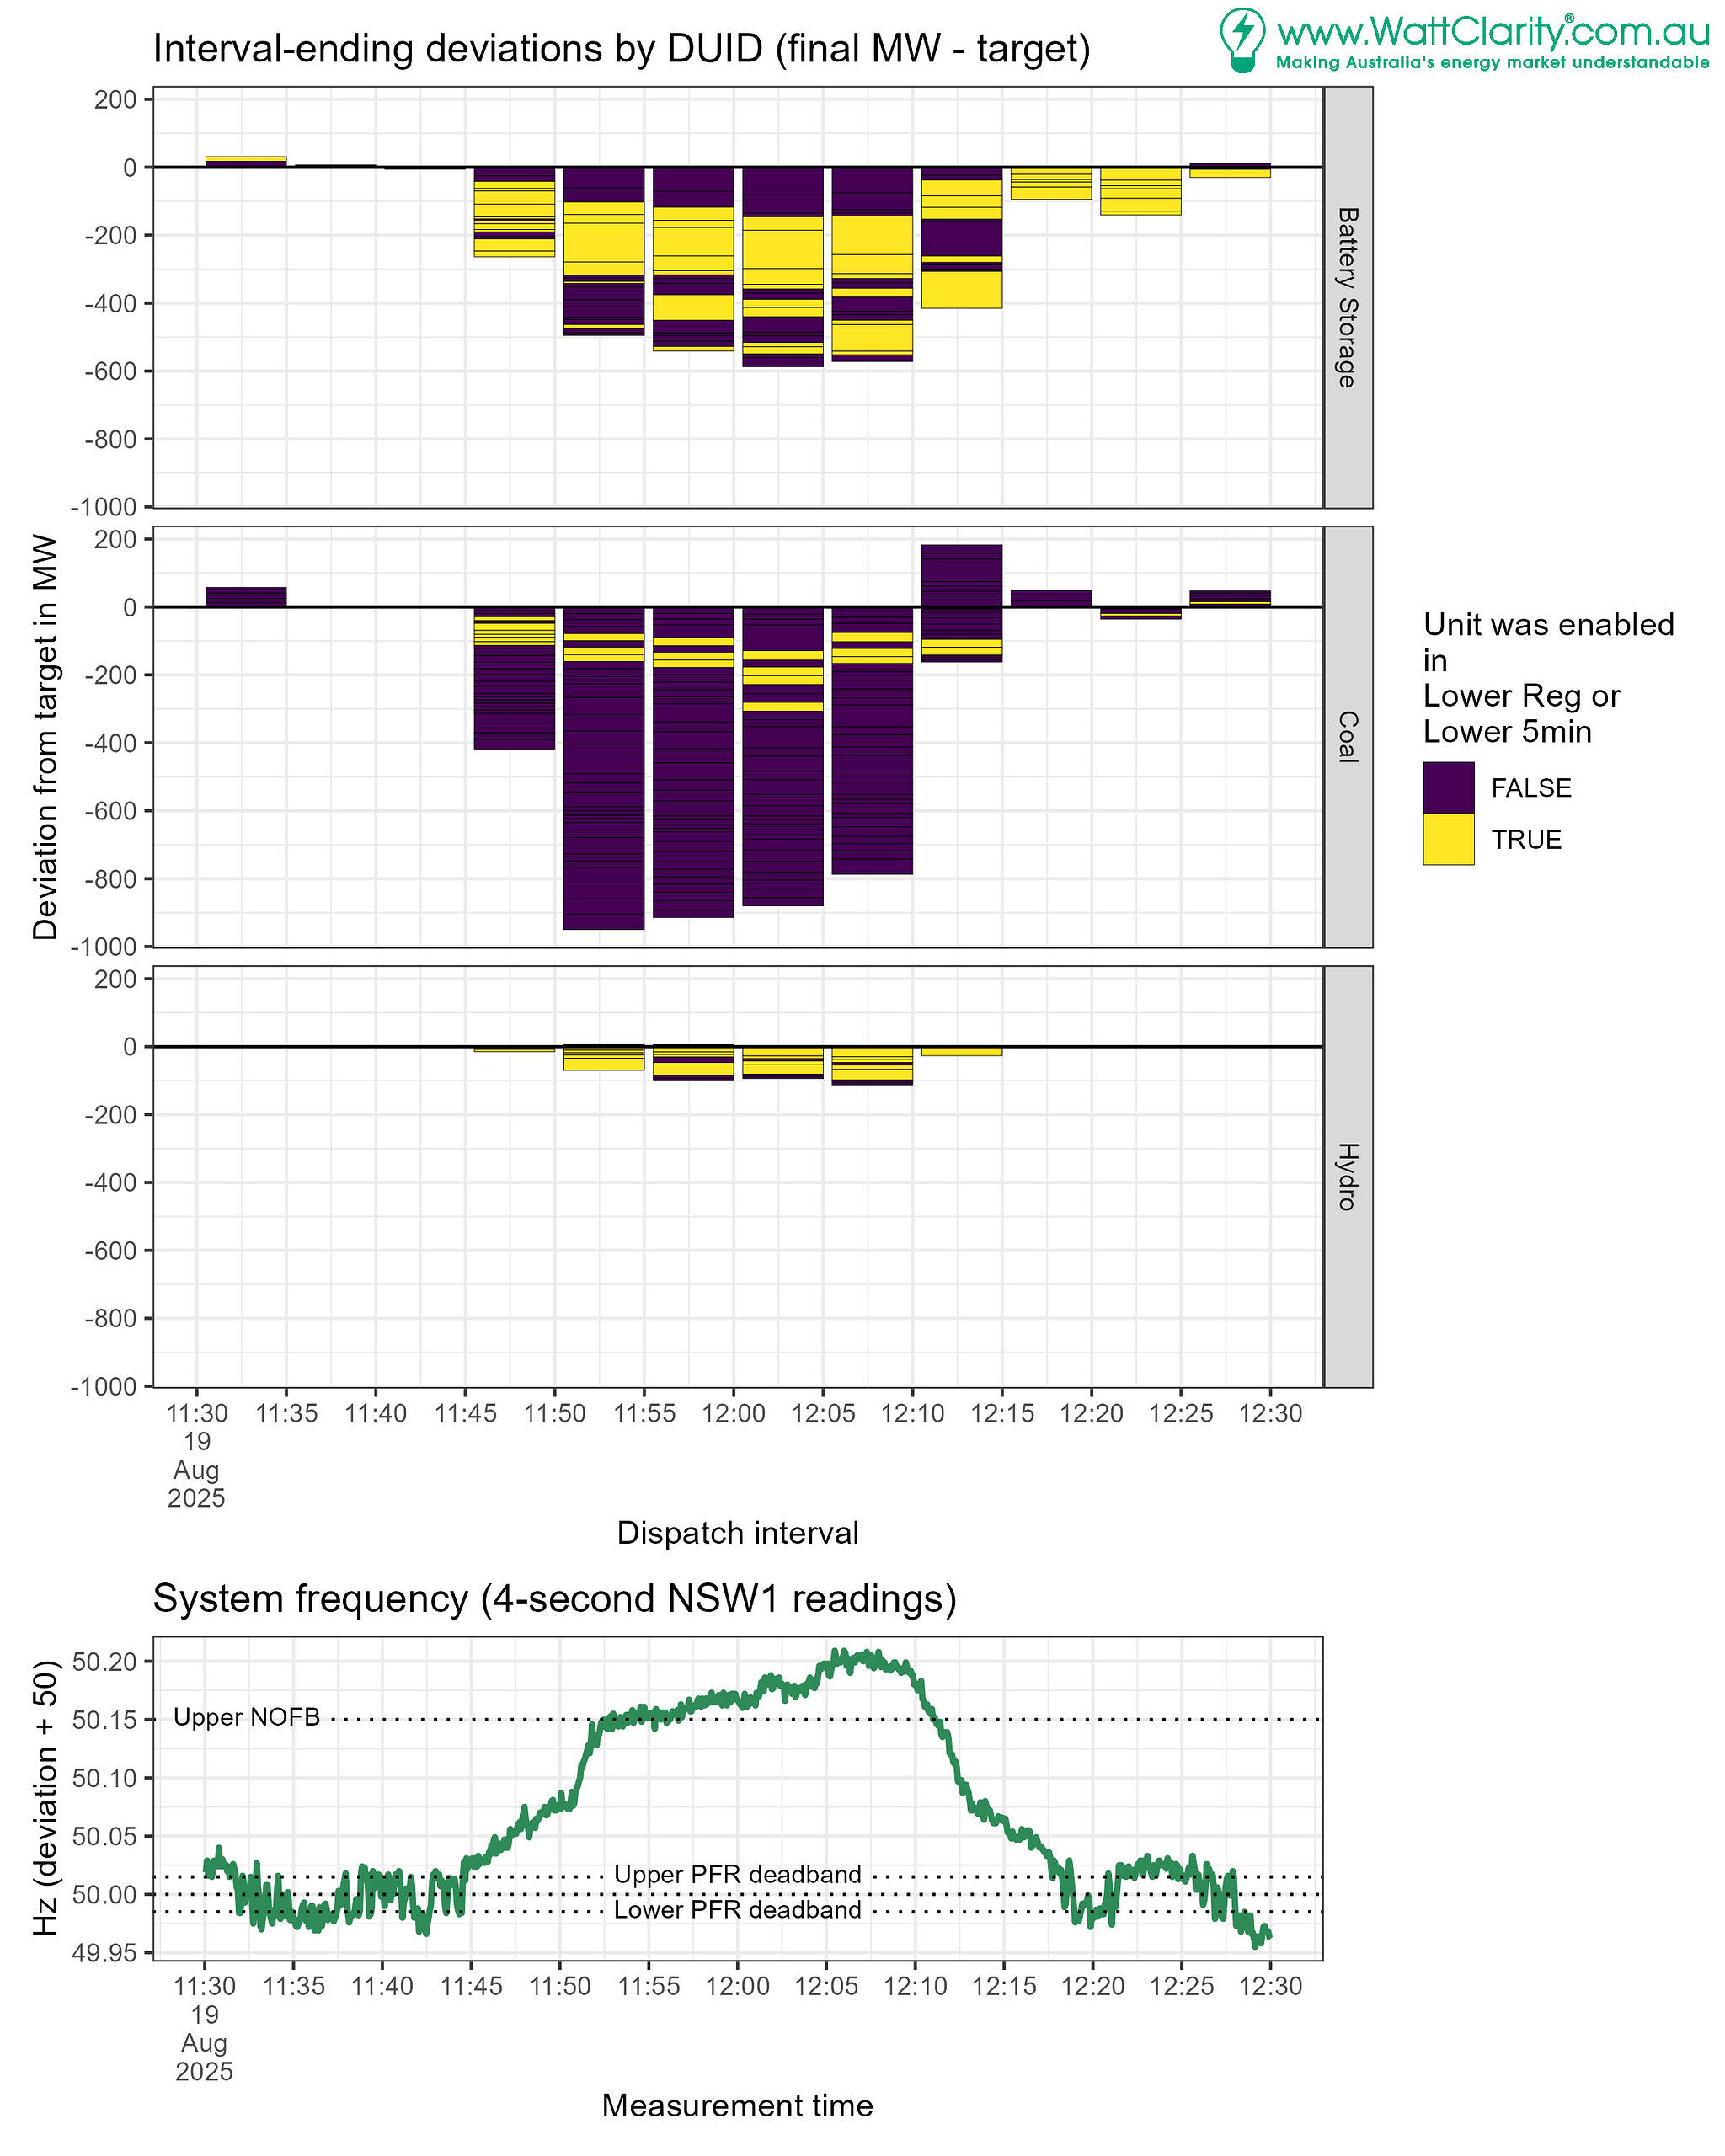
For the key periods when frequency was high (intervals 11:50 to 12:20) we see enabled units having the expected response (deviations low).
Units enabled for lower regulation or 5min services are highlighted yellow in the chart below.
Again, the size of the segment is the MW deviation from energy target.
So, yellow segments should align with negative deviations because, all else being equal, the frequency deviation should have been enough* to trigger regulation services and also contingency responses. (*correct me if wrong, but contingency FCAS responses will trigger when the locally detected frequency is outside the NOFB). Further, because we are assessing interval-ending responses and the frequency excursion was so persistent we anticipate units enabled for regulation and lower 5min responses should have been active at the end of the interval. Faster contingency responses will have already been and gone by the end of the interval.
Non-conformance constraints
The following units received non-conformance (NC) constraints toward the end of the event.
We used the ez2view unit dashboard to understand why, presenting findings as follows:
Units identified as under producing, presume responding to frequency (intervals when NC constraint was applied):
- BW02 (12:20)
- CAPBES1 (12:20)
- MP2 (12:20)
- RESS1 (12:20)
- WTAHB1 (12:20 and 12:15)
- GREENB1 (12:20)
- TARONG3 (12:20)
- WDBESS1 (12:20)
- LYA1 (12:20)
Units identified as over producing, typically generating at unconstrained high output while availability and target was 0MW:
- BNGSF2 (12:15 and 12:20)
- TBSF1 (12:15 and 12:20)
- WANDSF1 (12:15 and 12:20)
- MOUSF1 (12:20 and 12:25)
- RRSF1 (12:20 and 12:25)
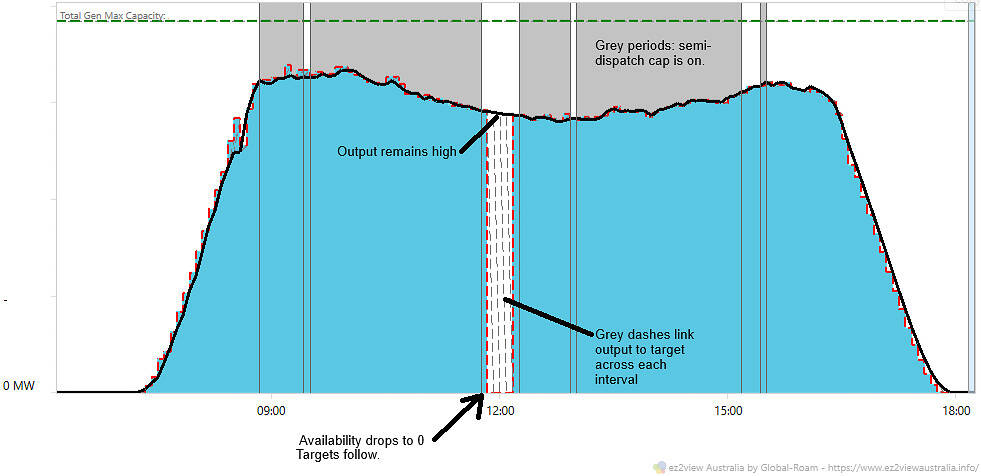
Example solar situation
Here’s the typical profile of a solar unit that experienced the glitch. We’ve annotated a screenshot from ez2view‘s unit dashboard,
- Availability went to 0 MW but the unit continued generating.
- There was no semi-dispatch cap forcing it to do otherwise.
- In fact, the semi-dispatch cap that was present in intervals prior was lifted when the target availability and target went to 0 MW.
Considerations
The events provide a reminder of how the semi-scheduled category operates, motivating us to consider whether the semi-scheduled category is sustainable in the long-term.
This includes how we manage the increasing role that technology plays in the power system, our reliance, and its robustness to unexpected events.
Notes
When presenting deviations from target we included only those where the absolute deviation was greater than 6MW to avoid obfuscating the more material deviations.
Sometimes at Watt Clarity we refer to dispatch error (this is reported in the Unit Dashboard) which is Target – Final MW. In this article we have gone with deviation as Final MW – Target to align positive deviations with upward pressure on frequency.
This situation will continue while the political imperative of (uncontrolled) renewables at any cost exists. I think that every grid scale solar (and possibly wind) installation should be required to have a battery system capable of producing and absorbing power to limit the rate of change of power generation so that other generators have a chance to react.