It was back on 3rd March 2024 that we posted ‘A long-range trend of large instances of Aggregate Raw Off-Target (AggROT) across all Semi-Scheduled units’ as part of the number crunching for for GenInsights Quarterly Updates for 2023 Q4.
1) So that analysis covered a time-range to 31st December 2023
2) It showed sharply escalating levels of collective underperformance across the entire Semi-Scheduled fleet.
Since that time we made the decision (due to escalating levels of busyness) to suspend our number crunching for GenInsights Quarterly Updates … so it’s been a while since we have had a chance to look at the latter trend of this metric.
There’s a few reasons prompting us to re-open this analysis and look at updated numbers to 30th June 2025 (i.e. covering an additional 18 months of time).
Brief recap of the concern
It was back in the GRC2018 that we commenced looking at a metric that evolved into the ‘Aggregate Raw Off-Target’ metric (AggROT) in GenInsights21, and which we use today. It represents an aggregate level of under-performance or over-performance with respect to a group of units
In GenInsights21:
1) We looked at AggROT for all remaining coal units, with that metric trended back in time over 20 years to ensure directional consistency
… this provided some insights into changes in what we termed as the level of ‘dependability’ of the coal units.
2) We also looked at AggROT for all Semi-Scheduled units,
As noted in yesterday’s article, we have been asking questions about the ongoing scalability and sustainability of the Semi-Scheduled category above.
1) There have been many articles written exploring different aspects of this – with a select few we’ve chosen to include in the focused category ‘Is the Semi-Scheduled Category Sustainable or Scalable?’.
2) Just to clarify (once again) these specific questions:
(a) Are not related to the variable nature of the underlying (i.e. VRE) energy resource;
(b) But moreso related to the manner in which they are enabled to operate under the current Rules.
… and specifically that these units are not required to ‘meet’ their Target in any given dispatch interval, with the most stringent requirement (from a Conformance Status perspective) just being the need to see the Target as a Cap, and only then during Dispatch Intervals.
The concern is that, as an increasing number of larger instances of under-performance or over-performance occur over a growing fleet of Semi-Scheduled assets, frequency control will probably become increasingly difficult to achieve – even despite recent enhancements, such as:
1) The re-implementation of Primary Frequency Response (progressively across tranches); and
2) The implementation of Frequency Performance Payments from Sunday 8th June 2025.
Hence (as noted yesterday)
1) whilst the significant frequency deviation last week on 19th August appears to have been caused by some glitch in UIGF from self-forecast of a significant number of solar farms across the NEM
2) it also points to the possible implications for frequency when the grid encounters an AggROT of the magnitude of –1,500MW across Semi-Scheduled assets.
3) which makes it more important to revisit the earlier trends to see how quickly the large exceedances are growing.
Trended incidence of large instances of AggROT for Semi-Scheduled units
With data to 30th June 2025 we’ve re-crunched the numbers and present three trends below that count the incidence (i.e. # Dispatch Intervals each year) of instances of large under-performance (positive AggROT) or over-performance (negative AggROT) across all Semi-Scheduled units.
In reviewing these trends, keep in mind that the playing field is progressively changing over time – including in two big ways:
1) Firstly, the installed capacity base of Semi-Scheduled units is continuing to grow;
… and, based on patterns seen 18 months ago, (in the absence of some other counter-acting change) we would expect to see these instances
2) But also (as noted above) we’ve seen some positive changes that should (we hope) act to slow down this escalation in incidence of large instances
… but we continue to ask, will (just) these measures be enough?
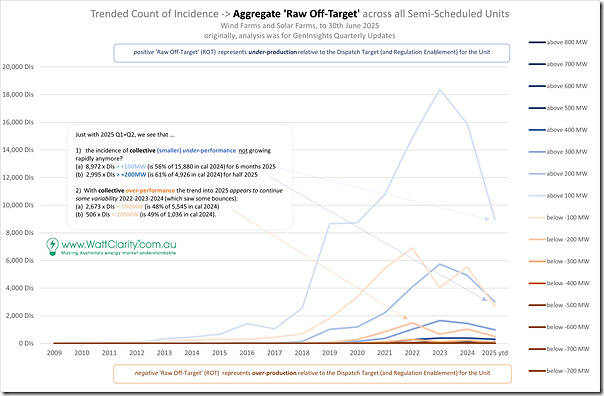
Incidence of 100MW and 200MW collective exceedance
In this first chart, we trend the progression of instances of 100MW and 200MW:
We can see that the count of incidence grew quickly to 2023 (though not without some bumps), but that growth has moderated since that time.
… based on half-year results for 2025, it looks like:
(a) Incidence of under-performance might be higher for full year 2025 than 2023 … but with the growth rate considerable slower than 2021-2022-2023
(b) Incidence of over-performance might be roughly the same for full year 2025 compared to 2023
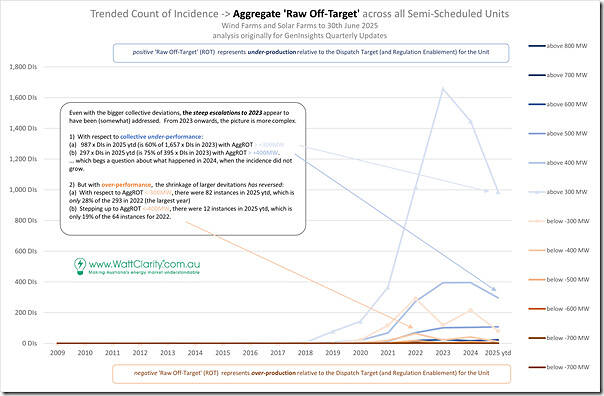
Incidence of 300MW and 400MW collective exceedance
Stepping up to larger exceedances, we see the following:
Also in this trend, we see that the momentum to 2023 was reversed to 2024, and that 2025 looks to be higher than 2023, but not by the same growth rate 2021-2022-2023
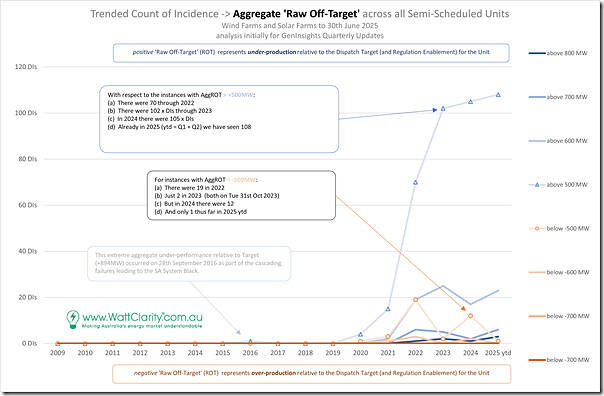
Incidence of 500MW and 600MW collective exceedance
One step further up, we see the following:
Because it’s the largest incidents that are of most interest to us (on the basis of them probably having larger system-wide effects, including on frequency – and the supposition that this incidence will continue to grow) we will invest more time, as it is available, to look at some of these specific large instances.
1) At just more than 100 instances of >500MW under-performance (averaging 2 each week across a year … or potentially double that number for 2025), that’s too many to list and pursue individually;
2) So we have (somewhat arbitrarily) drawn the line at 600MW as the (smaller) list:
(a) that’s now published in the follow-on ‘An updated tabular list of instances of large AggROT across Semi-Scheduled units’ article;
(b) which will be a source we can refer back to for subsequent Case Studies with respect to events in that 18-month time horizon (January 2024 to June 2025).
Growing levels of AggROT for Semi-Scheduled units
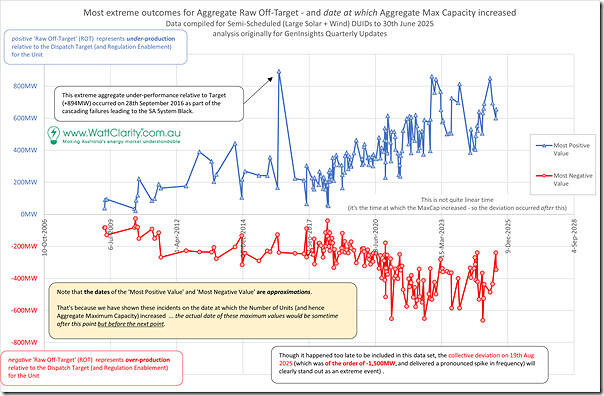
Taking this data and looking another way, we trend the largest exceedance (in either direction) for each step change increase in installed capacity base of Semi-Scheduled asset:
Noting that the x-axis is not strictly time-linear scale, it’s still quite clear that the growing capacity base is making large exceedance more likely to occur.
So that’s where we’ll leave this particular article…


Leave a comment