
A long-term trend of sudden reductions in coal generation output is reviewed.
For this article we use “Δ300” to identify the generation events of interest:
When the 5-minute interval start and end readings indicate a drop of more than 300 MW.
We’ve selected this because:
- It’s simple.
- It represents atypical operation (ramp-down rates of coal units are typically less than 10 MW/min, a change of 300MW is 60 MW/min).
- It’s a big enough drop to challenge frequency-regulating services (potentially more on this later). Noting that smaller deviations can also produce a frequency disturbance.
Elsewhere on WattClarity and in Deeper Insights, for a number of years, we’ve been tracking a range of metrics which each reveal trends in the reliability at an aggregate level of coal units:
- A count of ‘Sudden Trip’ events that was inspired by AEMO reporting in a QED back in 2018.
- That is “when a unit is generating above its minimum generation level and falls to zero within two Dispatch Intervals”.
- The number of ‘Unit Starts’,
- Megawatts unavailable, and
- The number of large (e.g. 300 MW) ‘AggregateRaw Off-Target’ (AggROT) across coal units.
In this article we stick to the “Δ300” metric to identify events.
A decreasing trend indicates fewer events nowadays
Here’s the trend since 2002, a 23-year history. A visible decline in the monthly counts is evident, extending from the 2000s to the current year.
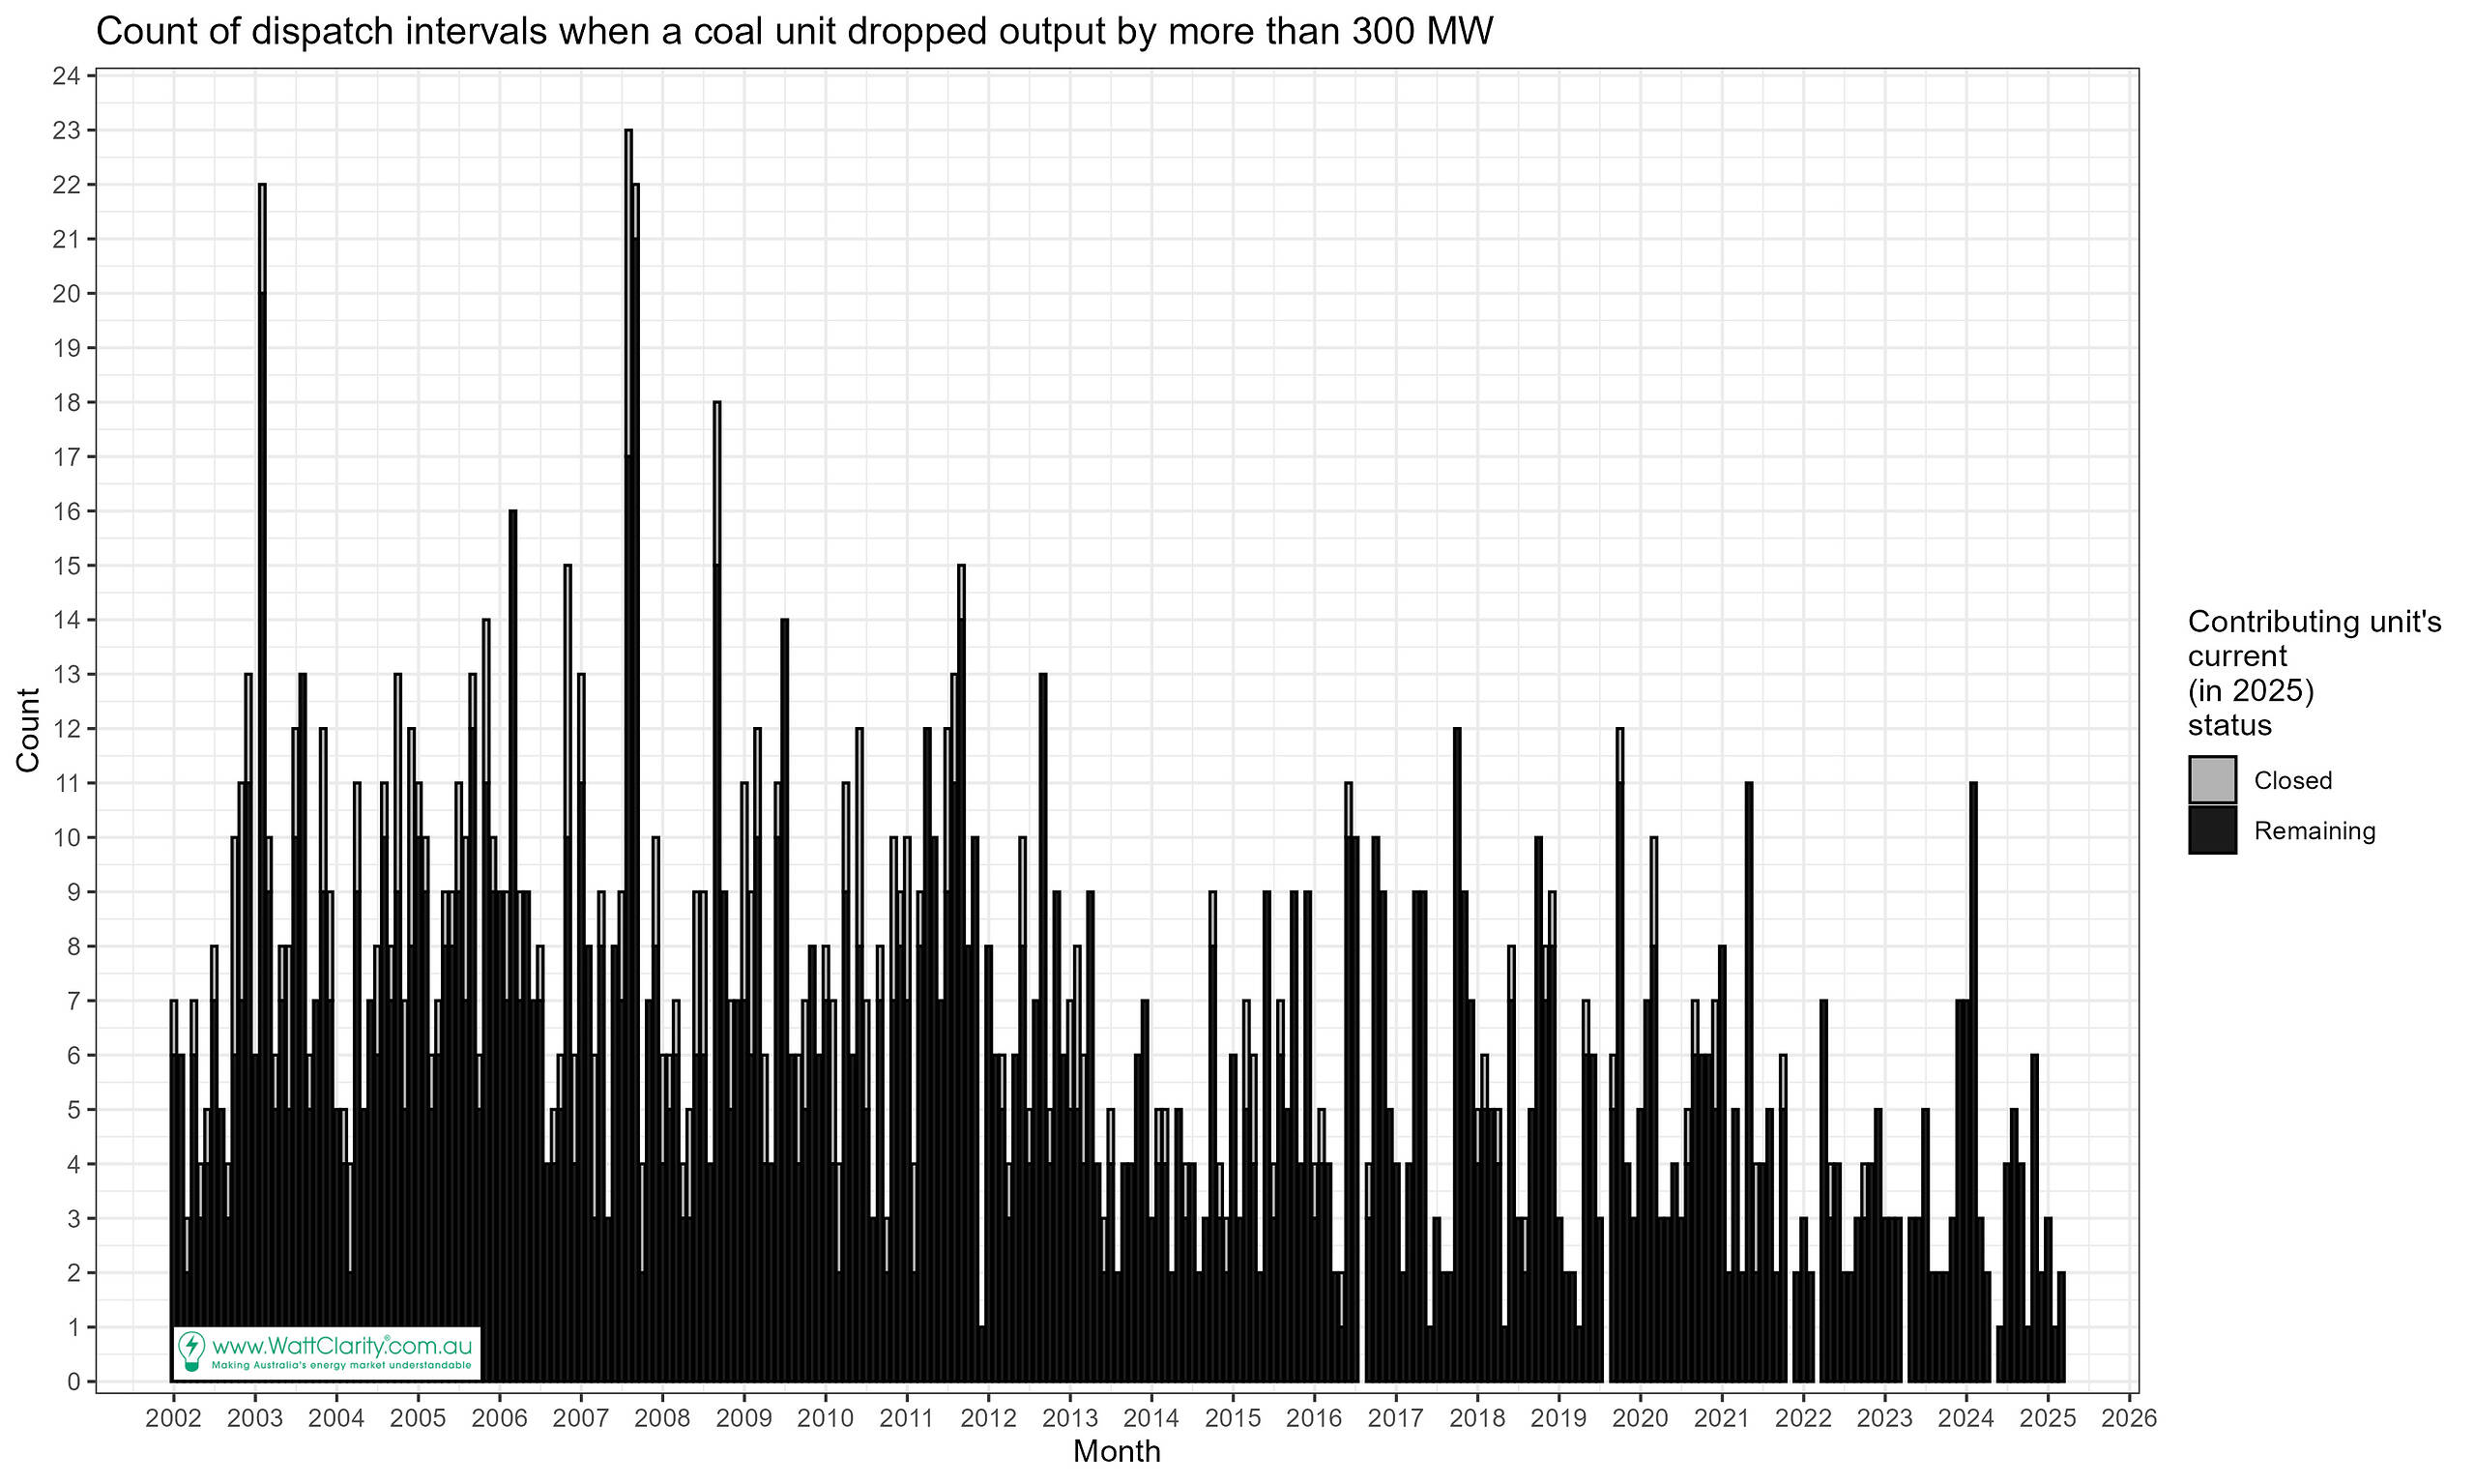
In the above chart some contributing units are no longer operational. Due to our size threshold of 300 MW the units at Wallerawang and Liddell Power Stations make up that component, the ‘closed’ units.
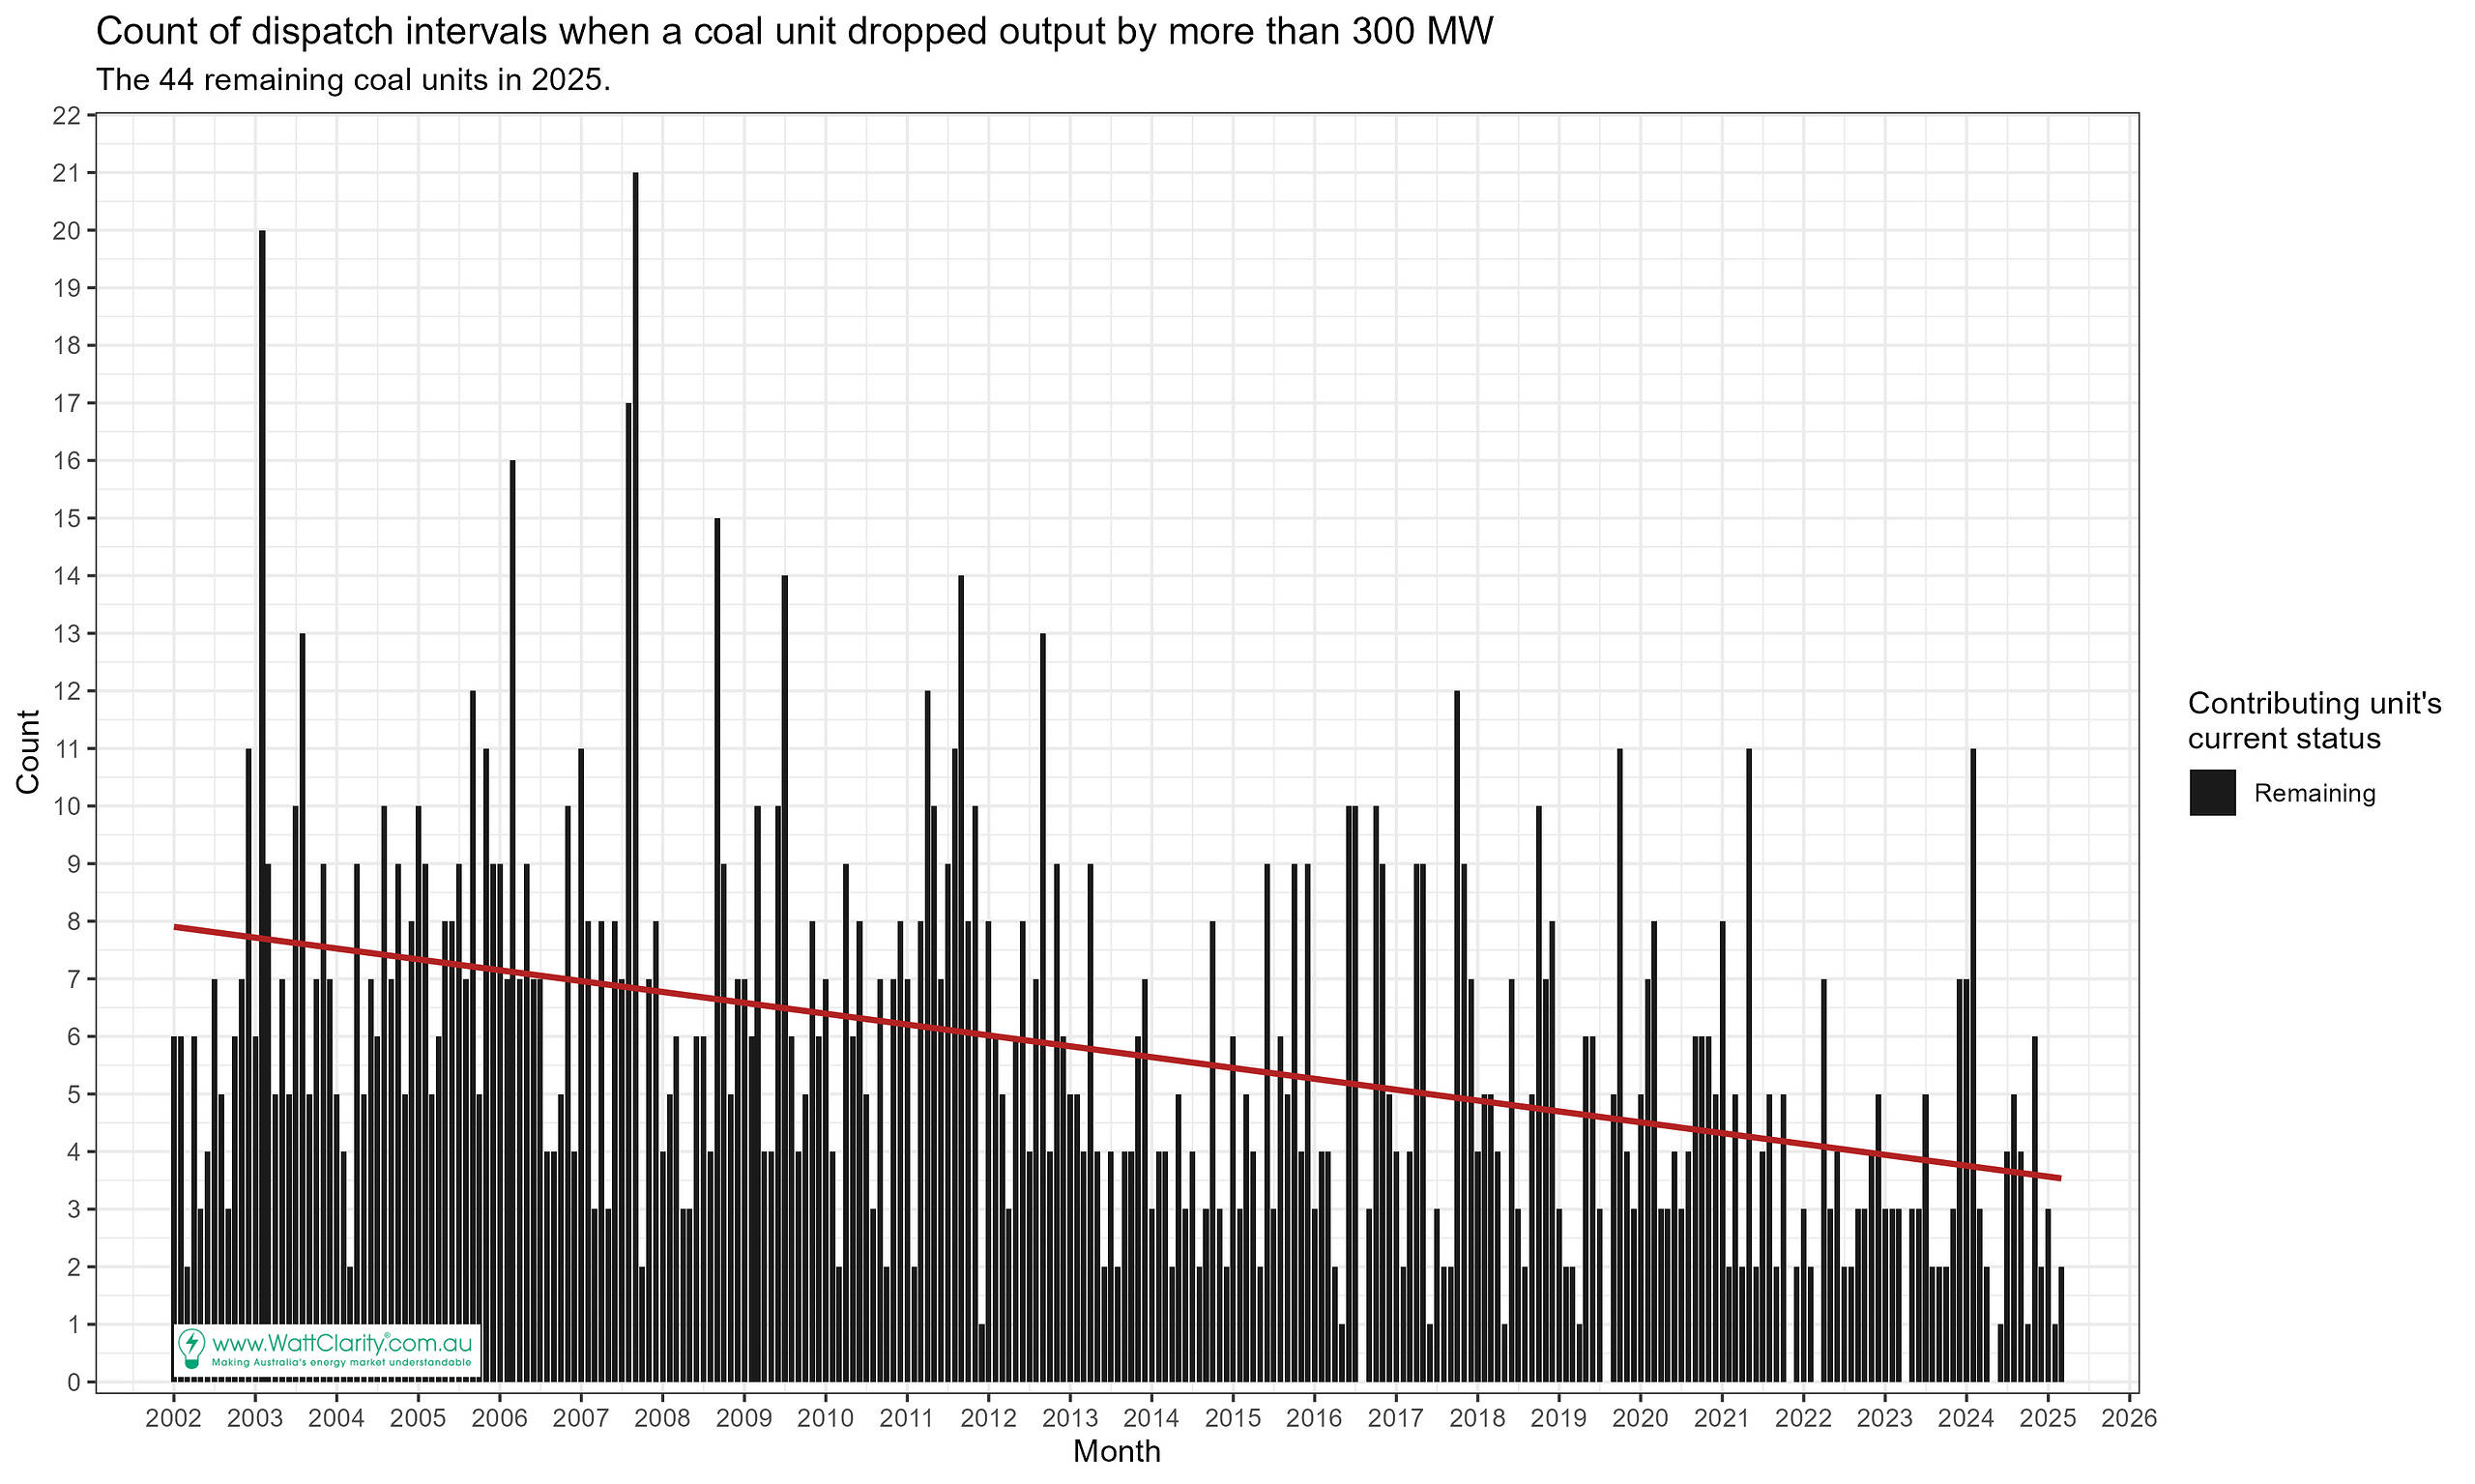
Just the remaining coal units? Also decreasing
When we filter out the units that have closed, we find the trend is still decreasing. The slope of the red line, representing the linear trend, is about 1 event per month fewer every 5 years.
Notable events
The following table presents a list of notable events where a coal unit has dropped by more than 300 MW. It’s not a complete list right now, and gaps in the table don’t mean there were no events – we’ve seen the counts in the charts above. The list aims to capture some events as examples where we have covered it in a past article.
We might add to this as time permits.
|
Year |
Event |
|
2025 (to March) |
|
|
2024 |
Loy Yang A (October) Loy Yang A (February) |
|
2023 |
|
|
2022 |
Loy Yang A2 |
|
2021 |
Callide (C4, 25th May) Callide C (January) |
|
2020 |
|
|
2019 |
|
|
2018 |
|
|
2017 |
|
|
2016 |
|
|
2015 |
|
|
2014 |
|
|
2013 |
|
|
2012 |
|
|
2011 |
|
|
2010 |
|
|
2009 |
|
|
2008 |
|
|
2007 |
|
|
2006 |
|
|
2005 |
|
|
2004 |
|
|
2003 |
|
|
2002 |
Great article Linton. Appears that the count of forced outages may have stayed at the same level over the last 5 years but the EFOR % number has more than doubled over the past 5 to 10 years. Thats suggests that frequency of the events is steady while the durations of the outages are much longer.
Hi Ian, yes your thinking aligns with a feature Paul identified in 2023 when looking a the trend of unavailability. The trend was increasing and the recent extended forced outages were contributing to that.
( Part A of this: https://wattclarity.com.au/articles/2023/03/06march-geninsights-q4-coal-units/ )
Thanks Linton, great analysis as always.
Does the Δ300 metric risk excluding the ten Queensland 350MW Hitachi units if they’re operating at partial load? Gladstone runs 280 MW units, so is entirely excluded from this analysis.
Does a Δ200 metric risk including planned shuts or things like clinker deloads?
Hi Alex, you’re right. The measure would miss unit trips when not running higher than 3ooMW. And smaller unit, yes, wouldn’t make the cut. A Δ200 metric could be some thing we explore in the future!
Further to Linton’s reply Alex, we chose the Δ300 metric in order to make the trips large enough to feature more clearly in what Linton’s going to analyse in a follow-on article … frequency changes.
Don’t we want to know the frequency of events per numbers of units? If the number of units declines so should the number of events. Removing the closed units won’t account for that underlying trend.
Hi Steve,
There’s a multitude of stats that we could calculate. In the end, we aimed to understand whether or not we are seeing fewer ‘events’, compared to the past. Some drivers of fewer events are closures (but we eliminated that in the second chart), potentially longer durations spent unavailable, and potentially more time spent operating at low loadings (below 300MW).
In the next article (that Paul referred to) [ https://wattclarity.com.au/articles/2025/06/frequency-change-associated-with-coal-generation-events/ ] the aim was to see how these events impact system frequency.