
Autumn has fast emerged as a volatile and uncertain time in the NEM as unpredictable weather patterns often deliver a mixed bag of renewable energy outcomes. As the energy transition trundles on, this seasonal variability is likely to remain a defining feature.
This was evident last year as we experienced a prolonged ‘wind drought’ that depressed wind farm output in many parts of the NEM.
In contrast, Autumn 2025 has brought starkly divergent solar irradiance patterns between the north-east and south-west halves of Australia, impacting solar farm conditions across the NEM.
Unusual autumn weather splits the country
Autumn has been marked by unusually sharp contrasts in weather patterns, diverging significantly from historical norms. A dominant high-pressure system over southern Australia helped reinforce the north-south split, blocking rain-bearing systems from reaching the southern states while allowing humid, cloud-laden air to accumulate in the north and east.
The disparity in weather conditions has been largely influenced by a strongly positive Southern Annular Mode (SAM) — a climate driver that has pushed moist easterly air into Queensland and New South Wales, whilst shunting rainfall away from the southern states.
Following Cyclone Alfred in early March, the north-eastern half of the country has experienced above-average rainfall, with Queensland experiencing its sixth-wettest autumn on record. Conversely, southern and western states have experienced below-average rainfall, with Victoria recording its driest Autumn since 2008, and the ninth-driest on record.
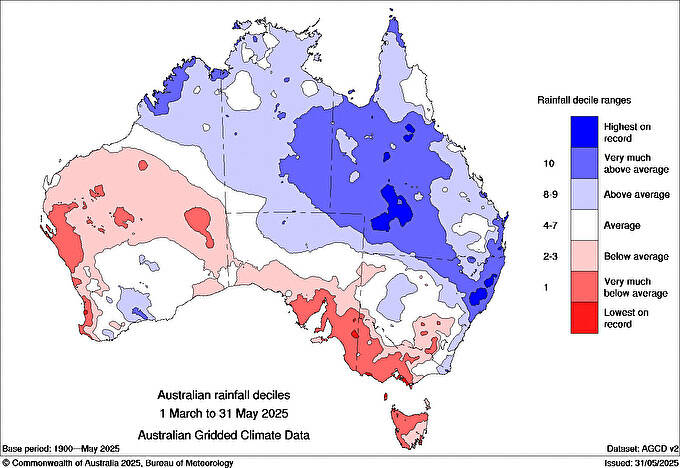
The north-eastern half of Australia experienced higher-than-usual rainfall and cloud cover between March and May, while the other half of the country experienced the opposite
Source: BOM
How has this unusual seasonal weather impacted solar farm performance?
Earlier this week, Solcast published several charts via PV Magazine showing that solar irradiance in parts of Australia had fallen by nearly 20% compared to seasonal norms, whilst the absence of rain and cloud cover across the south-western half of the country meant the opposite effect was observed there.
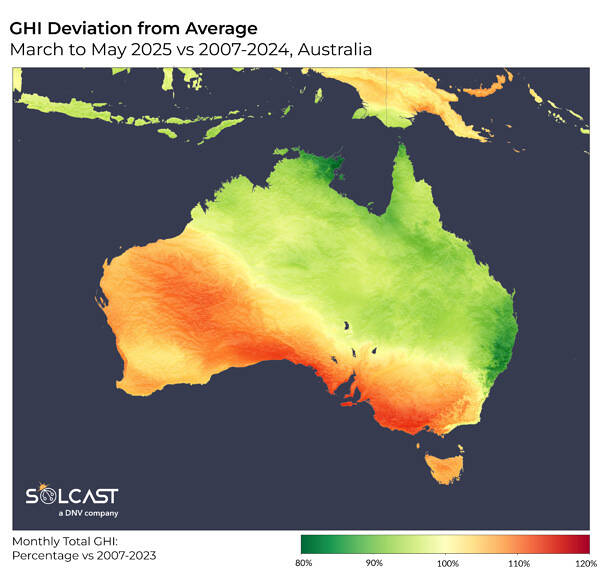
This prolonged high-pressure system resulted in diverging solar irradiance patterns across Australia.
Source: Solcast
To analyse the extent to which this effect has impacted conditions for utility-scale solar farms in the NEM, I’ve analysed each solar unit’s availability in 2025 against recent years.
Some analysts or market observers might commonly examine production or capacity factors when discussing solar farm performance, but to better understand the underlying weather and technical conditions (like we are here), availability is a much more appropriate metric. This also highlights the limitations of using capacity factor to understand outcomes, particularly in a system increasingly shaped by curtailment and constraints — something I explored in more detail in this WattClarity article just over two years ago.
In the map-based visualisation below, we see each semi-scheduled solar unit’s total availability between March and May 2025, in relation to its annual average for the same three-month period between 2022 and 2024. To help account for commissioning periods that would otherwise bias the data, I’ve only included solar farms registered before 2020 in this analysis.
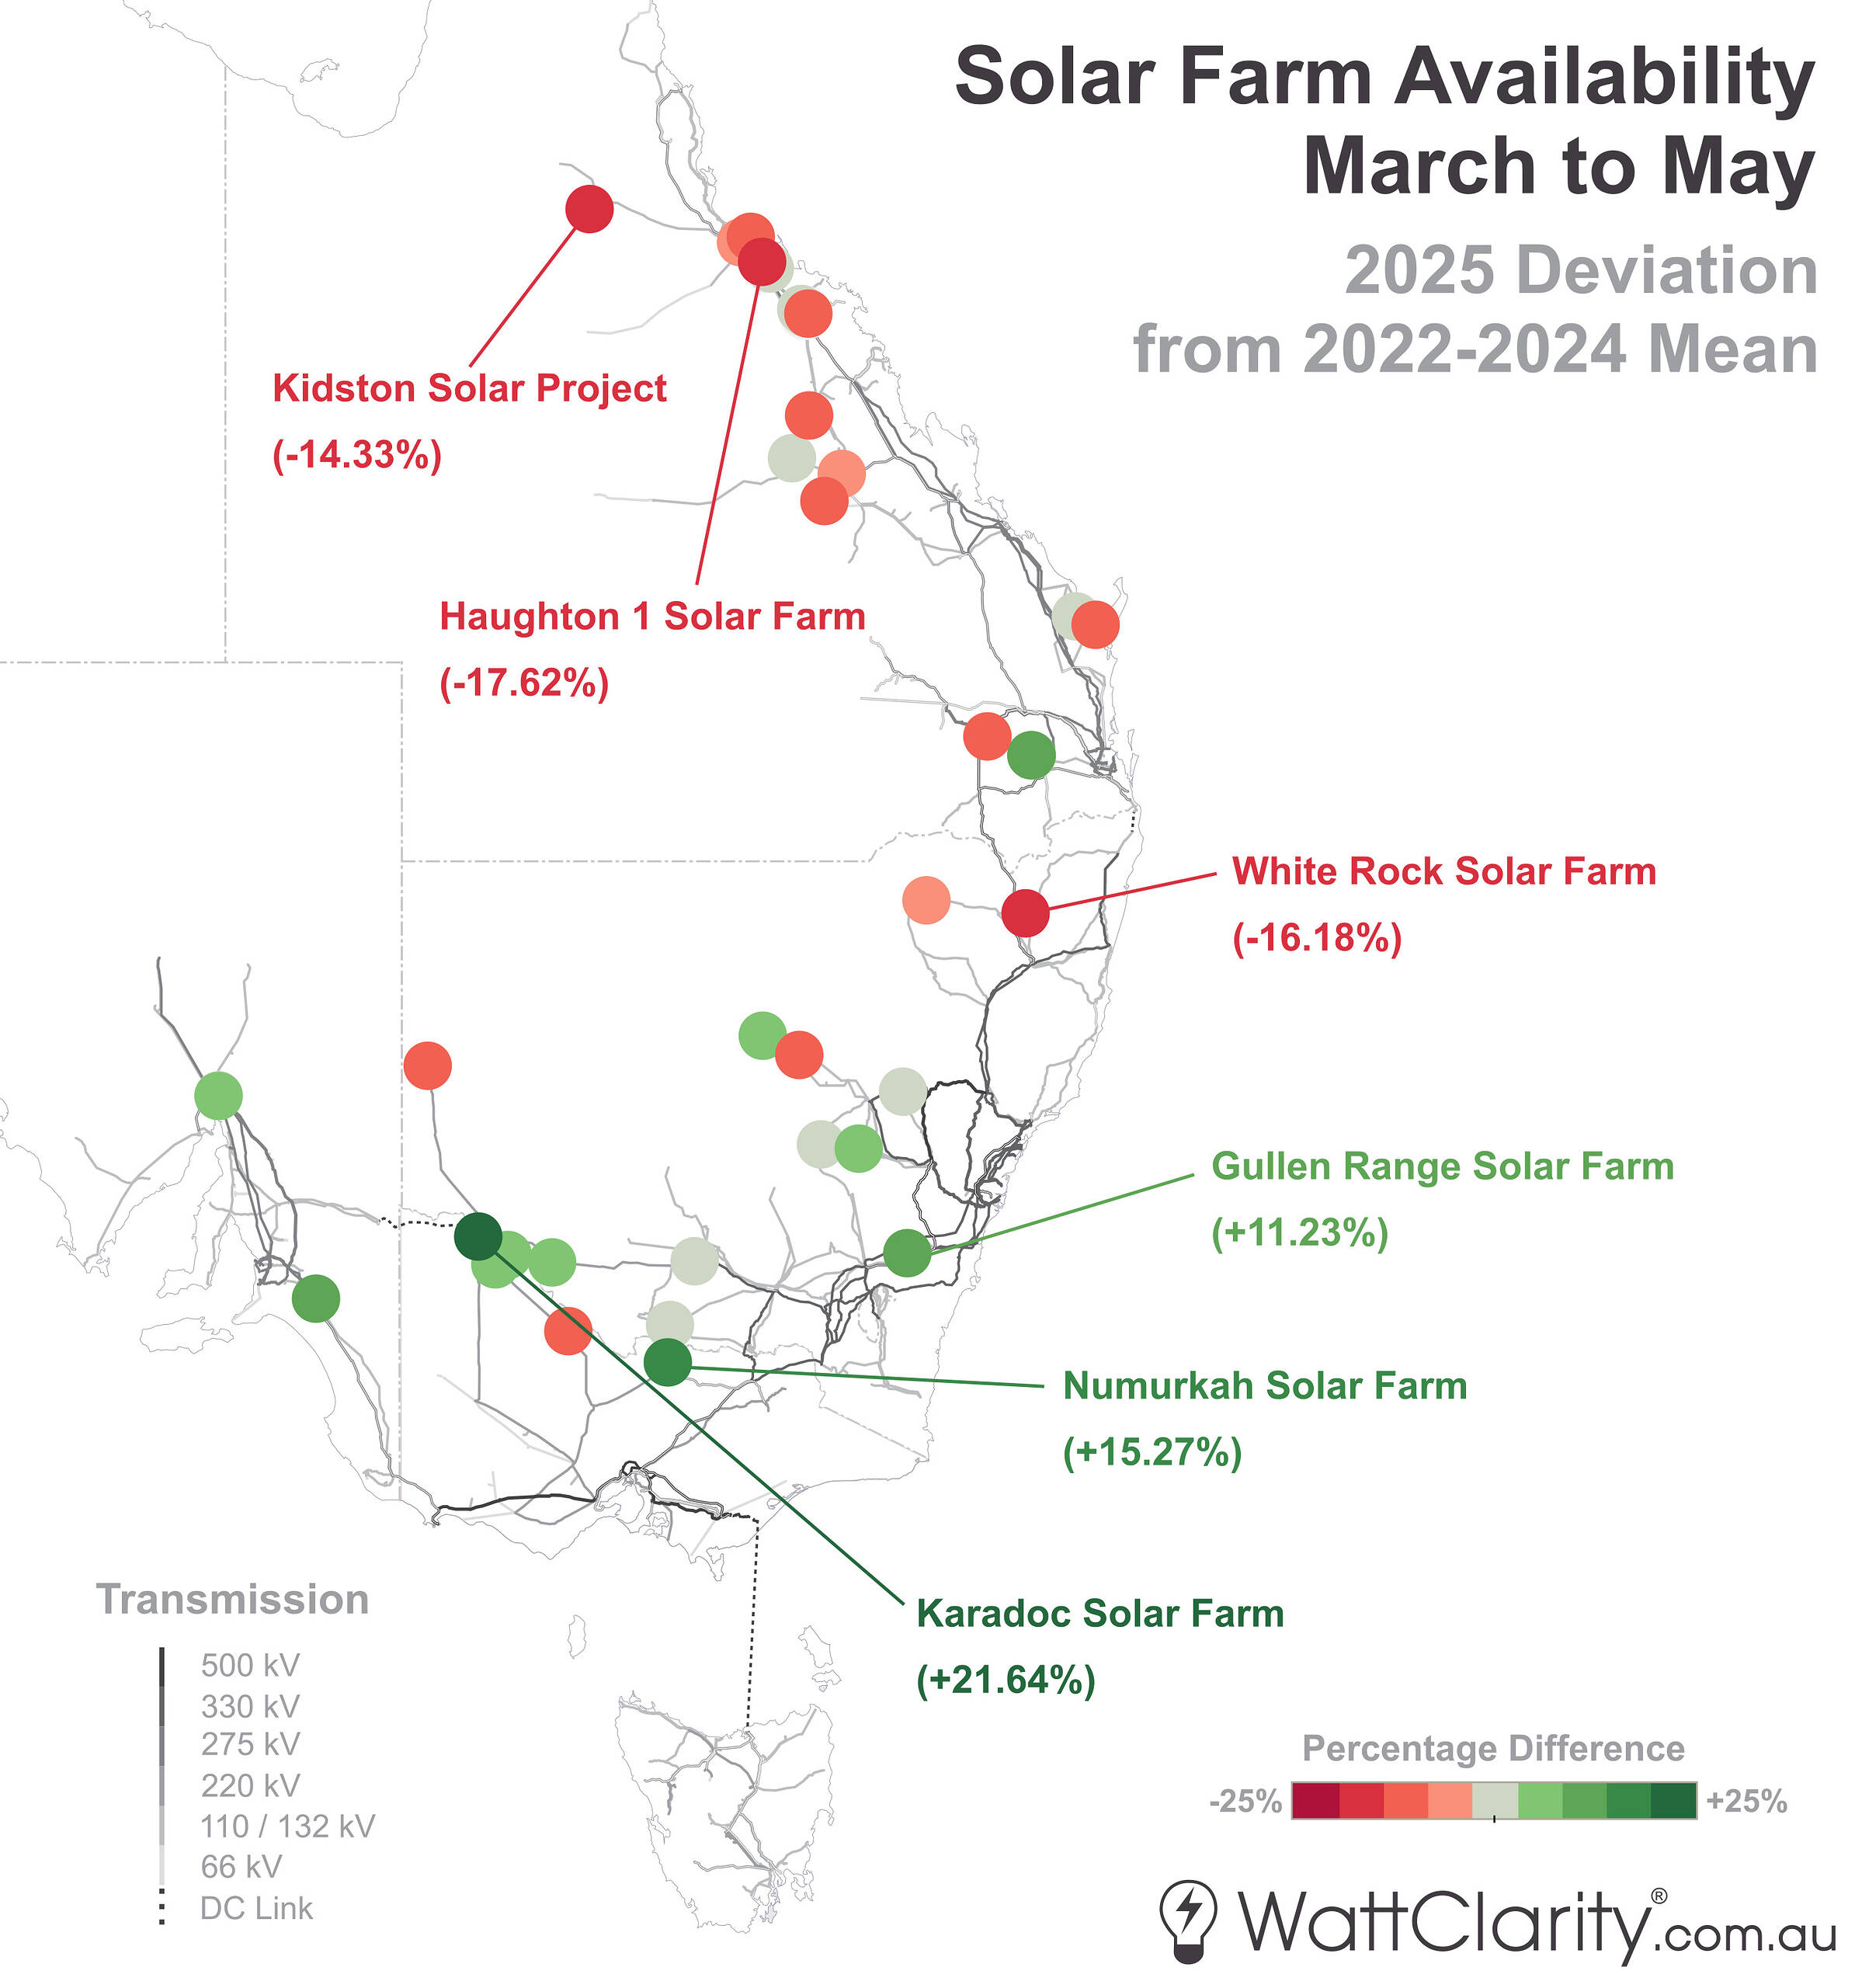
This weather outcome has led to contrasting irradiance conditions for utility-scale solar farms over the past three months. The units with the top three biggest deviations in either direction are labelled.
Note: Semi-Scheduled units registered by 2020 are shown.
Source: NEMreview
By analysing the 2025 deviation in availability from March to May against the prior three-year mean, a few high-level patterns emerge:
- Solar farms in Queensland and northern NSW recorded an average decrease of 5.6% in availability, while Victorian solar farms saw an average increase of 7.7%.
- Some of these declines were also driven by site-specific outages — for instance, Haughton Solar Farm was offline for several days in late May, and Broken Hill Solar Farm was unavailable for parts of late March and early April.
- Similarly, Gannawarra Solar Farm in northern Victoria was offline for extended periods this autumn, limiting its ability to benefit from the unusually favourable solar conditions in the region.
- On the other hand, Karadoc Solar Farm saw a significant improvement in availability this year — largely due to better reliability, after spending most of March and April 2024 offline.
Leave a comment