
Background
This is the third in a series of articles (all collated in the category ‘Games that Self-Forecasters can Play’) to help illustrate some of the different approaches that we’re aware of, approaches that were discussed back in 2022 and, in many cases, are still observed in 2025.
In each example we have used real data – but have taken steps to anonymise the data (obscured the DUID and date, and normalized the capacity of the unit) because the purpose of these articles is not to point the finger at any particular unit. The purpose is help readers understand approaches that have been in use.
Readers should keep firmly in mind that:
- As noted before, it’s impossible to know motive – but does not stop us guessing.
- Also, on Sunday 8th June 2025 we see the commencement of Frequency Performance Payments – which:
- Does both:
- Changes the approach to apportioning Regulation FCAS costs; and
- Establishes a payments and cost recovery mechanism for Primary Frequency Response.
- And in doing so, it also retires the use of the ‘Frequency Indicator’ for apportioning regulation FCAS costs which (in our view) has been exploited for for the behaviours we part of the games note above.
- As a result of this change, we may see changes in these approaches.
- Does both:
Today’s example: Lunar Megawatts
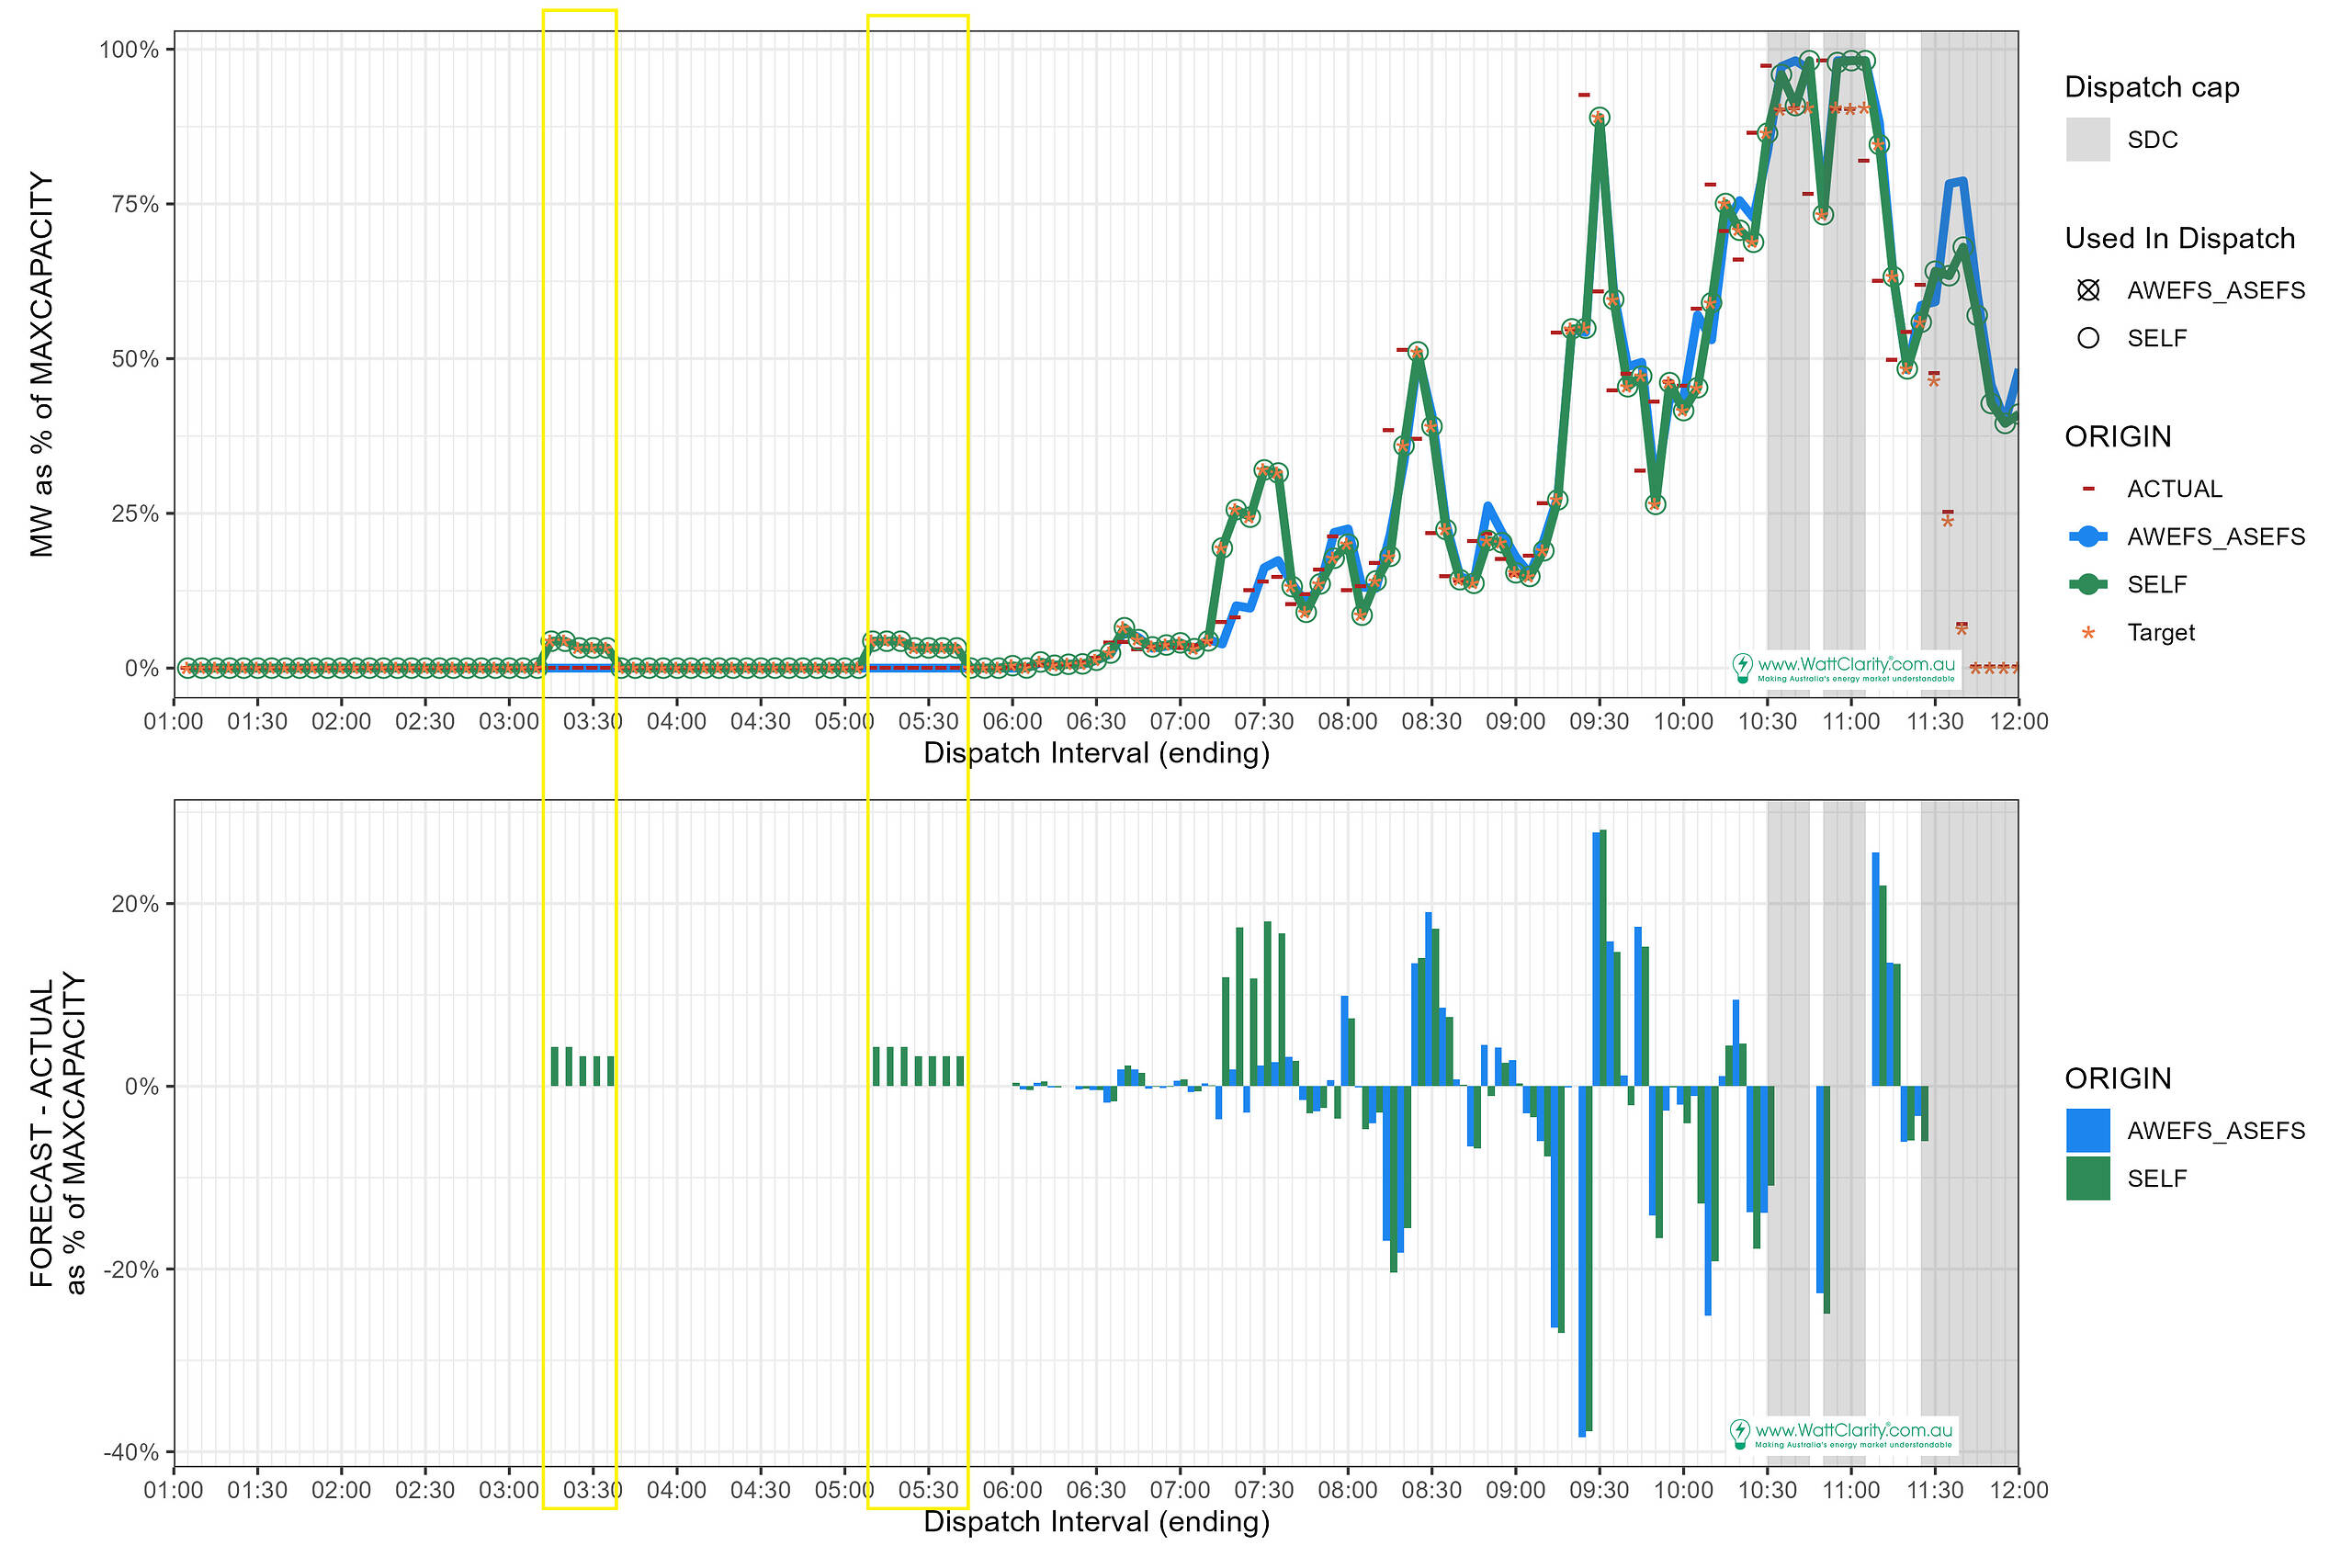
Another style of biasing a self-forecast. Lunar megawatts represent an expectation of solar farm generation at night, when it really should be zero.
In the example below, outlined in the yellow boxes, we observe:
- Five intervals of lunar megawatts from 03:15 to 03:35.
- Further, a run of 7 intervals of lunar megawatts, from 05:10 to 05:40.
Sunrise was at 05:45 (NEM time) for this unit’s location and time of year.
Compounding effects
The availability level is relatively low in this example – in the order of 5% of the unit’s capacity.
Yet it is relevant that many of these instances are often observed to coincide with the same or similar behaviour from other units – driving a greater system-level impact. In this example five other solar units were also forecasting lunar megawatts at the same time. The cumulative impact of six units forecasting availability where there in zero has the potential to be large.
Magnitudes to 100 MW have been noted in the past (one example was in the article New lowest-ever* point for NSW “Market Demand” on Sunday 16th Feb 2025 was lower than AEMO’s earlier forecasts).
Leg 1 – Minimising the share of Regulation FCAS costs
In his earlier article ‘Games that self-forecasters can play (Part 1 – An Overview)’, Paul identified two legs that form the foundations for self-forecast biasing:
- Minimising a (Semi-Scheduled) DUID’s share of Regulation FCAS costs
- Avoiding AEMO suppression
with both legs needing to be played in tandem.
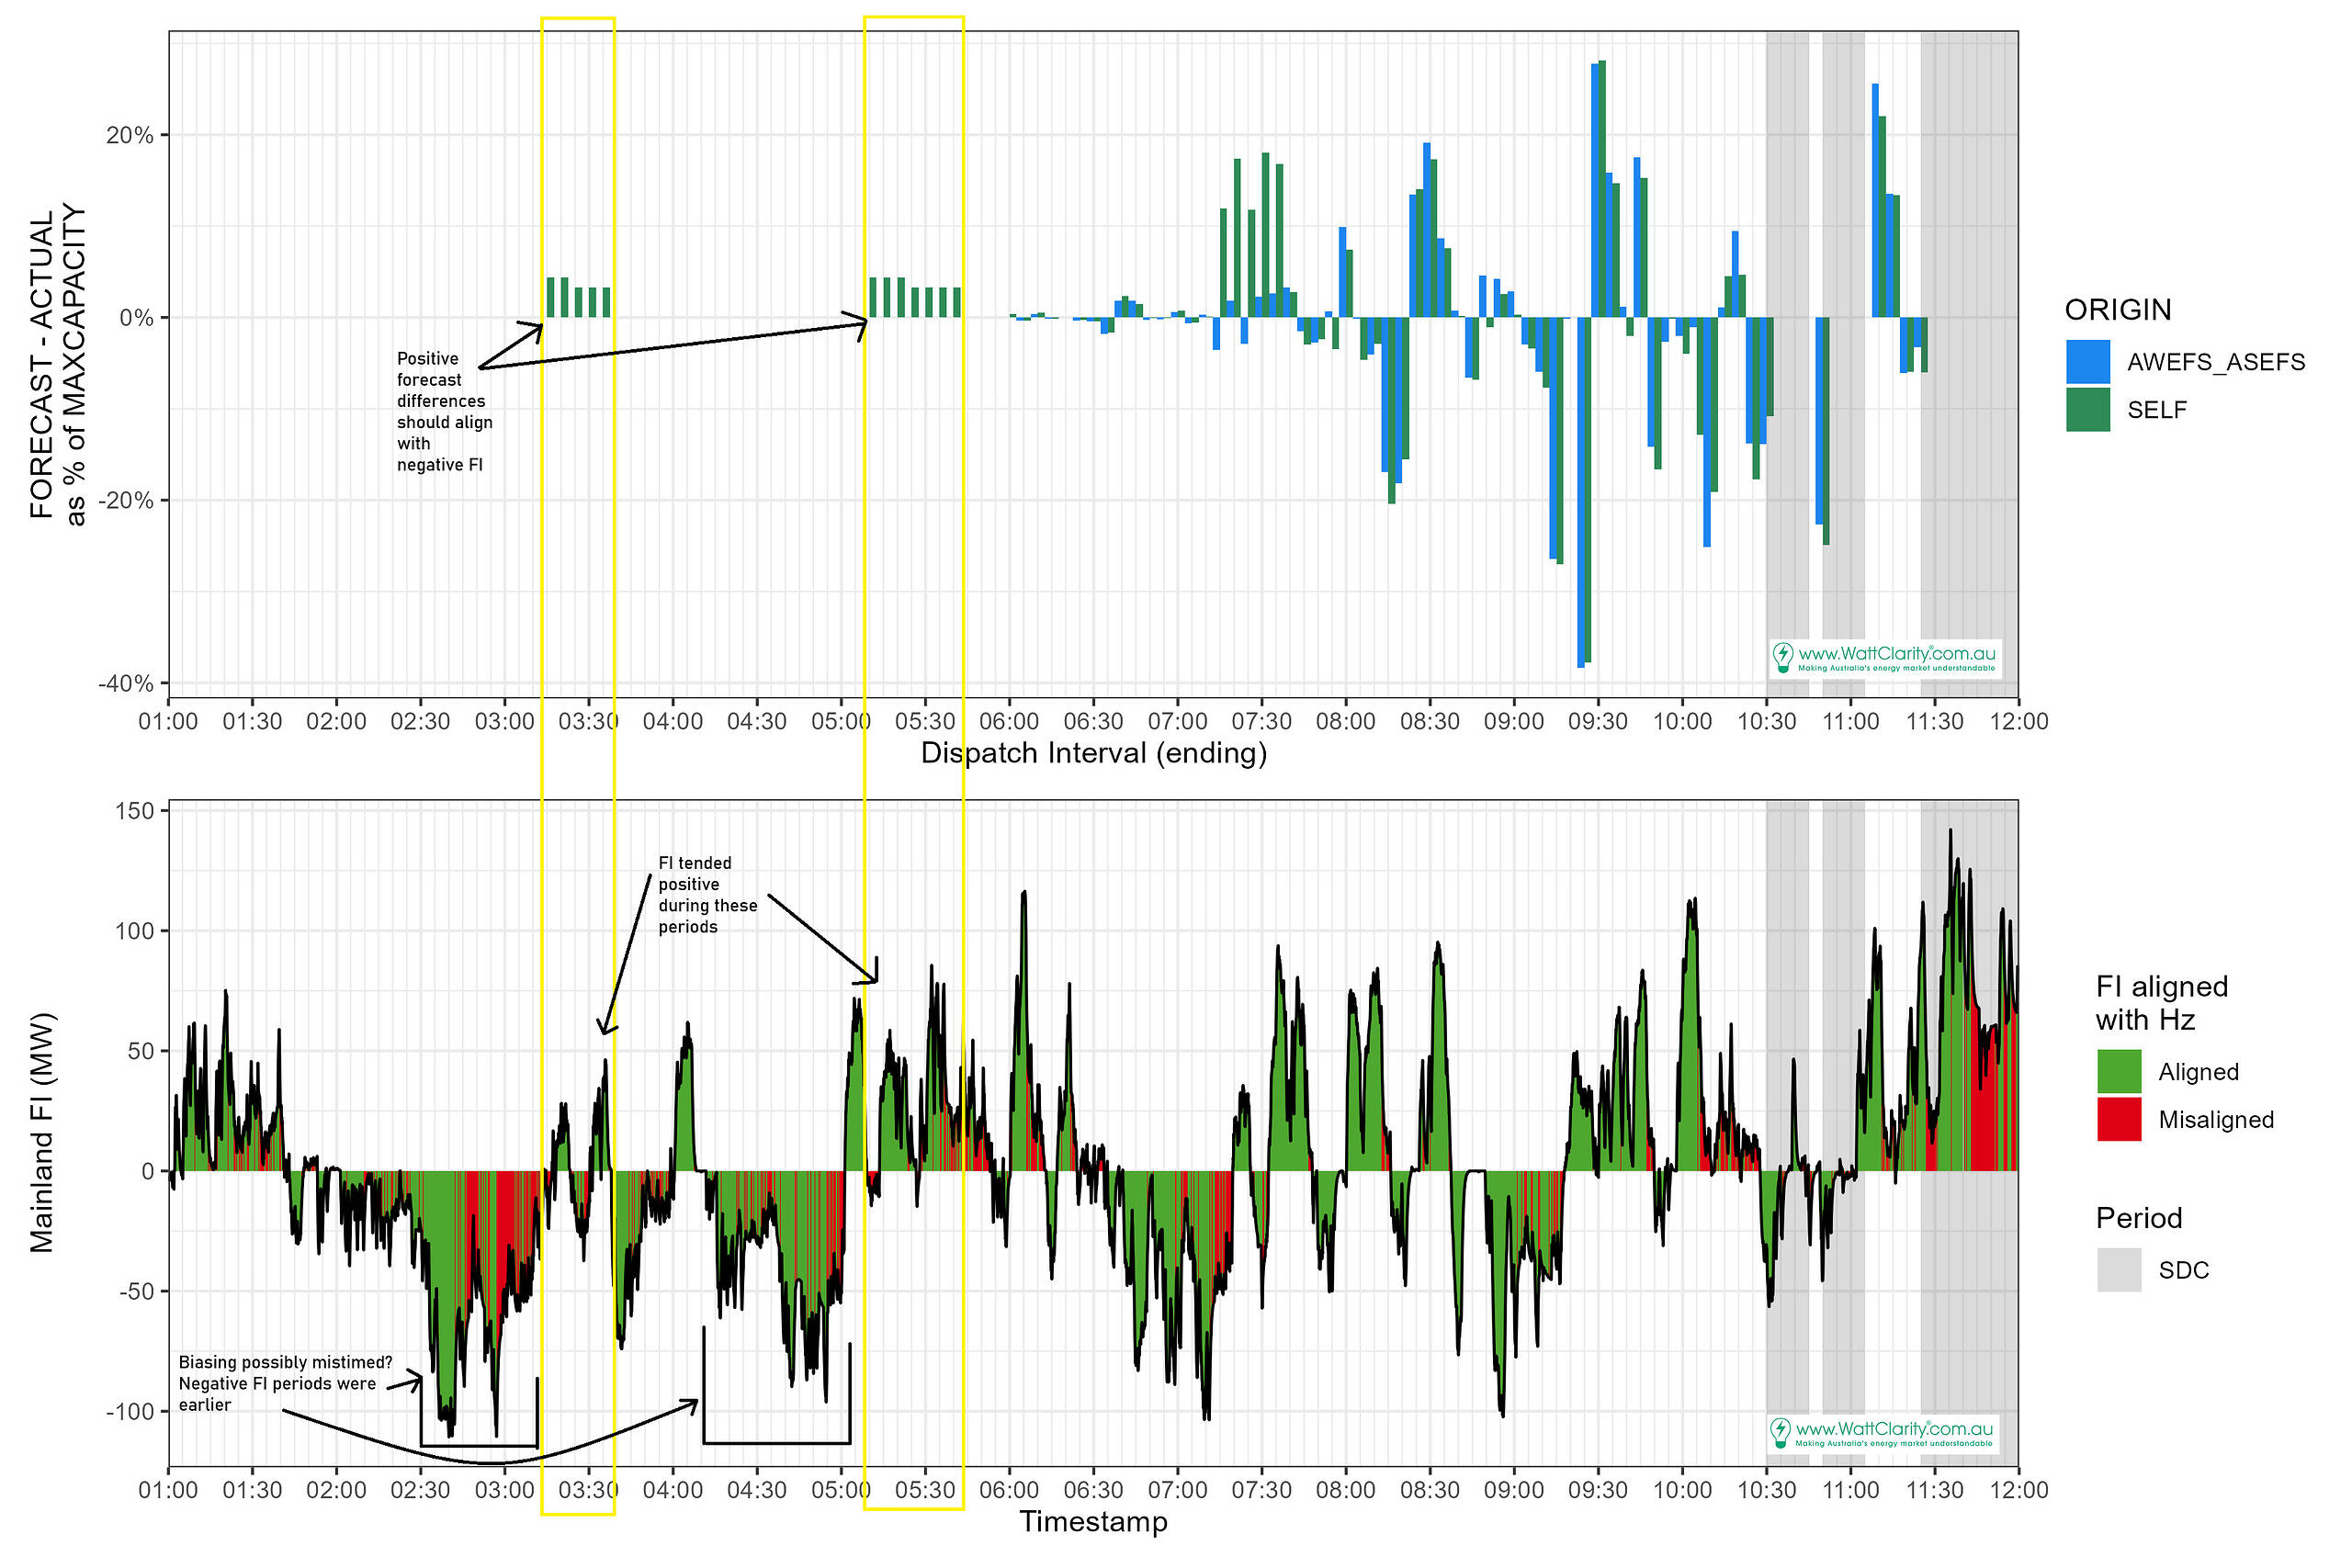
We presume the underlying driver of this example’s biasing is to gain a positively-assessed impact on system frequency. Thereby achieving some success at Leg 1 of the game. This approach risks hindering rather than helping frequency as a guess of frequency need is required upfront.
Recall: Unit MW deviations are deemed helpful to frequency when they are in the same direction as the Frequency Indicator (FI) , and when the FI is aligned with frequency (Hz).
For the chart below:
- The positive forecast differences during lunar megawatt periods equate to negative unit deviations from target.
- Therefore the positive forecast differences require a negative FI to be (potentially) deemed helping frequency.
- Note, the evaluation of performance against frequency is performed with 4-second measurements. We are coarsely approximating this with our use of interval-end values.
- However, in the next chart we can begin to see whether or not the forecast differences matched the need indicated by the FI.
5-Minute factors suggested mixed helpfulness
In our example, the unit’s availability biasing carried into an equivalent dispatch target. It was night; there was no output; the forecast differences were positive and equivalently the unit’s output deviations were negative.
Yet during these periods the FI mostly indicated positive unit deviations would be deemed helpful.
The chart below shows that only one interval earned a non-negligible helpful contribution factor during the lunar megawatt periods.
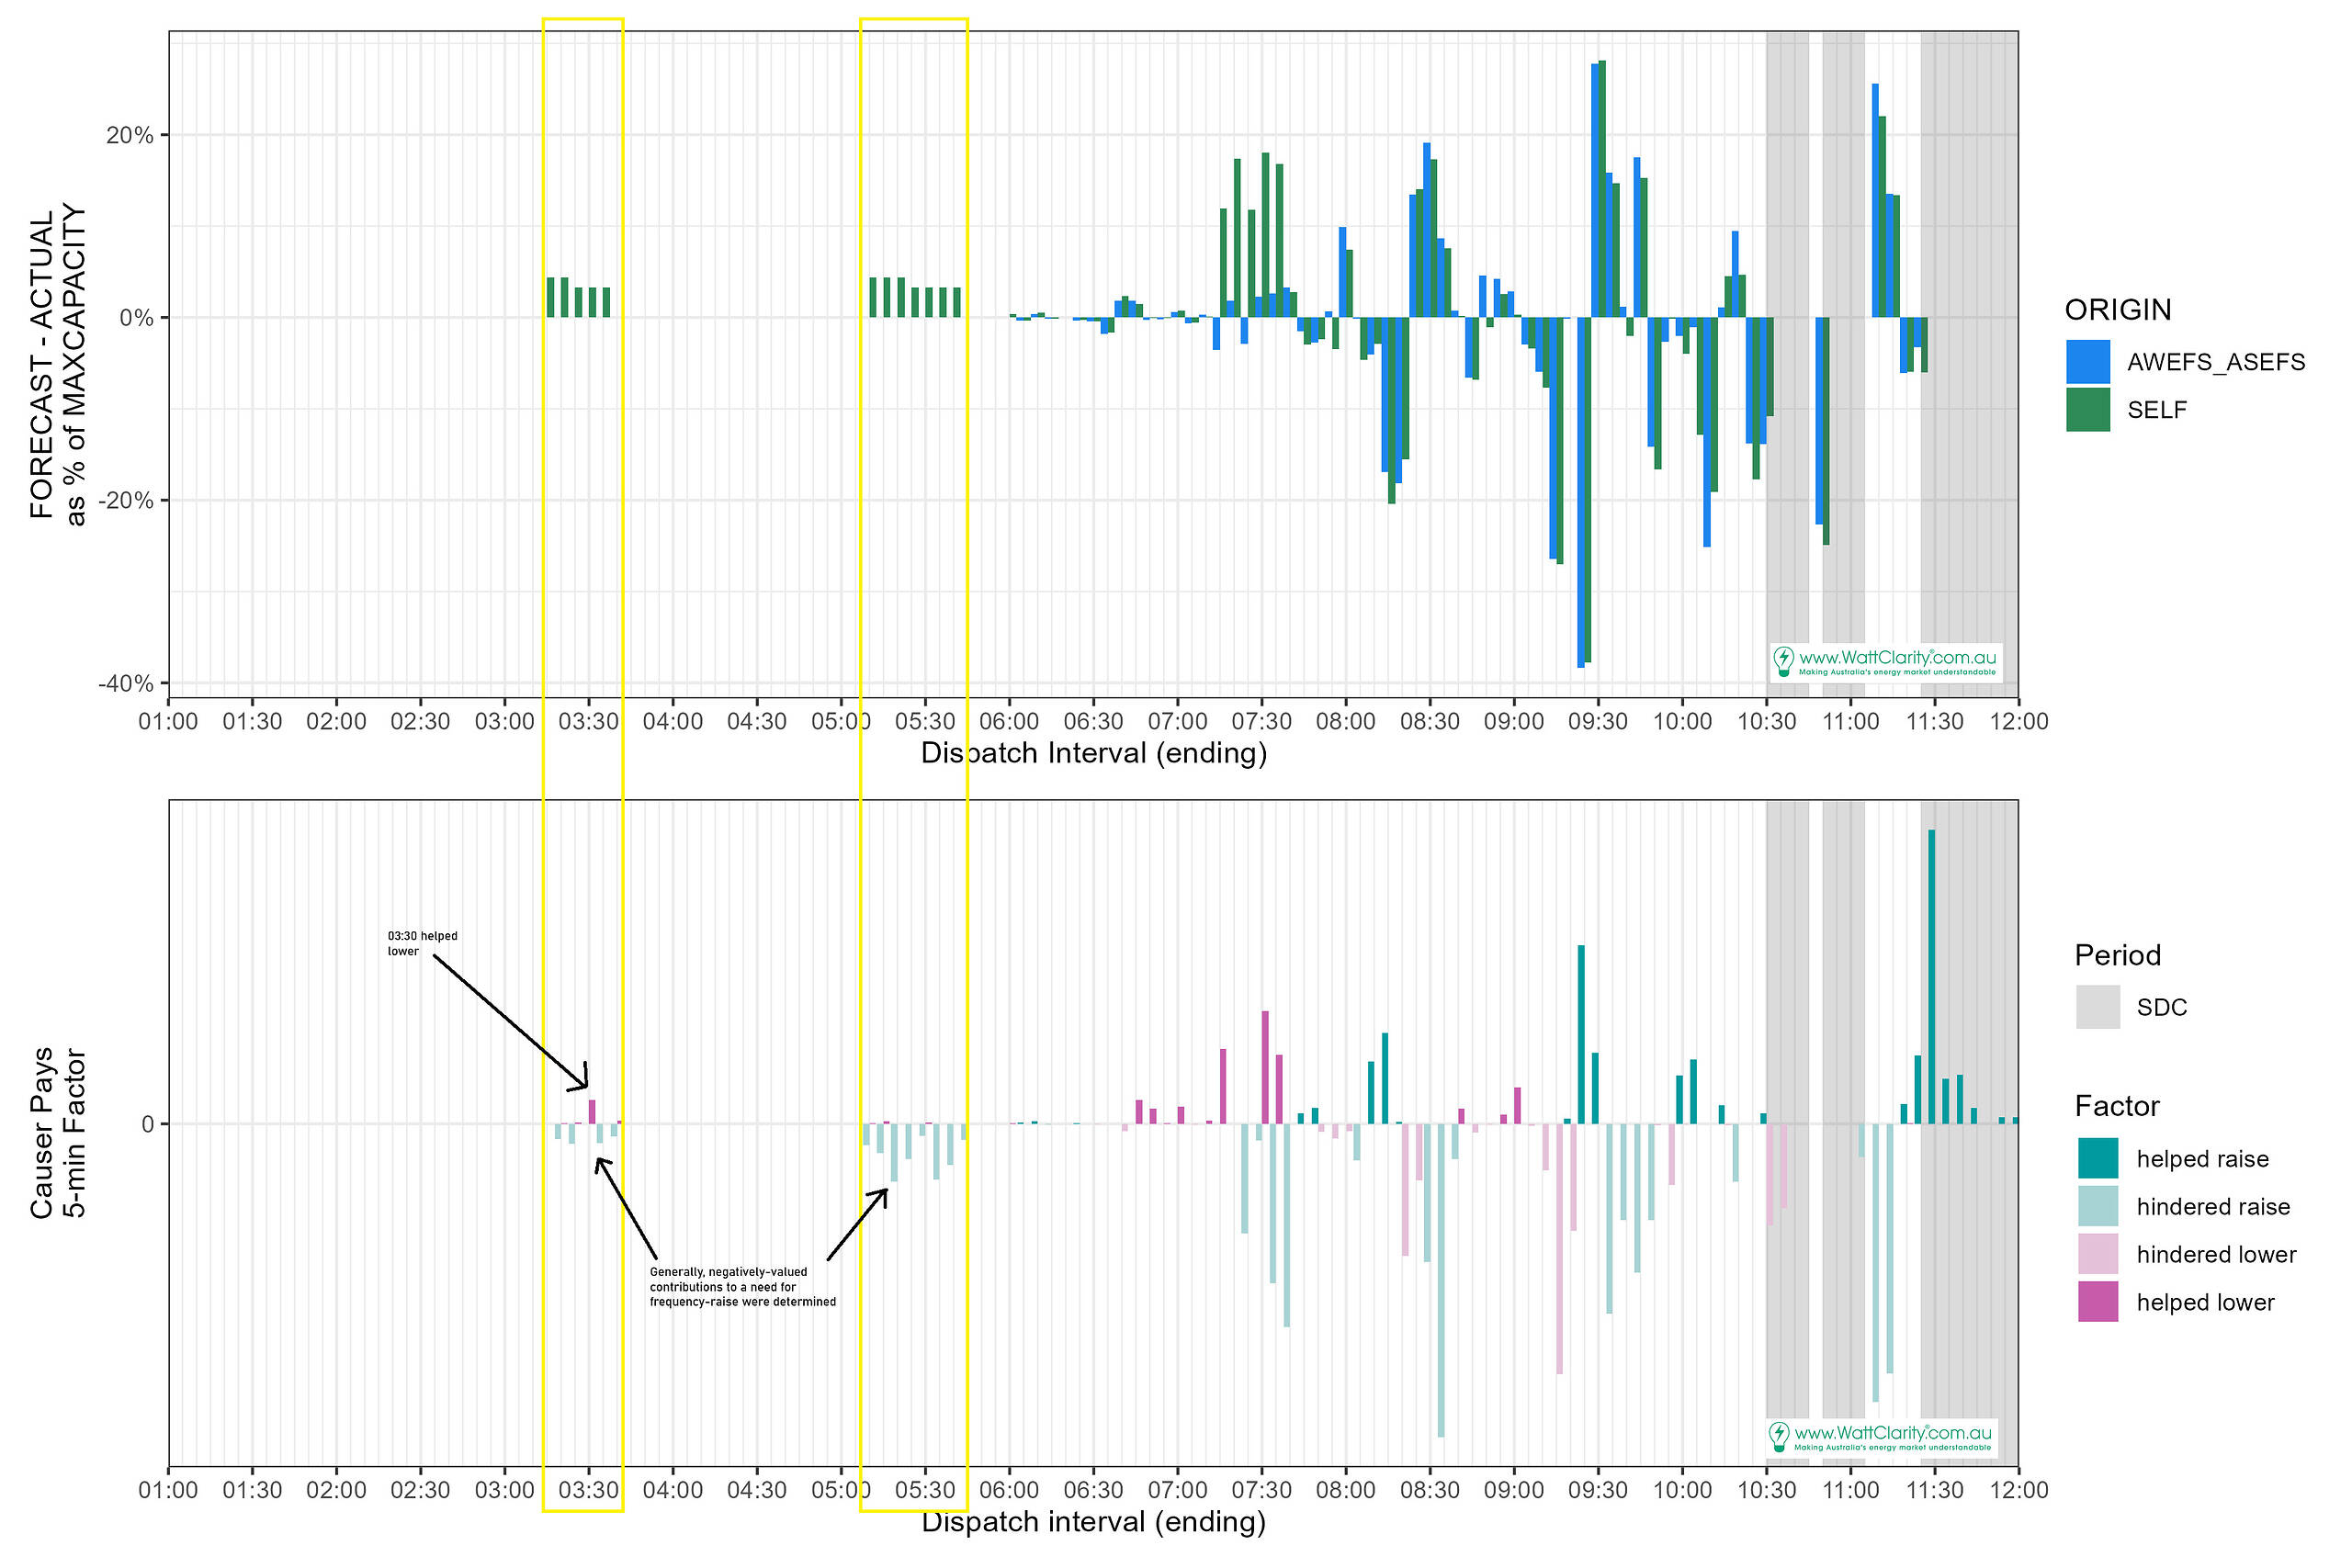
As we uncovered, above, the biasing periods generally missed the need for frequency-lower contributions (negative FI periods).
There were extended periods of negative FI in the leadup to the lunar megawatt intervals, but they didn’t last. Instead, apart from the 03:30 interval, the unit’s performance (as per the factors) was dominated by negatively-valued (unhelpful) contributions.
On this occasion, rather than contributing to better causer-pays factors to support reduced costs, these lunar megawatt intervals generally had the opposite effect.
Be the first to comment on "Examples of self-forecasting behaviours – part 3 – lunar megawatts"