
Big batteries are having their moment in the sun — or rather, are having their moments before and after the sun shines (let that pun sit with you for a bit).
With every analyst and their dog crunching numbers on the NEM’s growing big battery fleet, I thought it was time to wade in with a long-term look at the economics behind this battery boom. This feels particularly timely as the latest edition of our Generator Statistical Digest (GSD) has just hit the presses, serving up a veritable buffet of data for me to sink my teeth into.
This article is a sequel to a similar review I published a year ago, and with 2024 now behind us, I have the opportunity to re-examine both fleet-wide trends and individual asset performance. As here on WattClarity we tend to dissect the day-to-day twists and turns of the NEM, I’ll aim to anchor some of these long-term observations with what we saw play out in 2024.
Macro observations about the big battery fleet
Let’s start with the big picture — thirty scheduled big batteries are currently operating (or are in commissioning) across the NEM. I’ve created the infographic below so that readers can get a better understanding of the current composition of this fleet. A higher-resolution version of this graphic is available here.
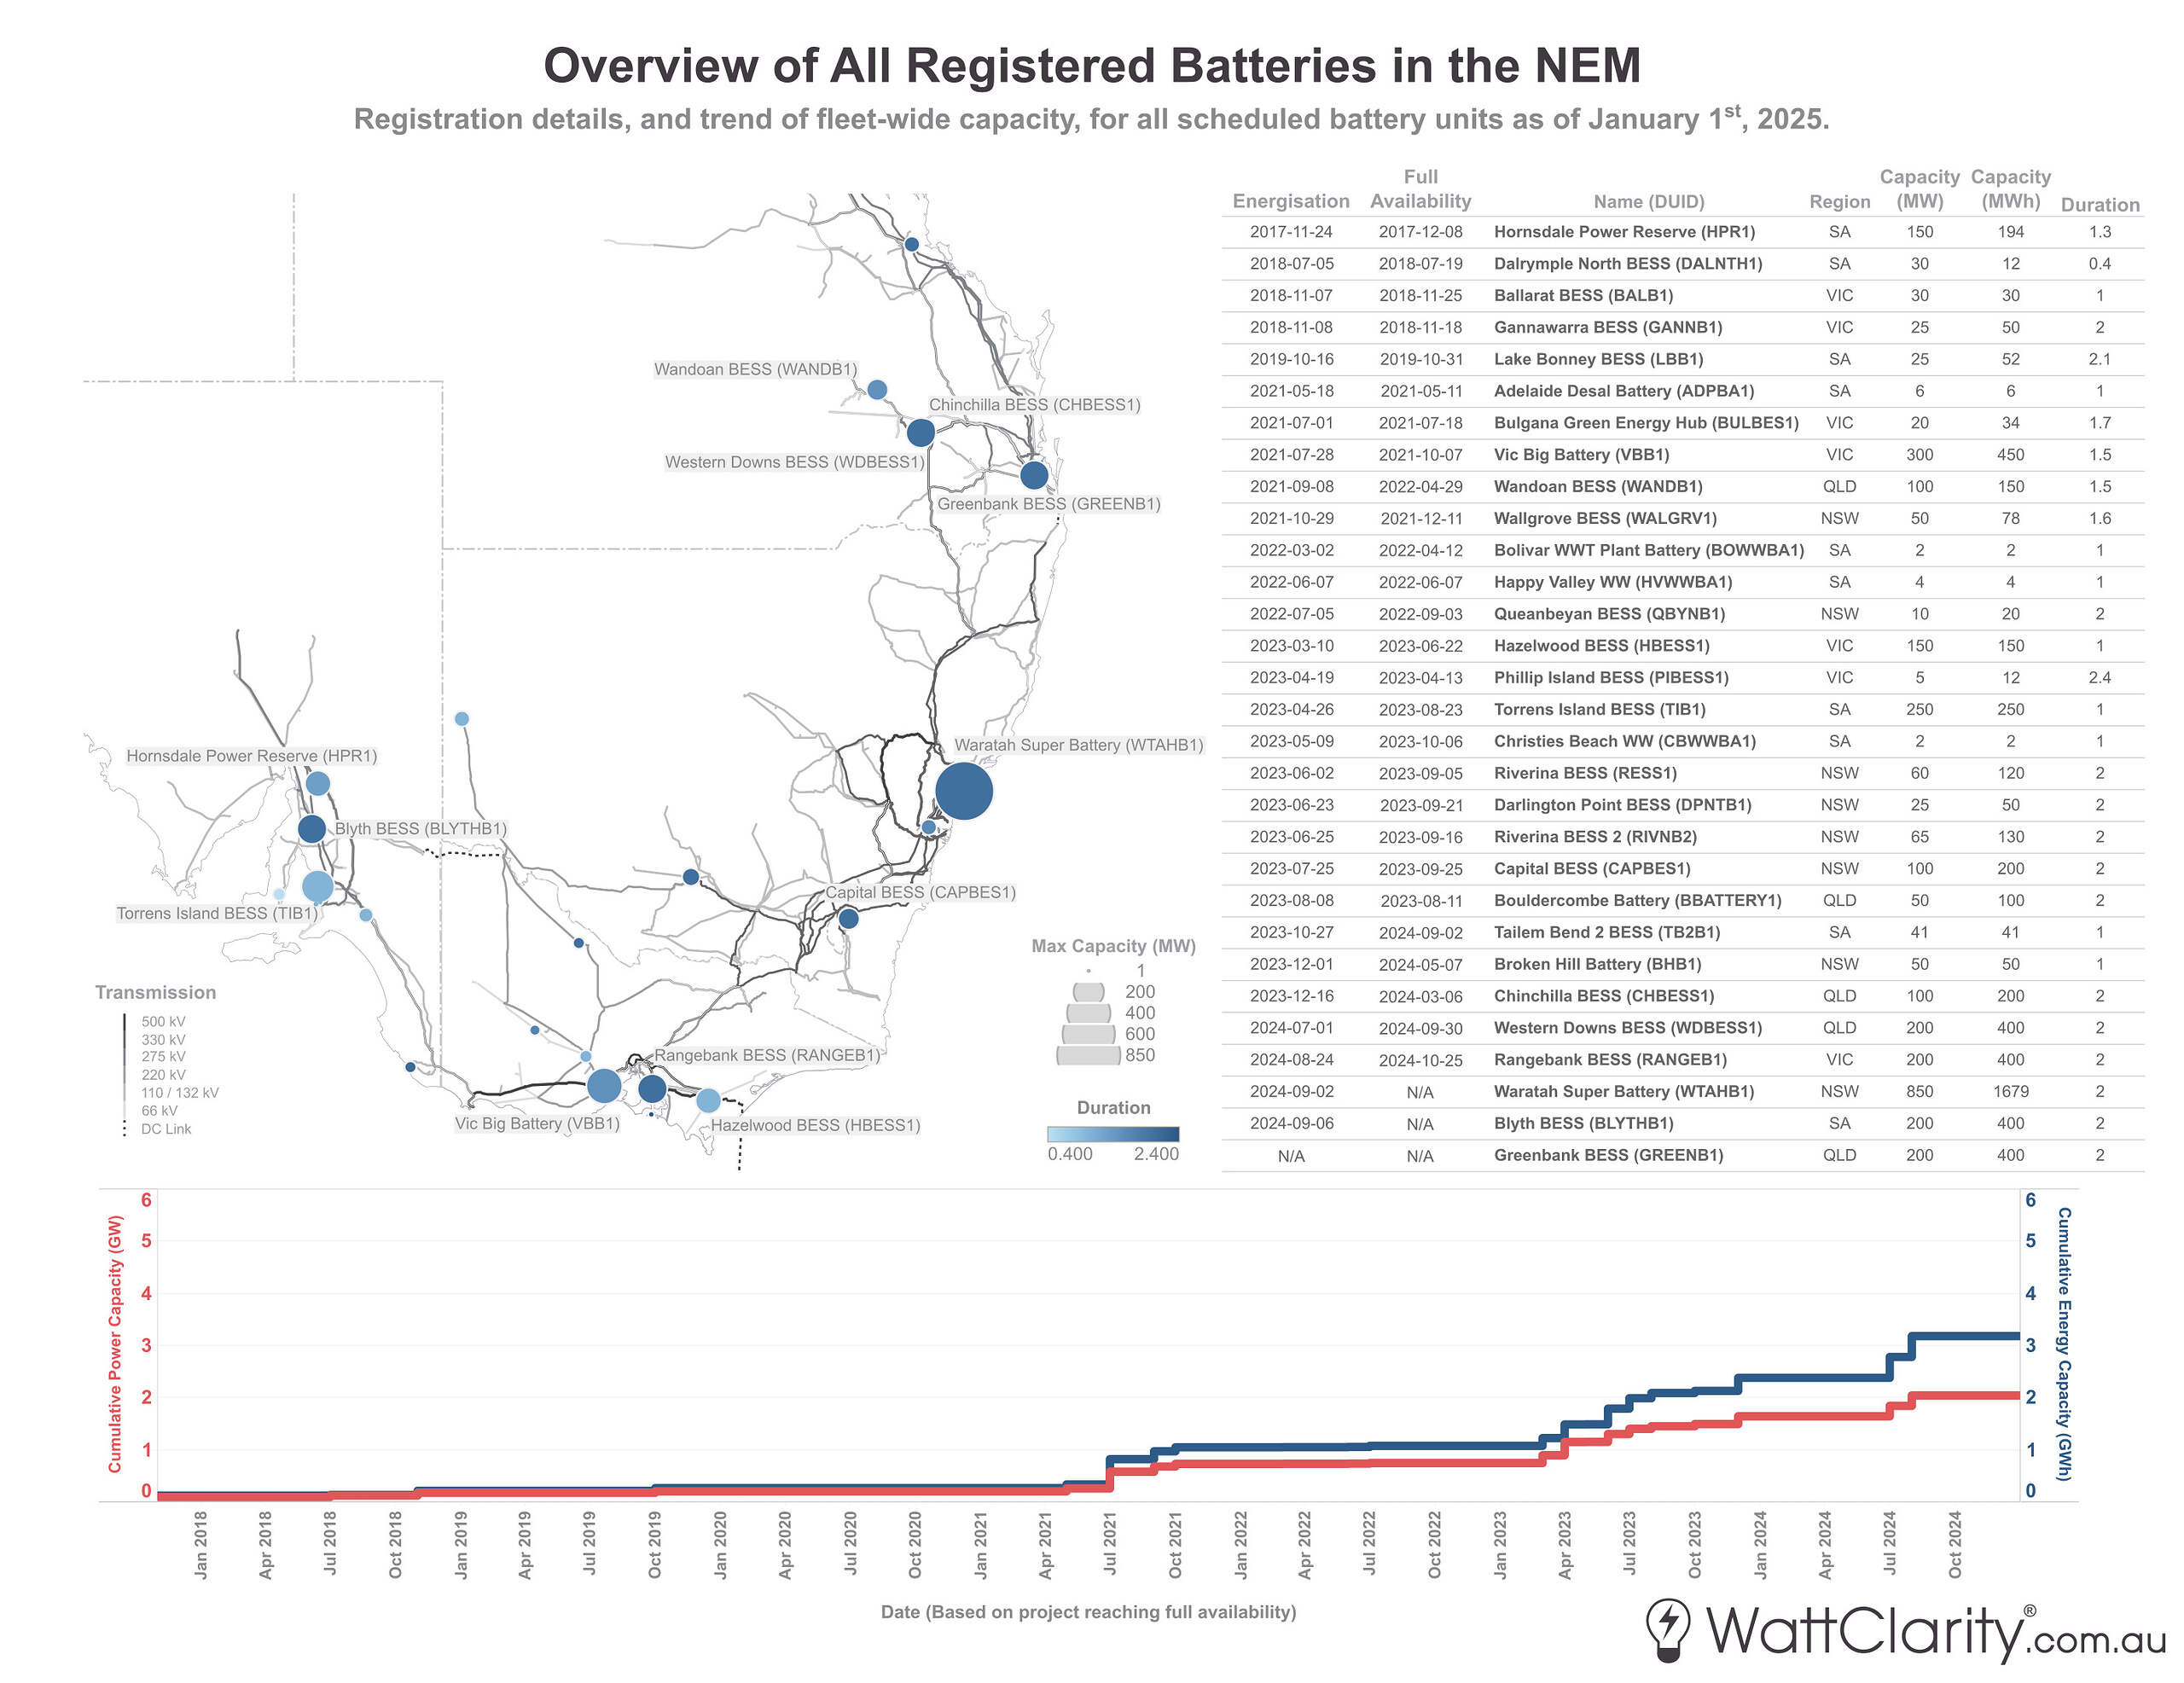
Here is an overview of all thirty big batteries currently registered in the NEM.
Note: Scheduled batteries shown only. Date of energisation based on first non-zero SCADA input/output. Date of full availability based on date when availability first equalled the unit’s maximum capacity.
Source: AEMO MMS
Generally speaking, higher capacity batteries have tended to be sited in the strongest parts of the transmission network — as opposed to the areas with the highest VRE curtailment (which occurs somewhat naturally in weaker parts of the network). To examine the extent of this effect, it is worth comparing the above graphic against this map of network VRE curtailment in 2024, that I posted two weeks ago.
Month-to-month market revenue is increasing, but so too is volatility
Batteries do not generate electricity, they store it, and provide value to the system in many other ways. As such, it’s worth reminding our readers that their revenues generally fall into one of three categories:
- Arbitrage: time-shifting energy by charging during lower-priced periods and discharging during higher-price periods.
- FCAS: Providing enablement for any of the Regulation or Contingency Frequency Control services.
- Capacity and other: All other revenue or accounted-for value derived from the battery’s dispatchable capacity or other capabilities (e.g. use as a virtual cap, involvement in the SIPS program, etc.)
The first two categories — often termed ‘market revenue’ or ‘merchant revenue’ — are visible in market data. The third, however, is largely opaque due to commercial confidentiality. I won’t cover that category in this article, but in my previous analysis I have shared known information and some examples of these forms of revenue.
In the chart below, we see the long-term trend of aggregate market revenue for the fleet as a whole.
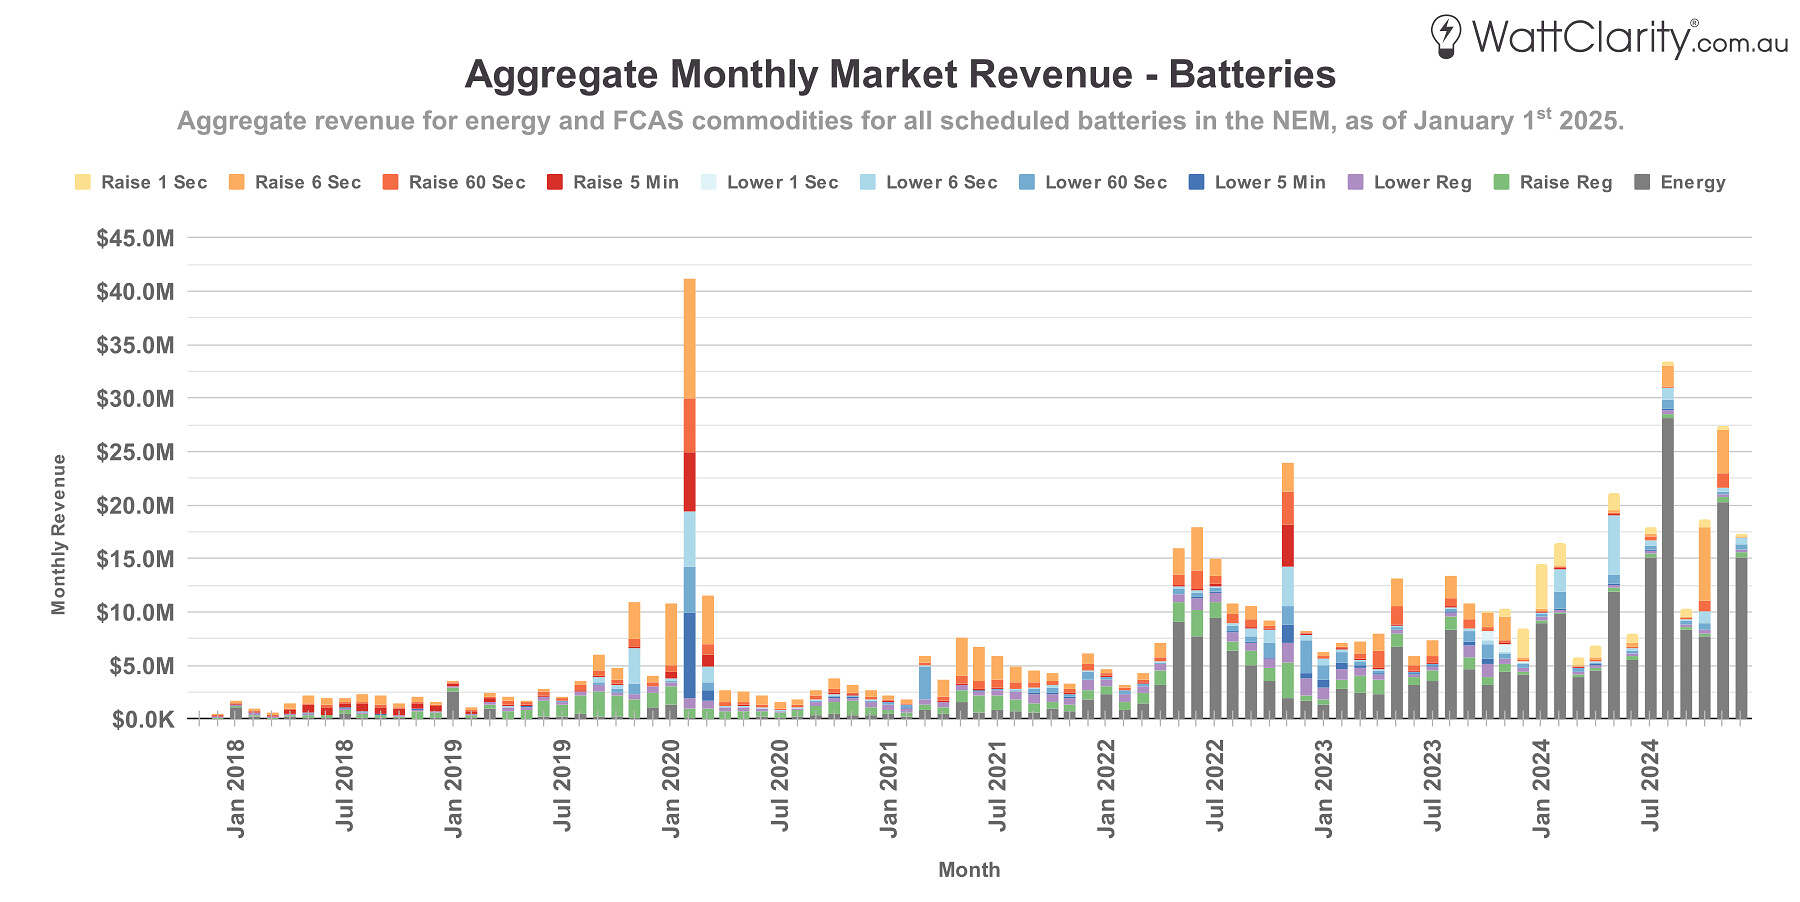
Month-to-month volatility for battery revenue became more pronounced throughout 2024.
Notes: Energy portion represents net arbitrage revenue. Applies for scheduled batteries only. Figures differ from last year’s version of this chart which excluded batteries < 10 MW.
Source: GSD2024 Data Extract
Prior to 2024, we can see two notable outliers in the long-run trend – when South Australian batteries experienced unexpected windfalls during separate but abrupt islanding events: the first starting in late January 2020 and another in November 2022.
More recently, and most pronounced in 2024, we see that revenue during ‘normal’ operations has been on the rise. This is driven not only by the growing capacity of the fleet, but also by increasing revenue gains from energy/arbitrage, as I’ll discuss later.
While total revenue trended upwards in 2024, the month-to-month view above highlights the volatile nature of these revenue uplifts. Further below I’ll present a list of some of the extreme pricing events that contributed to those uplifts.
Arbitrage overtook FCAS revenues throughout 2024
Using the same data from the last chart, we can extrapolate the split of market revenue between arbitrage and FCAS for the big battery fleet.

Throughout 2024, arbitrage well and truly overtook FCAS as the primary source of market revenue for the fleet as a whole.
Note: Applies for scheduled batteries only.
Source: GSD2024 Data Extract
Interestingly, Linton reported last Monday that 2024 marked the first time that inverter-based resources (mainly batteries) had overtaken traditional thermal generators as the primary provider of FCAS across all ten FCAS commodities. Despite this milestone, the chart above makes it clear that FCAS no longer appears to be the primary revenue source for the fleet.
Big(ger) batteries are increasingly involved in price-setting
Page 20 of the AEMO’s Quarterly Energy Dynamics report for last quarter, made note of the increased price-setting influence of big batteries:
“Batteries’ involvement in price setting during peak high-priced volatility periods led to the largest year-on-year growth in average price set for any source, averaging $309/MWh, $110/MWh higher than in Q4 2023” – AEMO QED
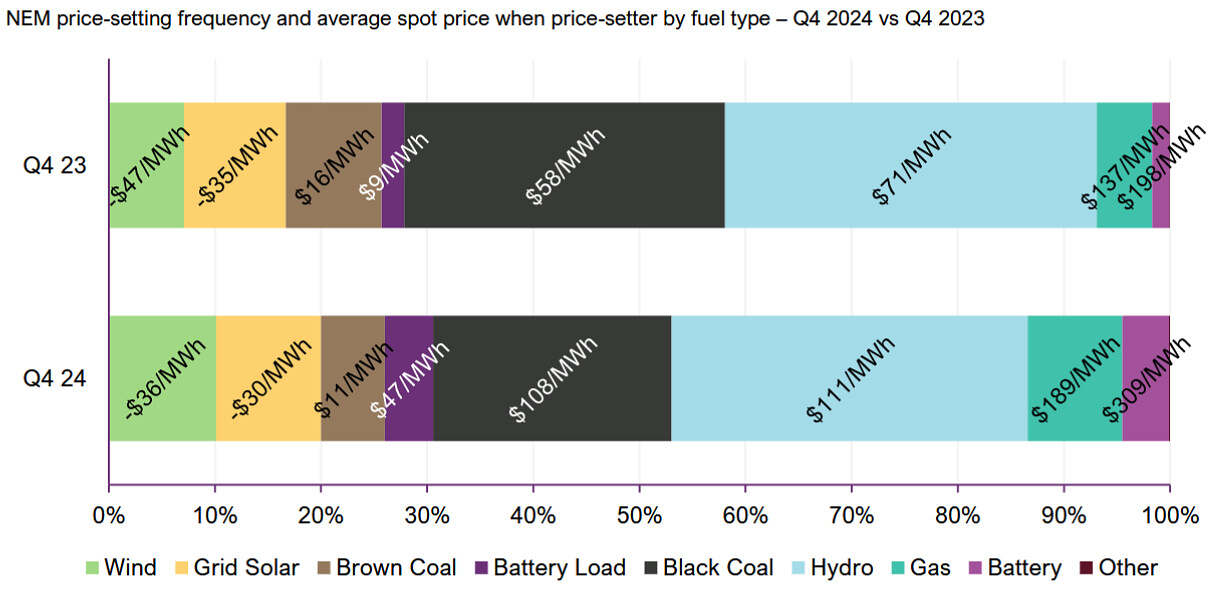
The AEMO’s latest QED highlighted that batteries increased both their share of price setting involvement, and the average price set during these involvements, between Q4 2023 and Q4 2024.
Source: AEMO QED
In our GSD report, we’ve processed the AEMO’s price setter files and summarised this data on a unit-by-unit basis. In the chart below, I have plotted the count of intervals with price setting involvement from big batteries when eventuating prices were set above $300/MWh for 2023 vs 2024.
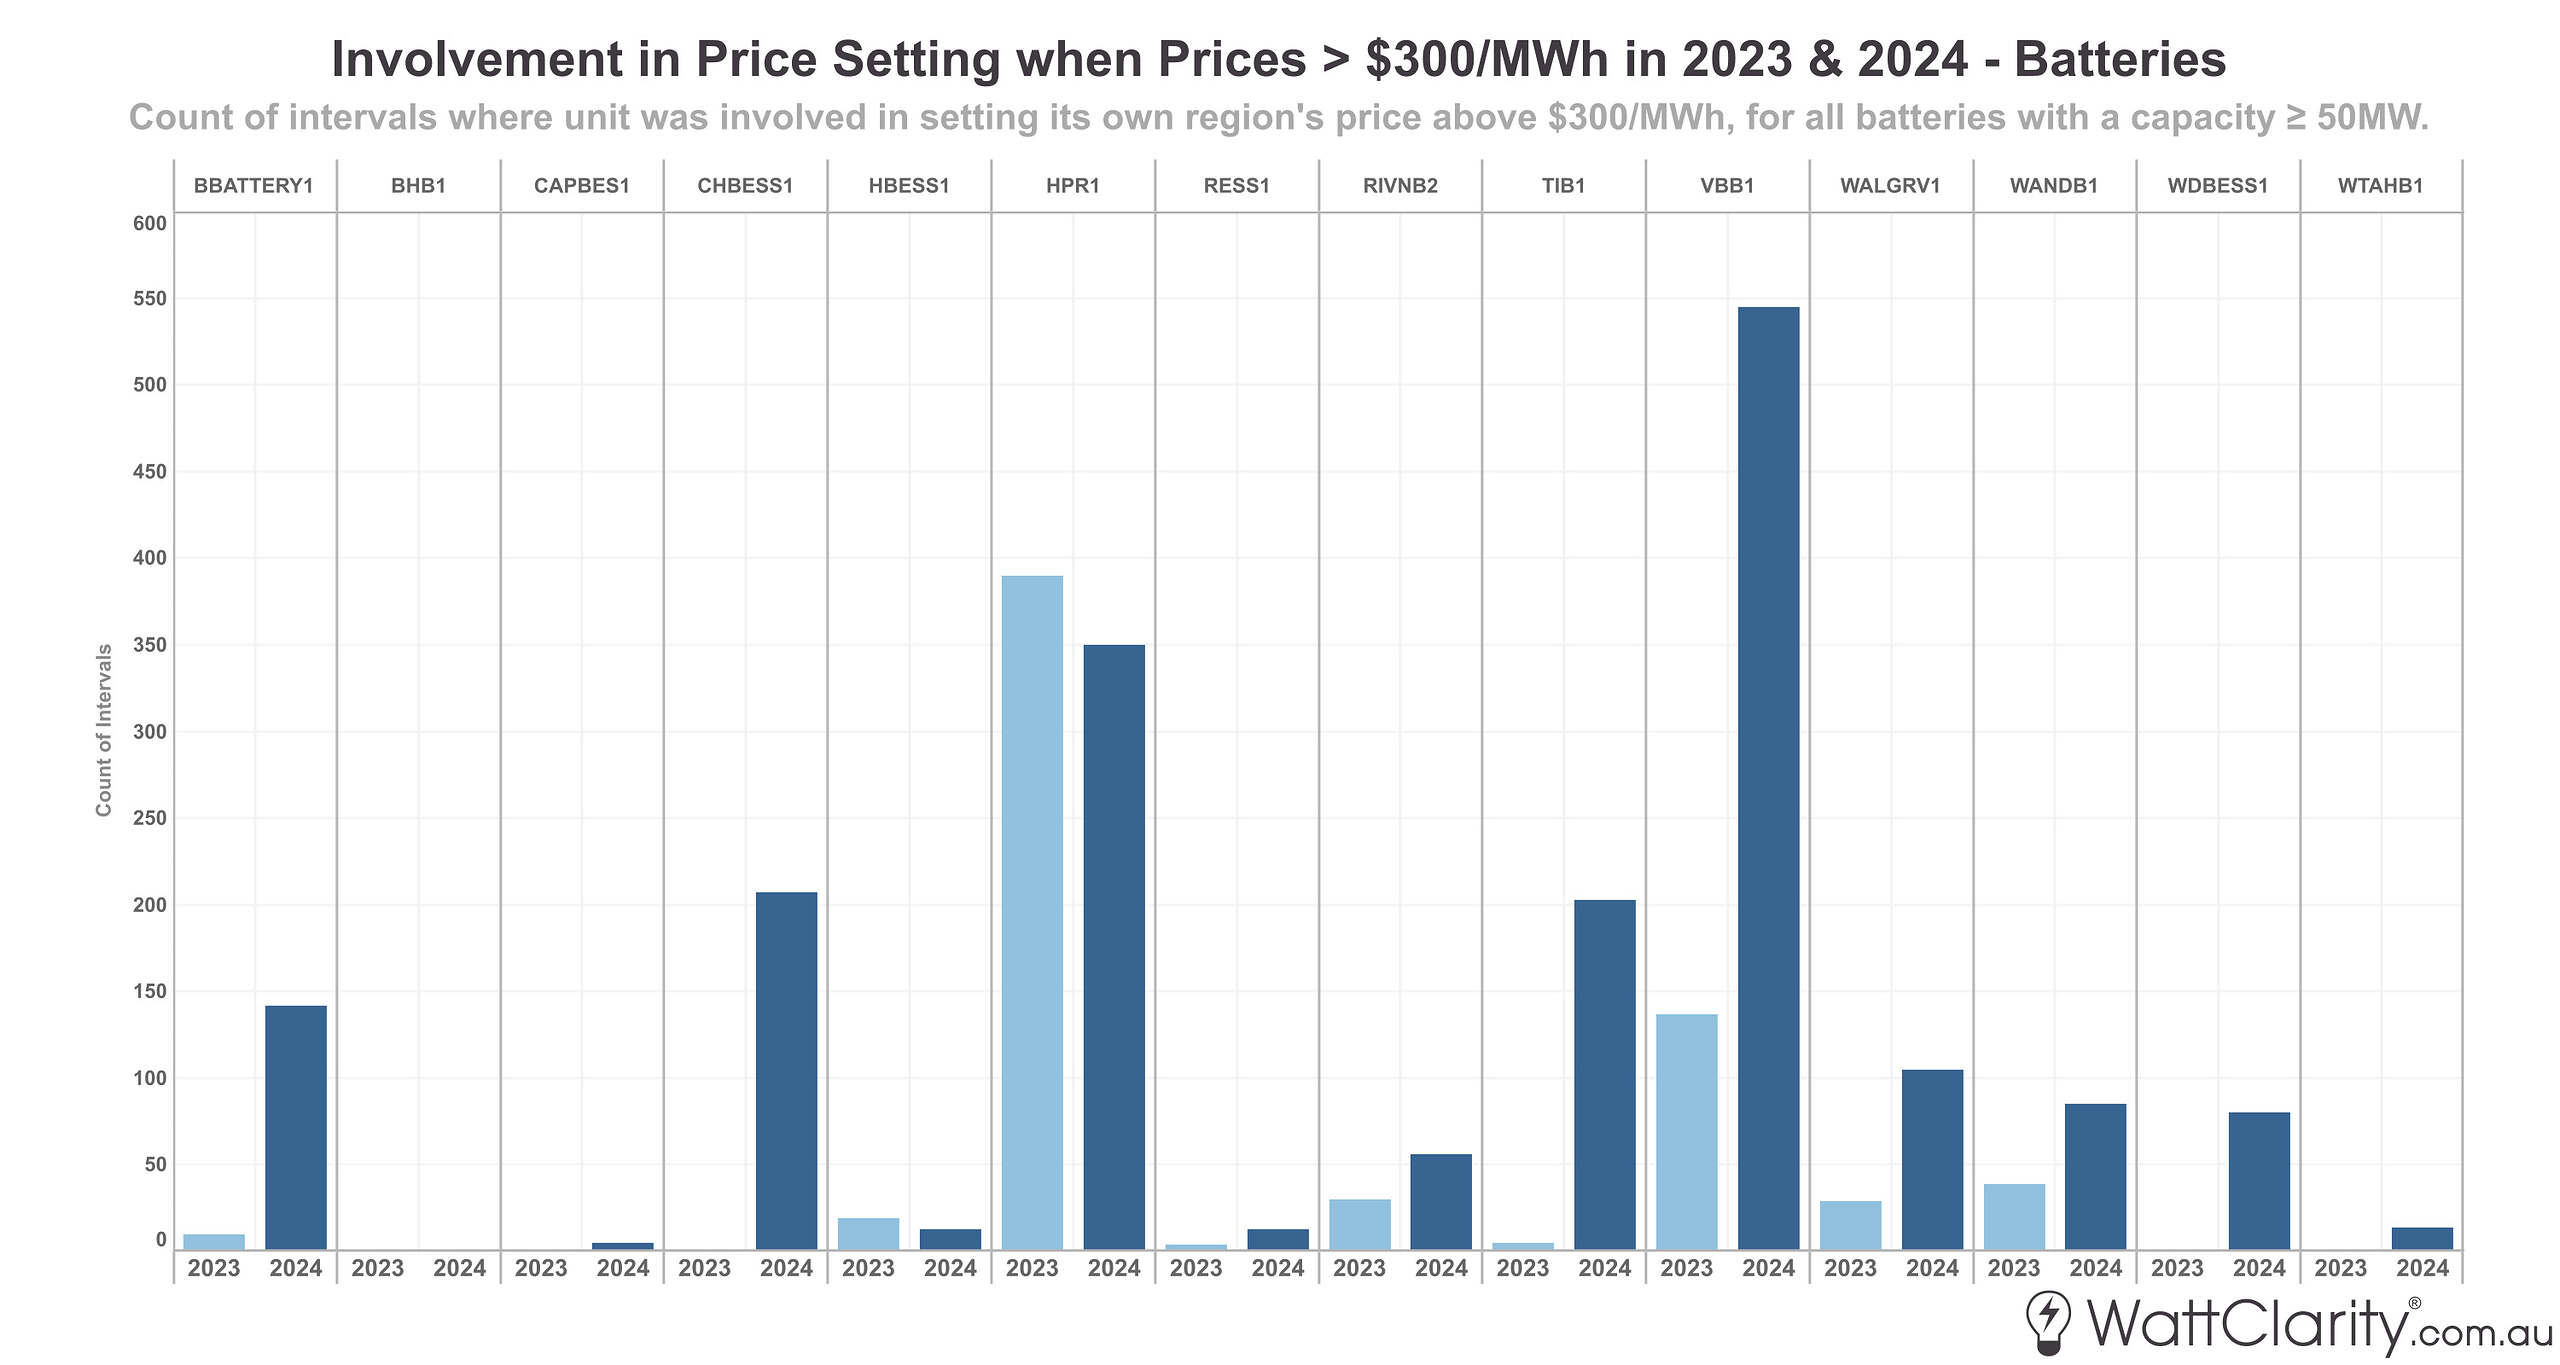
The VIC Big Battery was involved in price-setting above $300/MWh for more than 45 hours last year.
Note: Only batteries with a power capacity of greater than or equal to 50 MW shown.
Source: GSD2024 Data Extract
We can see that the higher/highest capacity batteries in each region are becoming increasingly influential in price setting. When we publish this review again next year, expect the Waratah Super Battery and Torrens Island BESS to up these numbers, as their operations will be scaled up throughout 2025.
I would also caution that price-setter data should be interpreted as indicative only, as there are many (many) complexities when trying to understand price outcomes in each dispatch interval — a topic that Allan O’Neil has previously explored and explained for our readers.
Micro observations about individual performances and events
In this section we’ll look at some financial and operational performance metrics for each of the big batteries, and try to understand underlying market drivers and specific events of note.
Increase in ‘high-high’ prices raises arbitrage returns
When it came to arbitrage, it appears a truism that a rising tide lifts all boats.
The chart below is a simple plot ranking arbitrage revenue (per MW of capacity) throughout 2024 for each big battery, and also shows the year-on-year change from 2023.
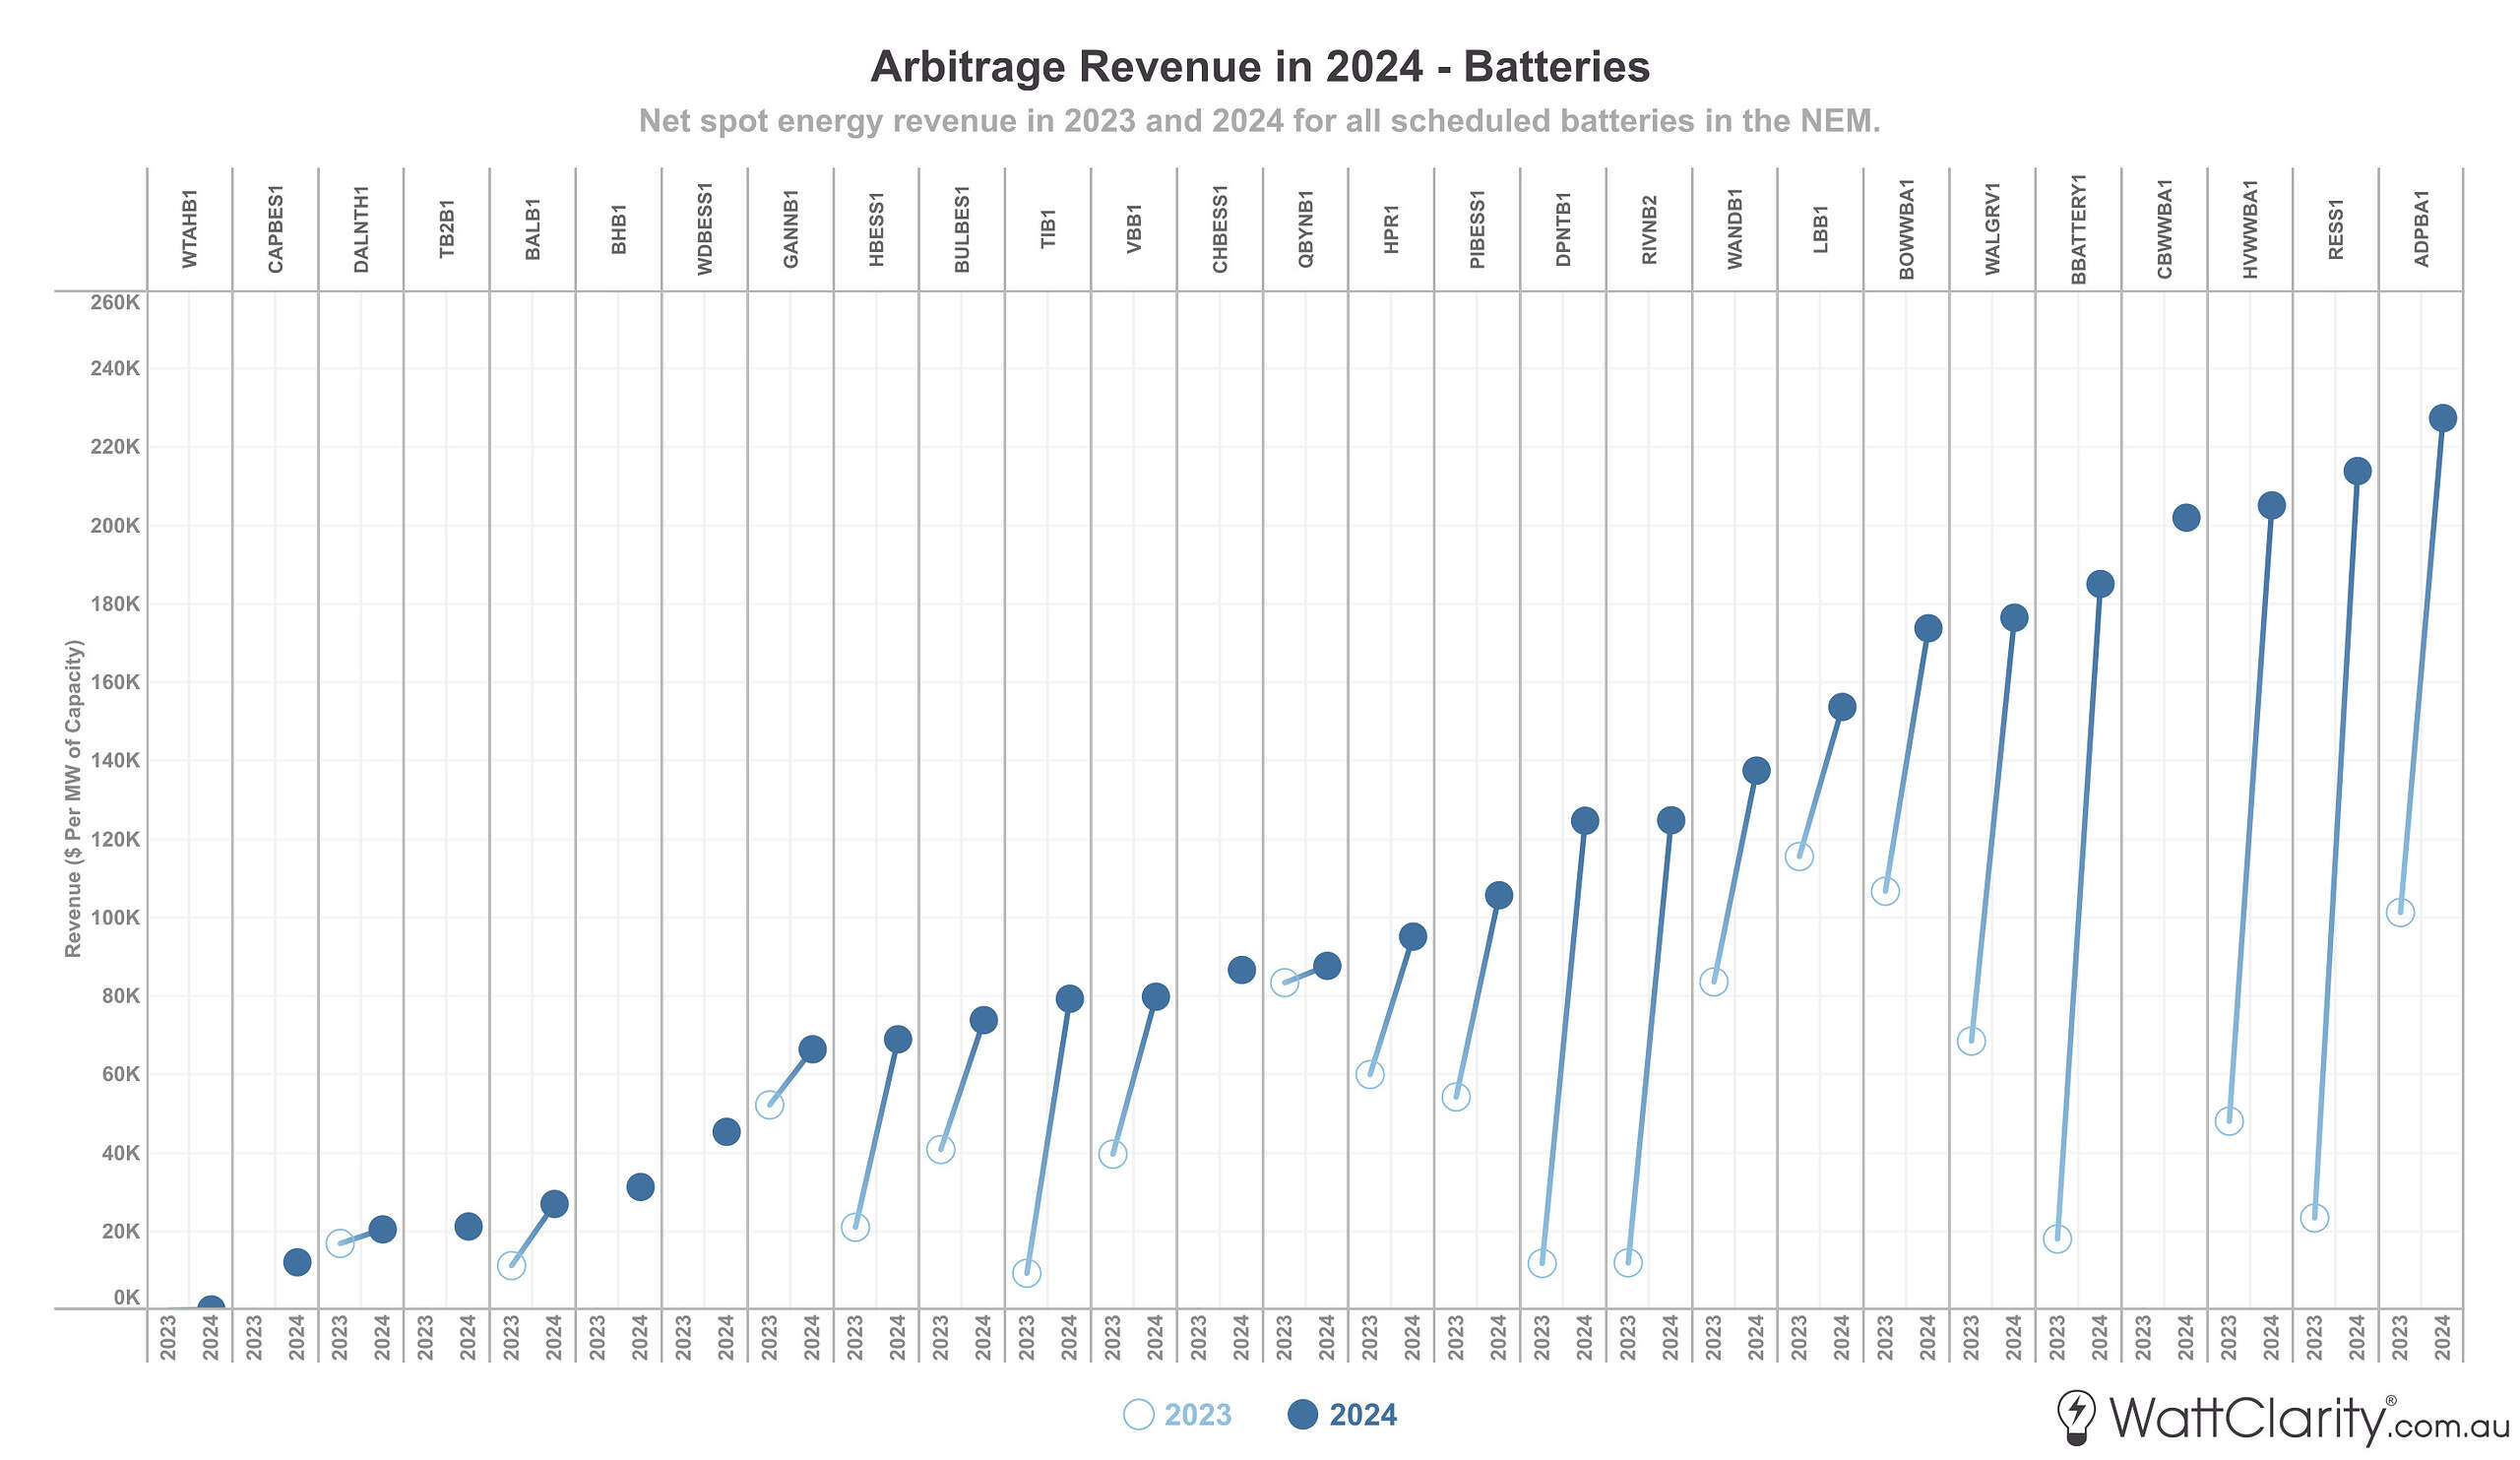
Every single big battery saw YoY increases in arbitrage revenue for 2024.
Note: Only scheduled batteries with positive revenues in 2024 are shown.
Source: GSD2024 Data Extract
As the fleet is relatively young, several of these upwards movements can be attributed to a number of batteries progressing through and past commissioning, and thus ramping up operations. However, all incumbents also saw an up-tick in arbitrage returns.
As is usually the case for arbitrage, the biggest factor driving those results in 2024 were (1) the number of occurrences of ‘high-high’ prices in each battery’s region, and (2) the ability for each battery to capture such prices.
The horizontal bars in the chart below represent the percentage of production and availability of each battery during intervals where the price in their region went above $10,000/MWh. The ‘Total Time’ column on the right represents the number of hours that prices spent above that mark in each battery’s respective region i.e. NSW (16h 55m), QLD (8h 10m), SA (7h 55m) and VIC (4h 55m).
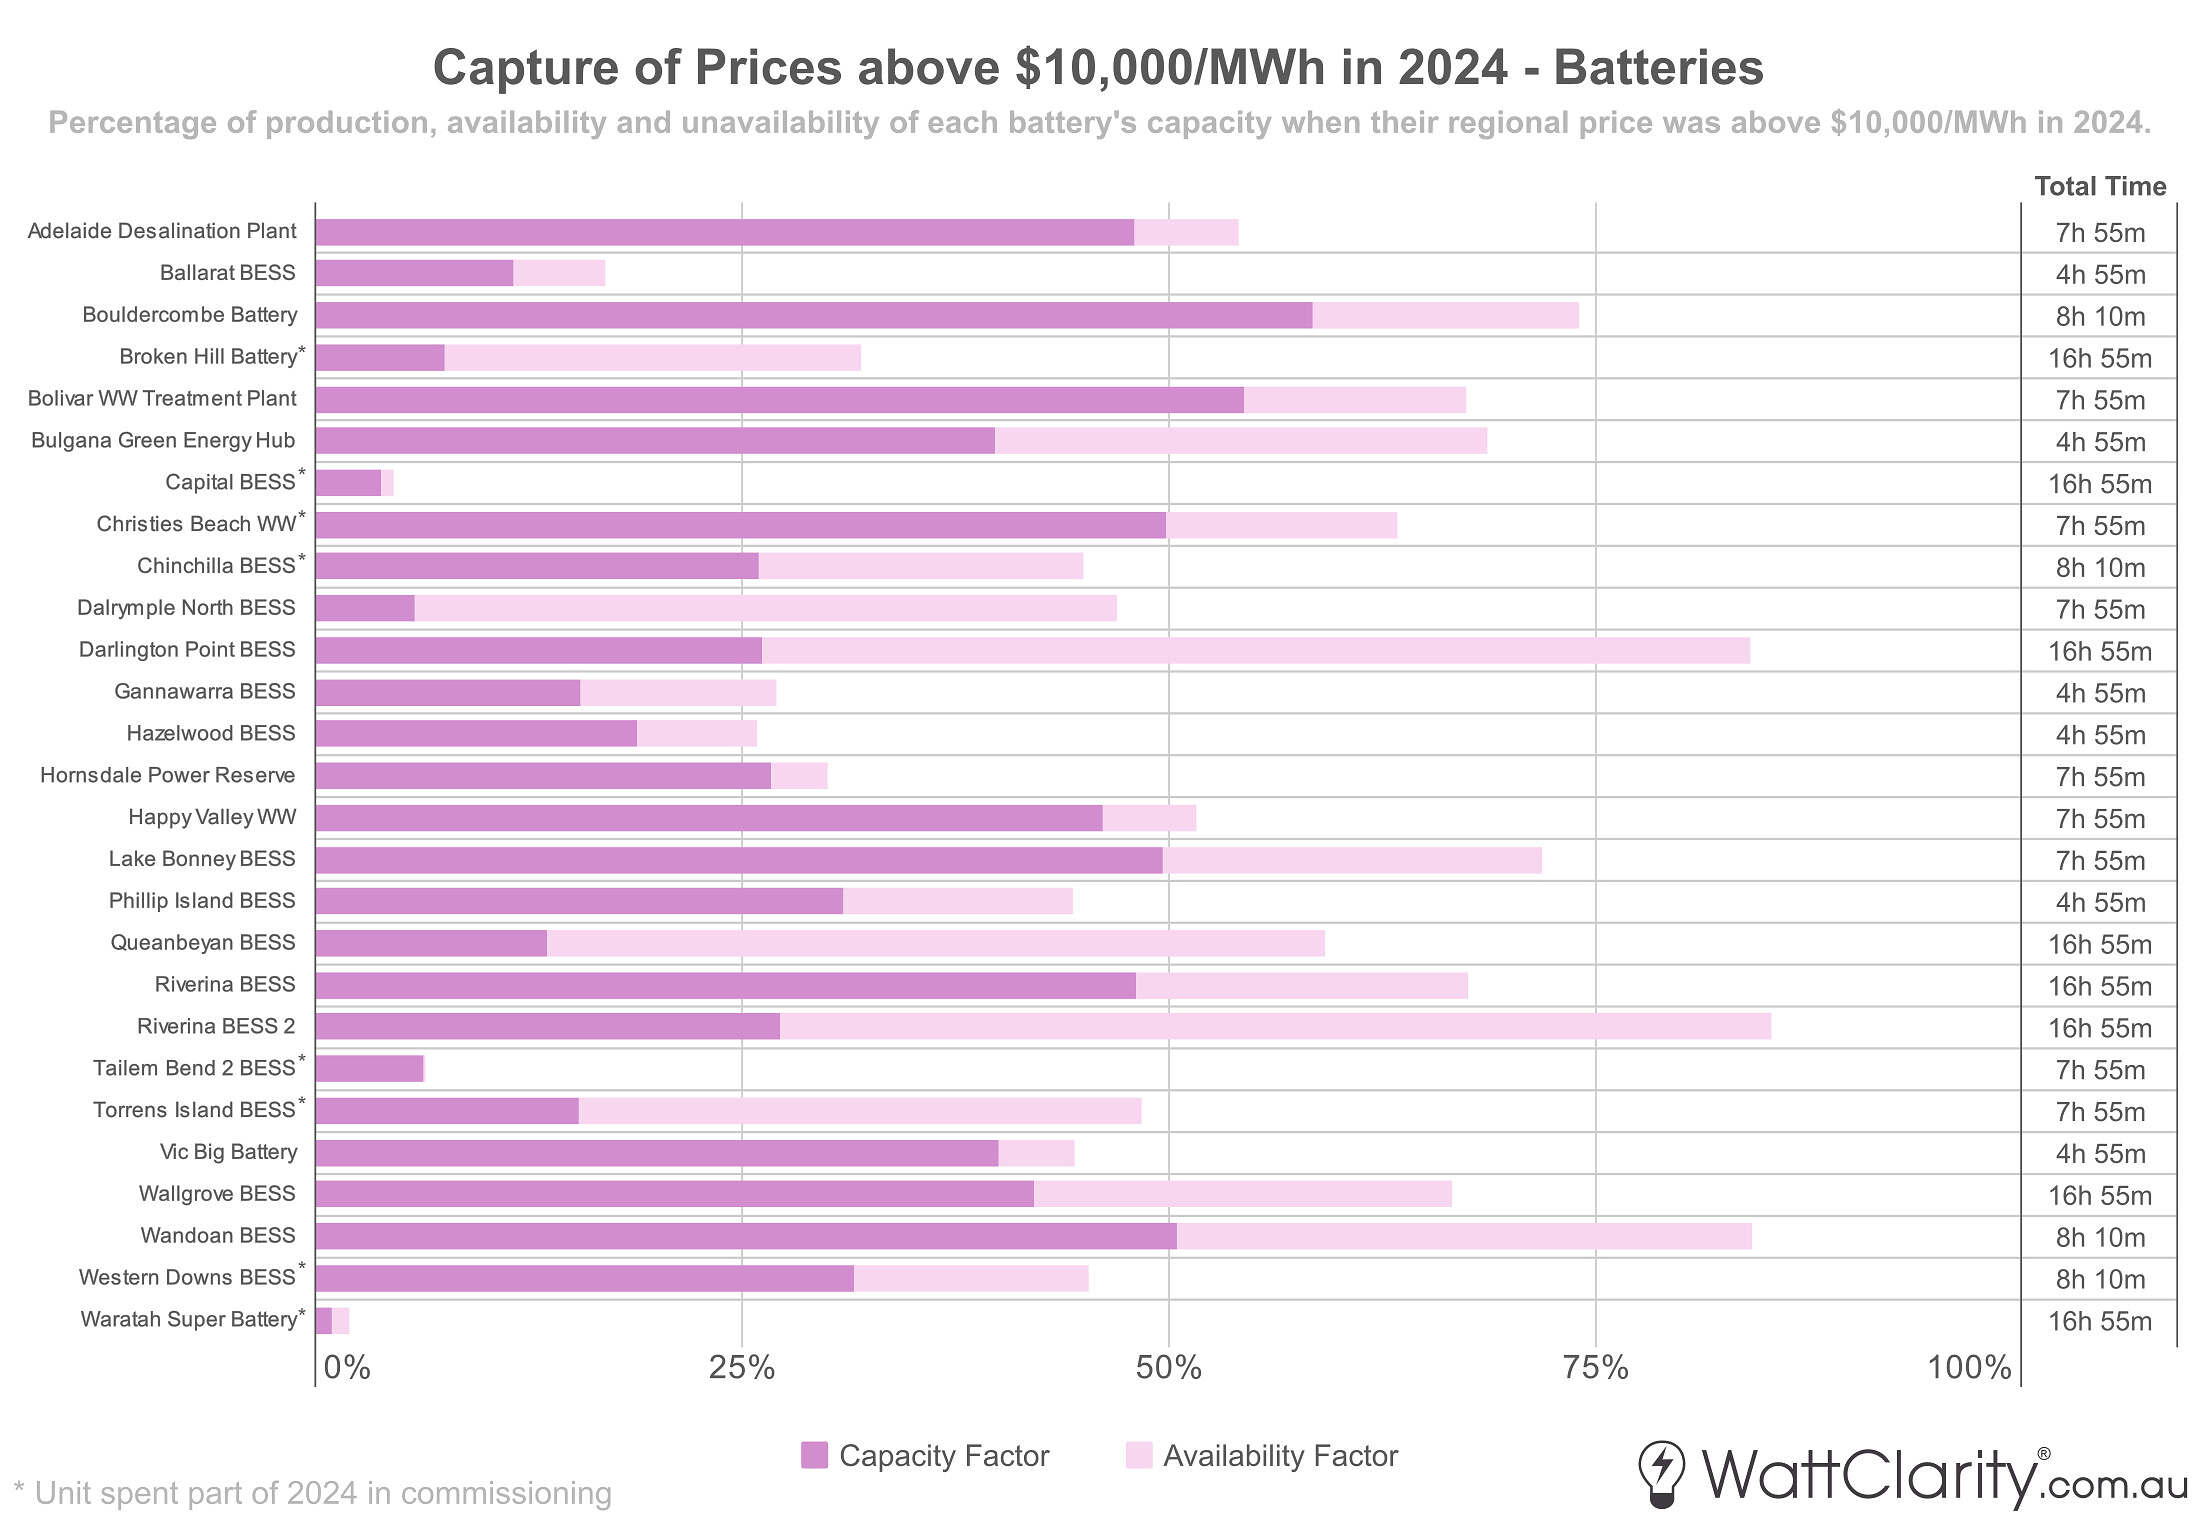
While we aren’t seeing clear evidence that the fleet is improving its accuracy in capturing high prices, the increased frequency of ‘high-high’ prices drove increased arbitrage returns.
Note: Capacity factor based on 5-minute SCADA values
Source: GSD2024 Data Extract
It’s worth comparing this chart to a similar chart that I presented for the 2023 calendar year. From viewing both, it should be immediately obvious that there were nowhere near the amount of ‘high-high’ priced intervals in 2023 compared to what we just saw in 2024.
While isolated price spikes were scattered throughout last calendar year, there were a number of days where extreme prices sustained for extended periods. Of particular note were the following days (you can click through the links to read our analysis and commentary about the events that unfolded on each of these days):
- January 19th in QLD
- February 13th in VIC
- May 7th and May 8th in NSW
- July 28th in SA
- August 5th in SA, VIC, NSW and QLD
- September 23rd in SA
- November 7th in QLD and NSW
- November 27th in NSW
- December 2nd in QLD and NSW
Did 2024 show us that FCAS markets are a shrinking pie?
These extreme prices in the energy spot market were not mirrored in FCAS prices in 2024, meaning that this revenue stream did not generate the same level of uniformly strong returns.
The next chart is a ranked view of FCAS revenue (per MW of capacity) for each battery in 2024, and year-on-year change from 2023.
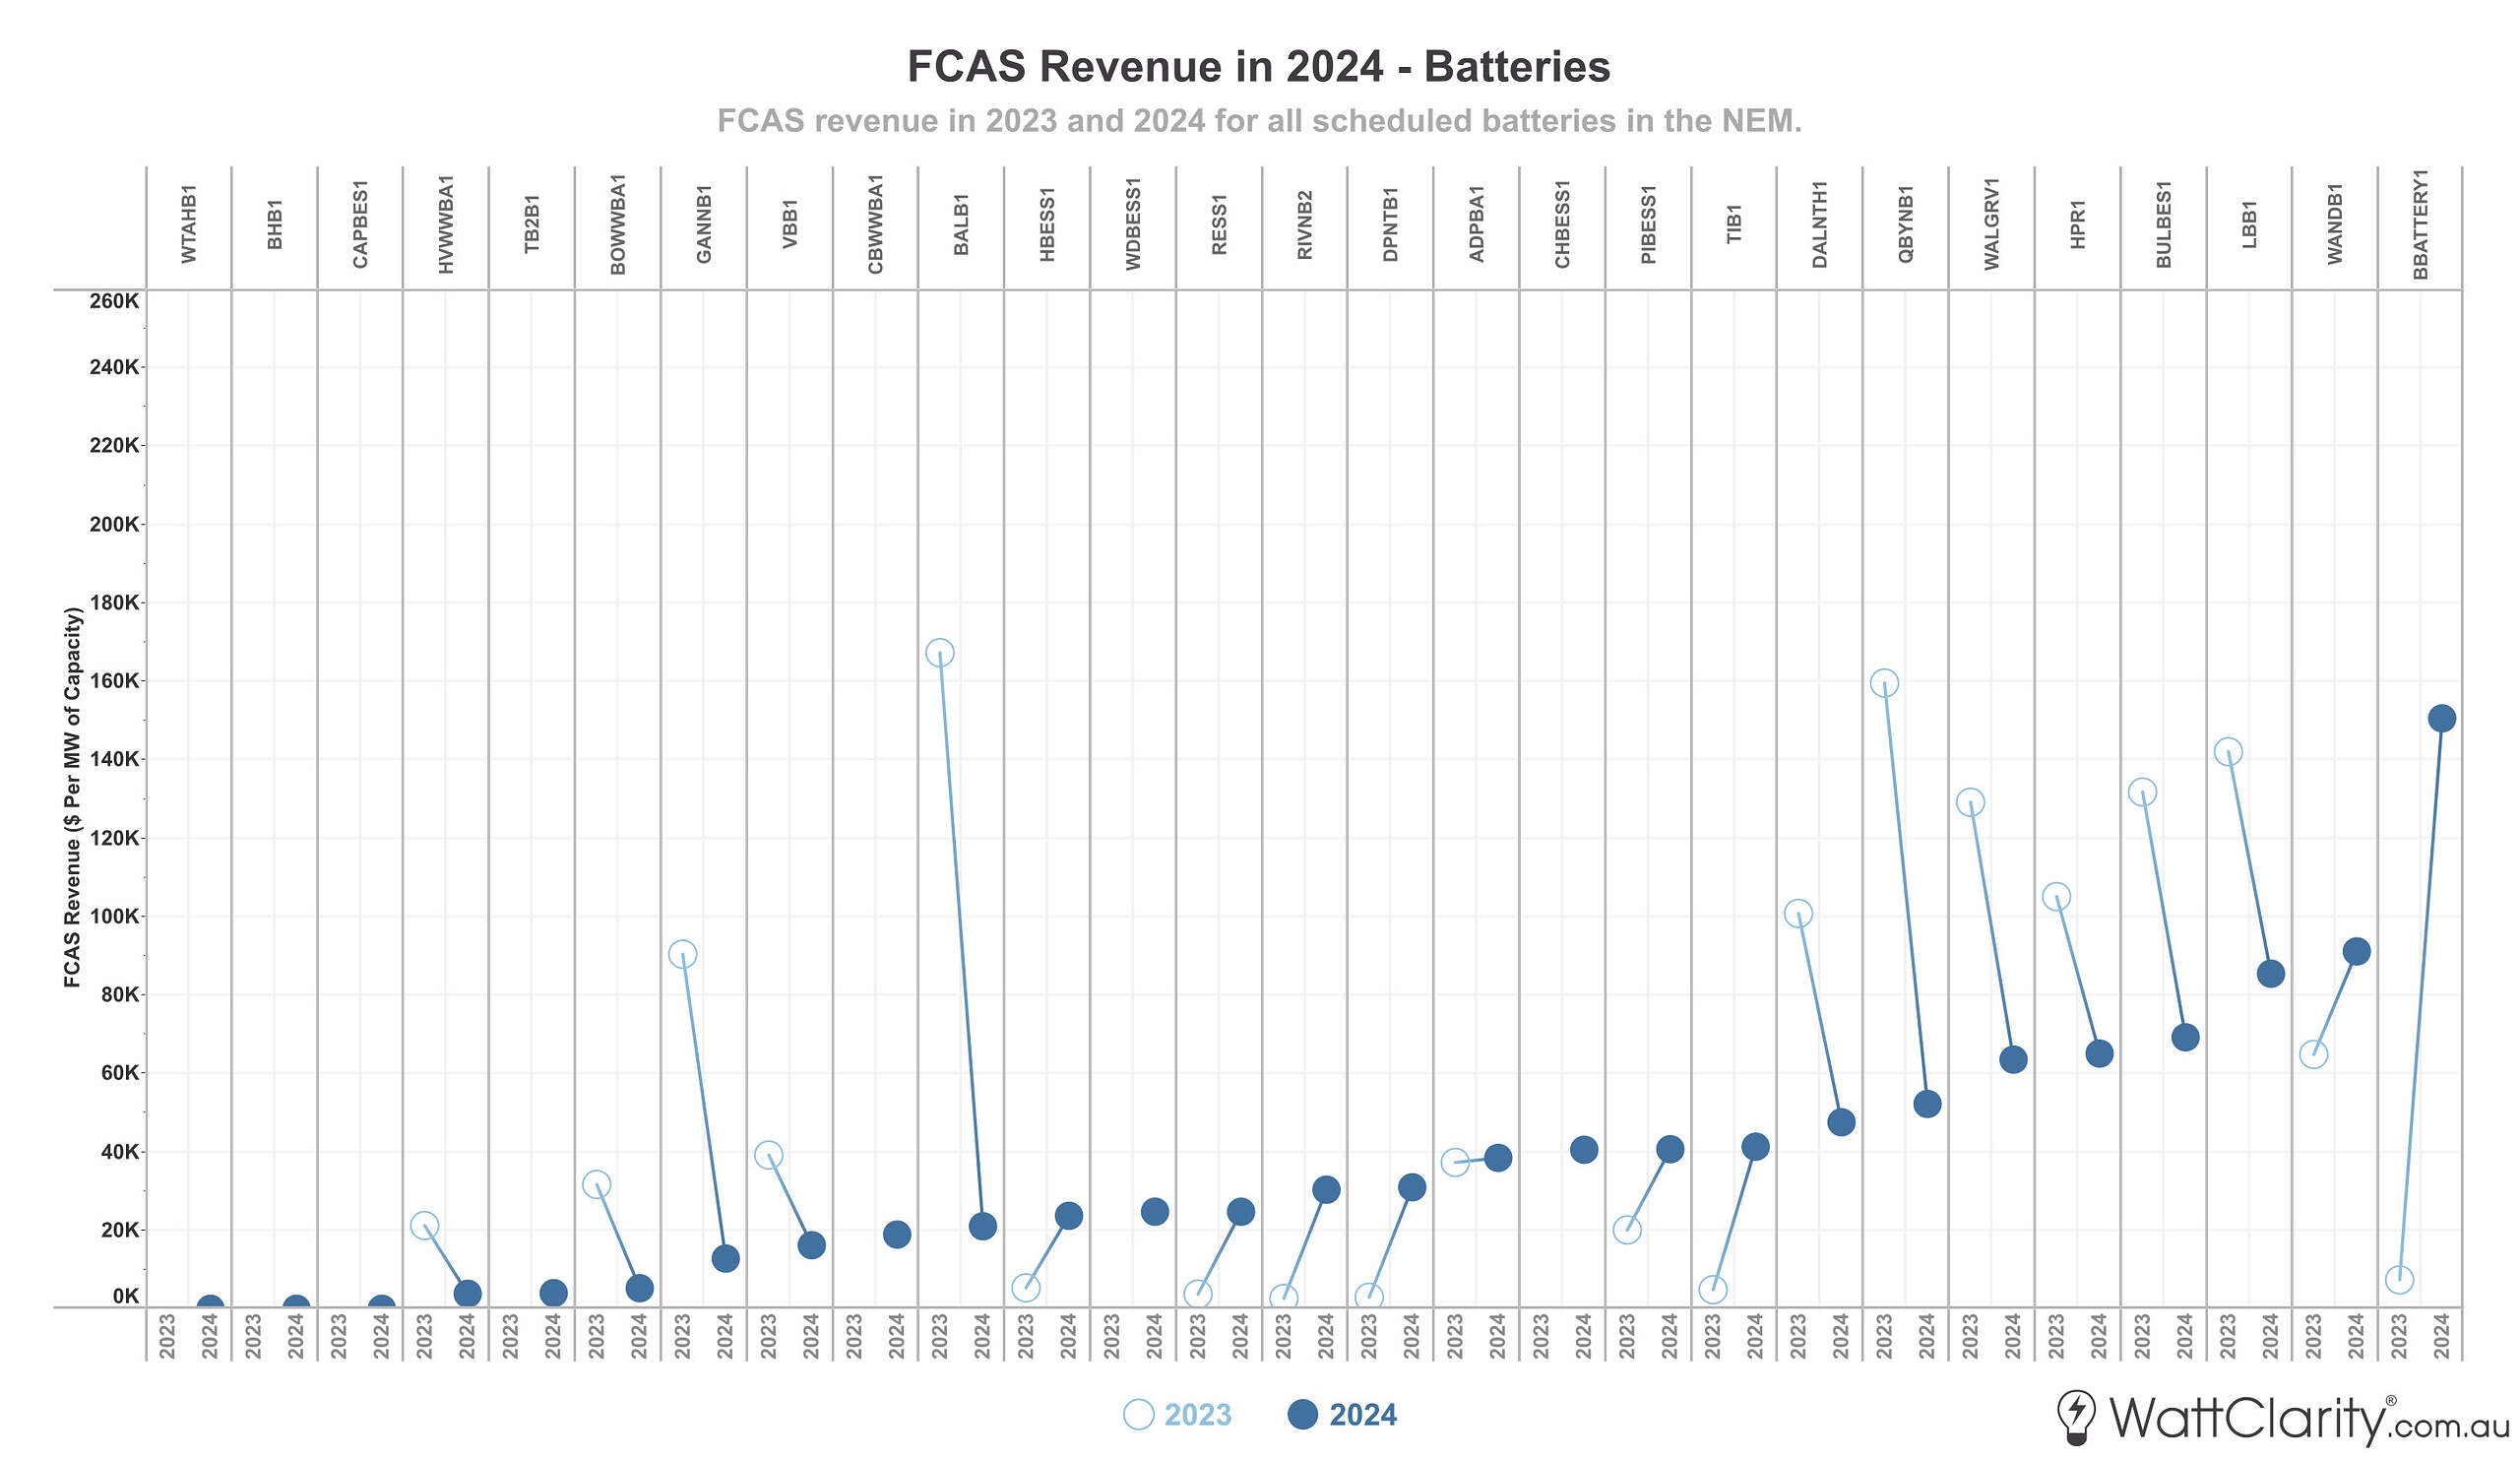
Some incumbents saw normalised FCAS revenue decrease significantly in 2024, as new (and larger) batteries appear to have increased competition in relatively shallow markets.
Source: GSD2024 Data Extract
With several larger batteries ramping up operations and other factors at play, normalised FCAS returns declined year-over-year for a number of incumbents, most notably for the Ballarat BESS, Gannawarra BESS, and Queanbeyan BESS.
Shifting market dynamics led to diverging performances
The combined view of those last two charts has been aggregated below.
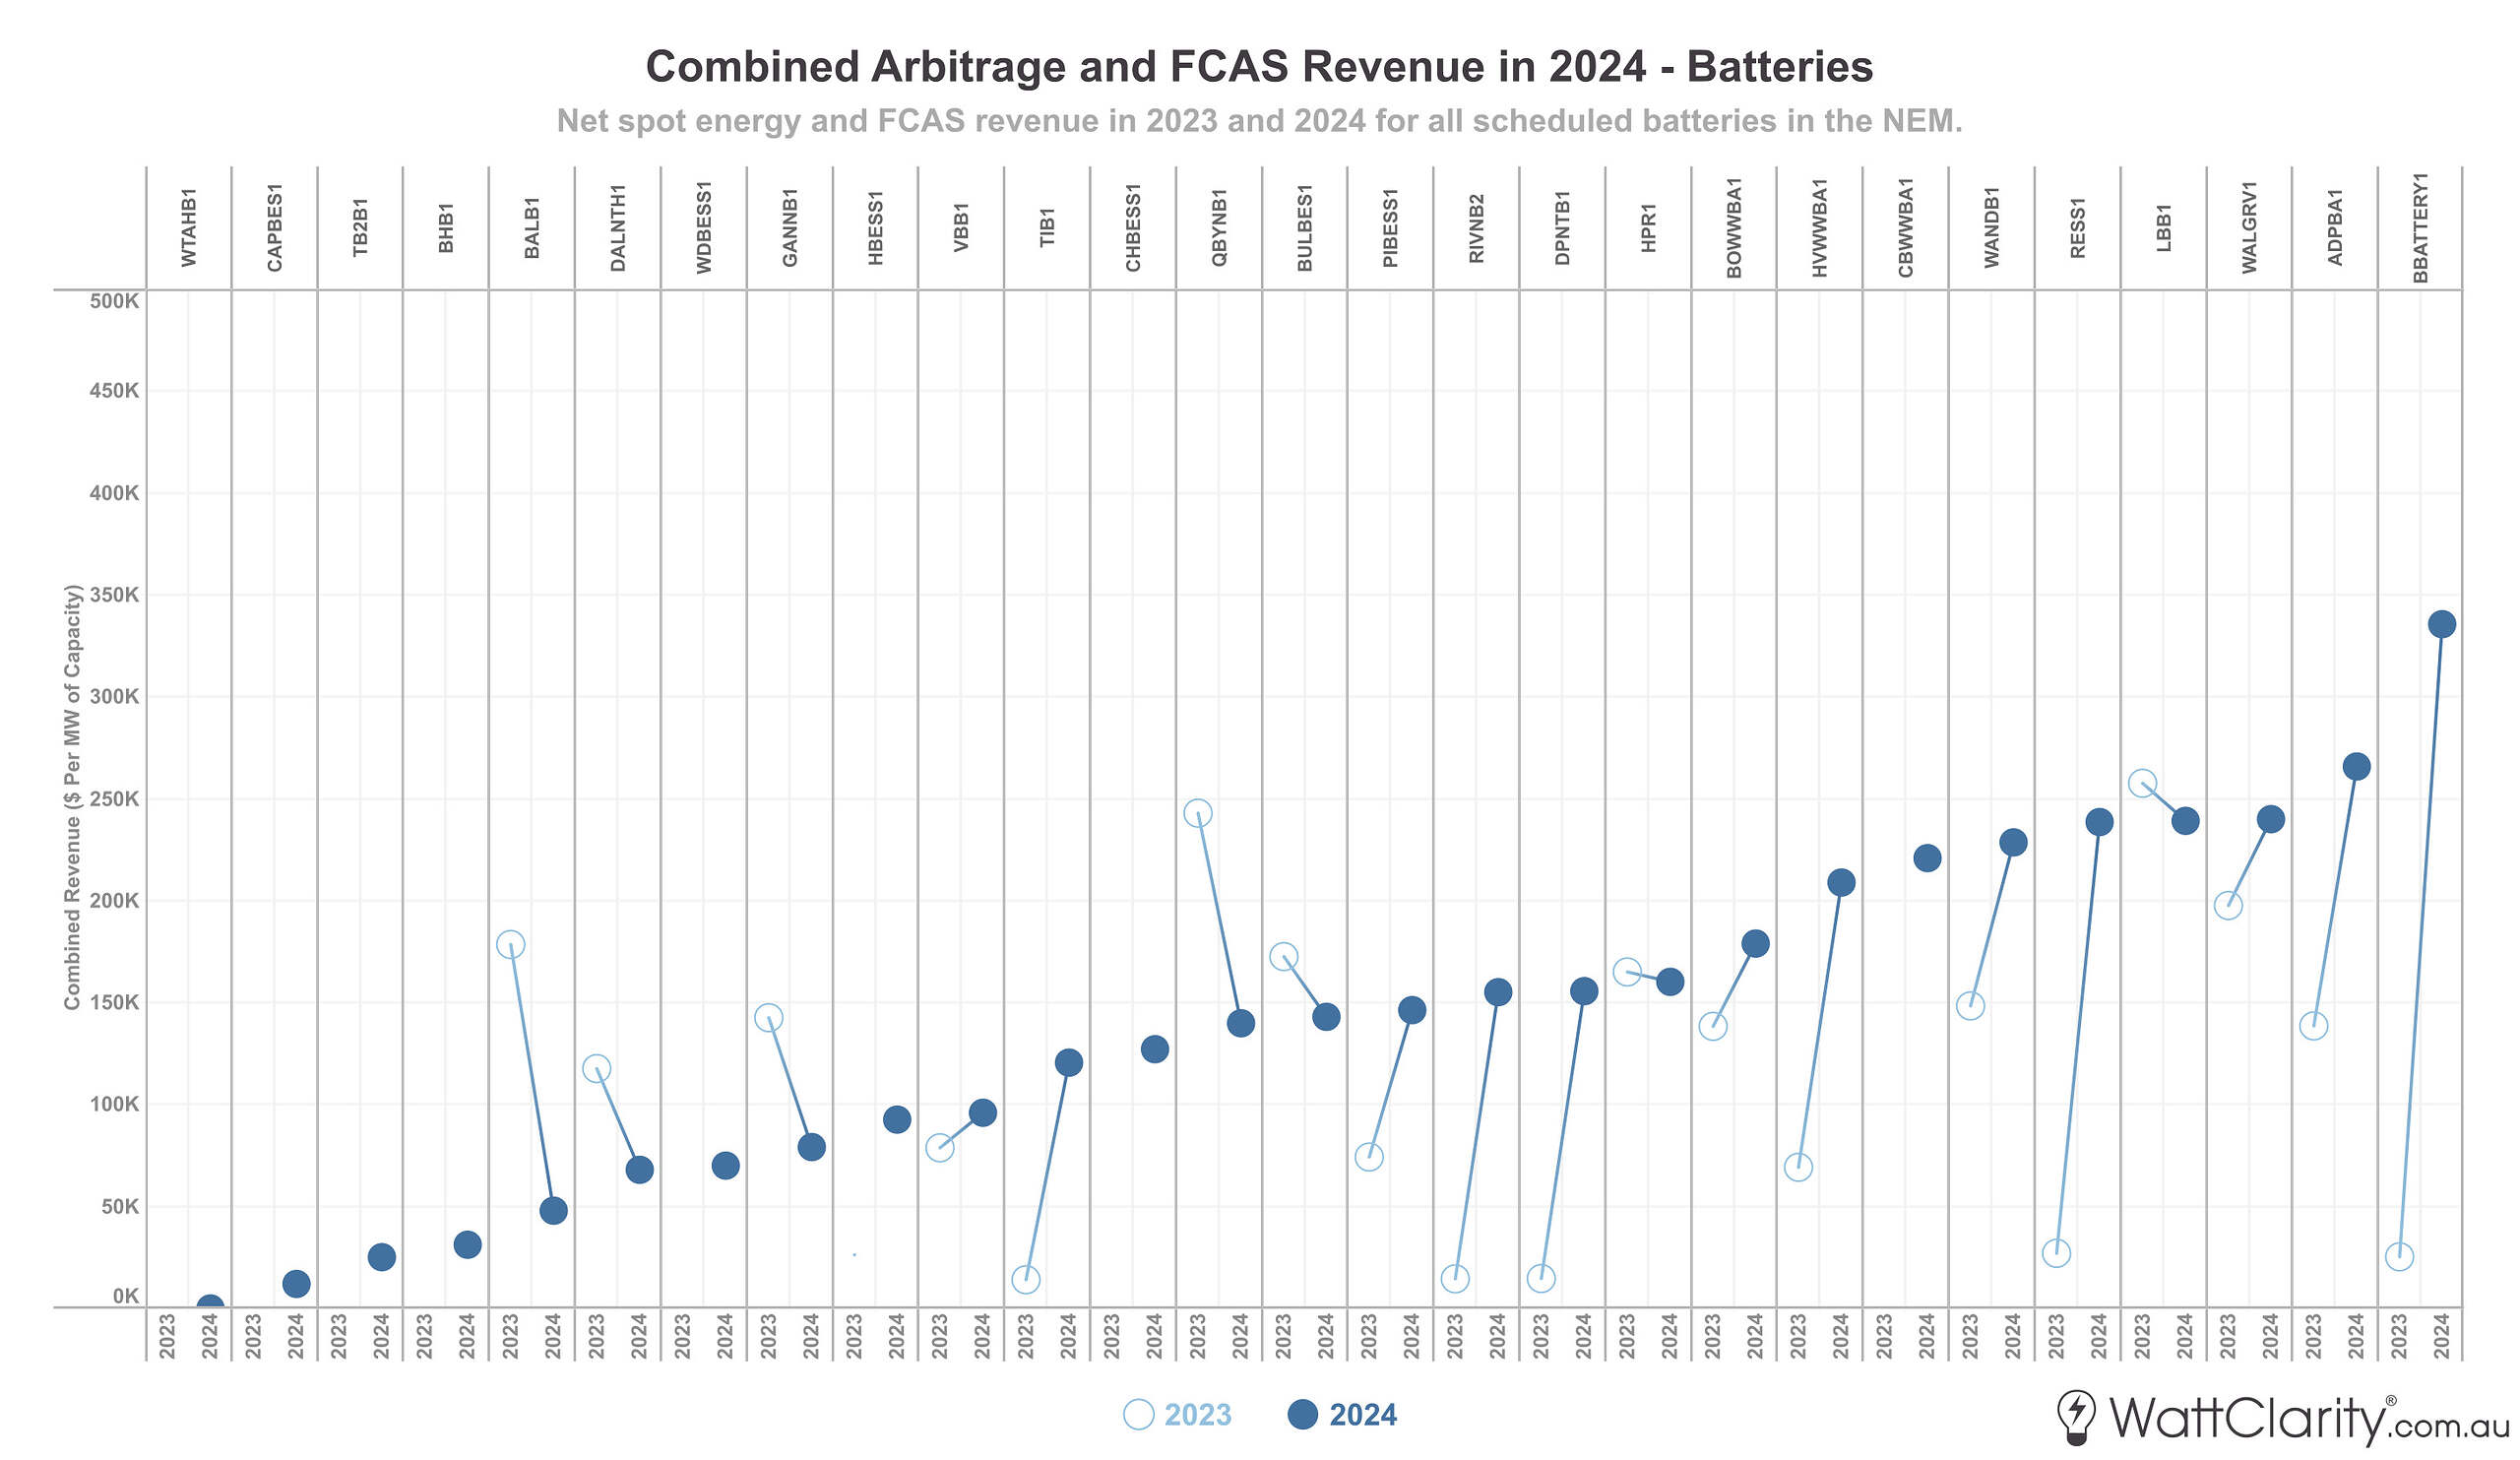
Combined effects meant that incumbents who target FCAS revenue (typically smaller or shorter-duration batteries) saw diminished total market returns in 2024.
Source: GSD2024 Data Extract
Whilst price volatility in the energy market was favourable across the board, the aggregate of these two revenue streams meant that a number of smaller and/or shorter-duration batteries which target FCAS markets – such as the Dalrymple BESS and the Ballarat BESS – saw themselves towards the bottom of the normalised market revenue ladder, and experiencing significantly decreased market revenues compared to 2023.
It’s easier to make hay either side of when the sun shines
A one-week stretch last winter highlighted both the challenges and opportunities of extreme pricing events for batteries. Over this period, two distinct types of diurnal price volatility exemplified what the current big battery fleet struggles at—and where it excels:
- July 30th: Big batteries in South Australia struggled to make the most of a rare evening double price spike. Allan later concluded that up to $2.4m was ‘left on the table’ by these batteries on that day alone. As explained in that article, double-price-peaks within a short time frame remain difficult for big batteries to take advantage of due to (1) the inherent difficulties of short-term price forecasting and (2) the limited durations of the current fleet. These two factors combined create a nightmare of an optimisation problem for auto-bidding algorithms.
- August 5th: A week later was the highest single revenue day for big batteries in 2024 – with approximately one-tenth of annual market revenue for the entire battery fleet made on this single day. A morning and evening burst of high spot prices (across all mainland regions) gave batteries a much more predictable and suitable dual-price peak to take advantage of.
A soft alarm bell for developers’ financial models?
Another noteworthy event for battery operations in 2024 was seen on November 27th, with the AEMO demonstrating a new form of market direction. With impending supply tightness in NSW expected later that day, the AEMO directed the Wallgrove BESS and the Waratah Super Battery to maintain a state-of-charge for several hours, effectively designating them as reserve capacity until the supply tightness eased.
While this provided the AEMO with an extra lever to pull to manage reliability – as we’ve seen above, the business case of a big battery relies heavily on taking advantage of relatively brief extreme price spikes. Our good friends at Overwatch Energy highlighted the paradox that these directions may pose, and suggested that we are also likely to see the inverse scenario applied during minimum system load events.
While the financial impact for both batteries on this day may have been relatively minor, it was a soft alarm bell for developers that they should always test the assumptions in their financial models.
Key Takeaways
In 2024, big batteries cemented their role as influential and critical players in the NEM. While favourable price volatility was a defining feature of market revenue outcomes, there were also signs of emerging challenges that face the current fleet, and the impending wave of new battery projects scheduled to join them in coming years.
The road ahead for big batteries in the NEM appears promising, but is anything but settled. As new entrants increase competition and market conditions evolve rapidly, developers and operators are left with plenty to consider.
And data is always a good place to start.
–
Further Reading
The data contained in this analysis has been taken from our GSD2024 data extract, released just under two weeks ago. For every single operating unit in the NEM we have calculated and summarised operational and financial performance metrics so that operators, prospective developers, governments, and other key decision-makers can gain insights about how all units in the NEM have been operating and performing. The GSD2024 is available to purchase using this order form here.

The profile for Moree Solar Farm from our GSD2024 – shows a ten-year summary between 2015 to 2024 on the left page and a one-year summary of 2024 on the right page.
Click here for a higher-resolution image.
Source: GSD2024
Leave a comment