
It’s always a pleasure to delve into the data that Global-Roam produces each year and the history that is represented in the GSD. The problem for an analyst is twofold: (1) how to turn data into information and (2) that history is not necessarily a guide to the future.
My focus generally is on understanding and to the extent it’s possible for a retired analyst, to facilitate the transition to a ‘carbon-light’ Australia. These days the science of global warming is beyond any dispute. You can use an FTIR Spectrometer or an Infrared Gas Analyser to show that CO2 absorbs infrared radiation and then re-emits it and you can use spectrometers on satellites to measure the increasing atmospheric CO2 concentration. In total, the maths suggests that energy from warming each year, 90% of which goes into the ocean is about 30X the energy in all the coal, gas and oil produced every year in the entire world. Never mind all the physical evidence. So for the sake of future generations and as stewards of our world, we all have to do our part, however small, to fix the problem.
And the generally accepted thing is to decarbonise electricity and then electrify.
This preamble relates to the GSD because electricity generation in the NEM is rapidly moving towards 50% coming from renewable sources – and I reckon anyone betting against less than say 2/3 renewable within a few years would want long odds.
So we all need to learn and be informed by data and analysis about this new and unprecedented world. Of course, humans have always relied on managing variable water supply (rain) and yes there are droughts but mostly we manage. It doesn’t rain when you turn the tap on and no doubt there is baseload water demand but supply is 100% variable with storage operating as the buffer.
Because none of us really know what is actually going to happen in a market dominated by Variable Renewable Energy (VRE) there are constant worries and fears. Three of the main worries are:
- Worry #1: The lights will go out; It is normal to worry about what happens in a wind and solar drought. By solar drought, we basically have to mean night times because the sun is pretty reliable despite rain and cloud cover. In the end we have to rely on modelling and then proof from execution. Regarding the modelling AEMO models a highly renewable system in the ISP and the modelling results show that the AEMO reliability standard is met. Never mind about cost or execution, if you accept the ISP modelling of demand and available supply is properly done then in theory the lights stay on. And the lights have stayed on even as VRE has moved to 40% on average and much higher penetration for shorter time periods.
- Worry #2: VRE will lead to frequency instability You need to be a power engineer to be entitled to have a view on this. All I will say is that all the reading I do suggests that batteries can do most of the job. And conceptually batteries because of the way they are distributed could lead to a more secure grid.
- Worry #3: Spot prices will be highly binary. I suffer from this worry myself. We see at the moment that an excess of solar in spring leads to curtailment and low prices and we imagine that this will always be true. Equally we see that when wind and solar production is low prices rise sharply and again we imagine it will always be so. But to project the current situation into the future in this way misunderstands the role that prices play. When we talk about price forecasts, it’s as if prices are set in stone. In economics theory, and I think in fact, prices act as signals. High prices result in less consumption, demand substitution or destruction and new investment. And vice versa. In the case of the NEM a belief that lunchtime prices are likely to stay low and that evening prices are likely to stay high has lead to say 9 GW of battery investment with the total still growing. That’s probably around $6bn of investment
Right now some generators are hurt more than others by excess production and network constraints
One of the things the GSD does is to provide a summary of the impact of constraints on generators. This information may be available elsewhere but I don’t know where.
I only worked with semi-scheduled generation, the table provided with GSD, plus I took some data from other tables. For semi-scheduled if I did the arithmetic and data manipulation correctly then a summary for 2024 is:
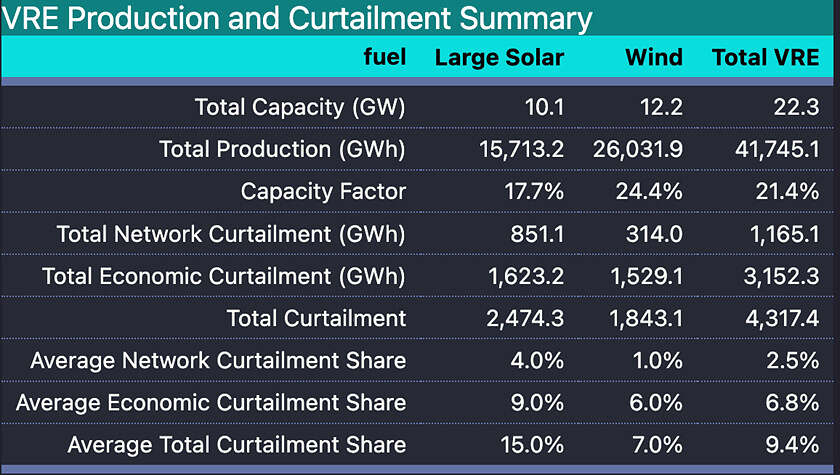
VRE production and curtailment
Note: Capacity factors are based on total fleet capacity at the end of the 2024 calendar year.
Source: GSD2024
A couple of things jumped out at me from this table, and noting its pre-MLF:
- The capacity factors, measured as production/( Capacity * 8760) are on the low side, particularly for solar. In fact, as present the solar numbers are barely better than rooftop solar. One thing to note is that capacity includes anything with metered data at the end of the year, but a number of units only operated for part of the year.
- The economic curtailment shares are material to sector economics and utility solar is penalised at every step it takes.
- Total curtailment is above 4 TWh – that is pretty much equivalent to 500 MW of capacity operating at 100% capacity factor and it is over 9.4% of VRE potential output. Most models do have some VRE curtailment its true, but the question of who pays for it is rarely resolved.
I looked at constraints from two points of view, (i) relative to actual output which generators were worst impacted, (ii) in absolute terms which generators were most constrained, that is energy was not produced that could have been produced. In the GSD there is an “Available energy” field but I didn’t use that. Instead, I calculated “potential energy” as production + network curtailment + economic curtailment and measured curtailment relative to “potential”. For me, it has always been the case that I want a broad understanding with as little technical detail as possible.
I used the semi-scheduled generators to calculate total curtailment and then sorted the data. The 20 generators with the highest absolute curtailment losses in 2024 are shown in the following figure. Note the little solar and wind icons.
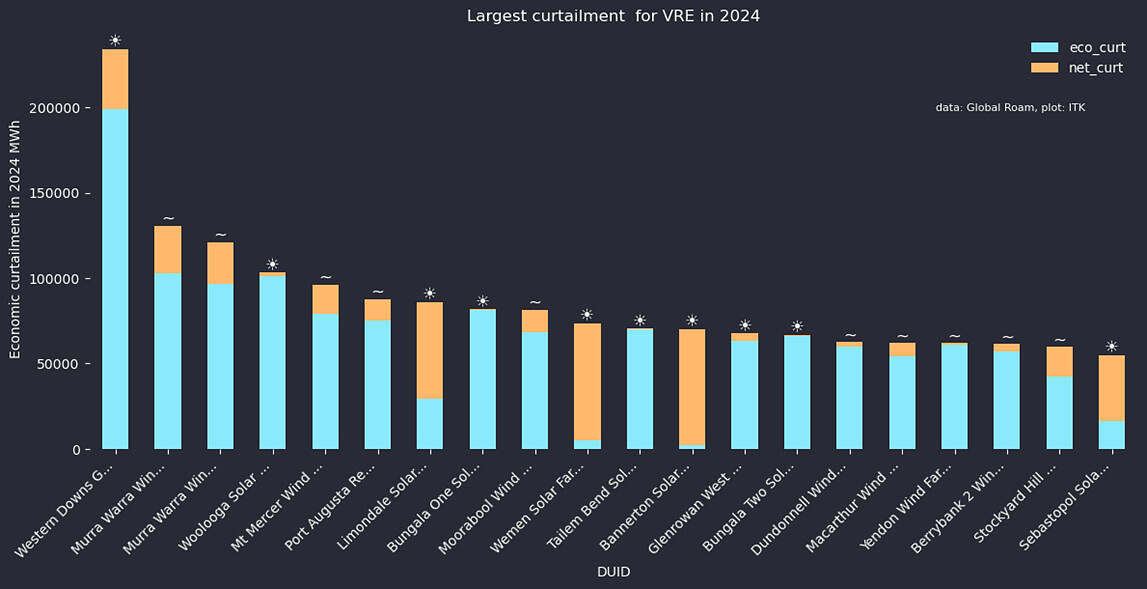
Most curtailed semi-scheduled units.
Source: GSD2024
Because wind farms are typically larger than solar farms they show up quite a bit in this list with Murra Warra losing 15 GWh due to economic curtailment. Western Downs though was a clear loser. Economic curtailment dominates this list.
Relative to potential output though solar farms are the big losers.
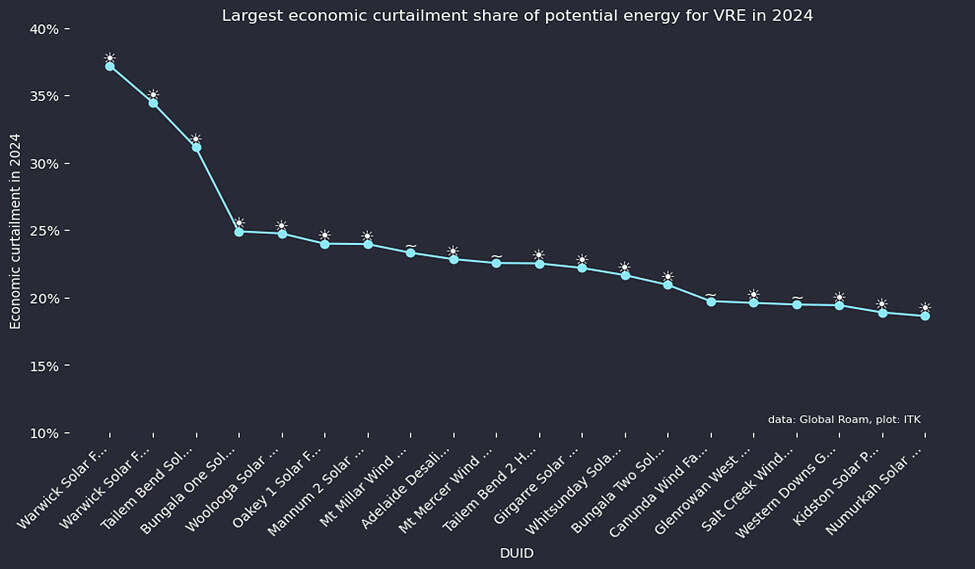
Economically curtailed semi-scheduled VRE units.
Source: GSD2024
And of course, that is what you would expect since the CIS, and it’s understood most modern PPAs, exclude negative prices. So despite REC revenue utility solar will often switch off when prices go negative. In short rooftop solar pushes utility solar out of production.
Looking at network constraints, it’s all solar.
To my way of thinking, this is a little bit on the transmission providers. Sure it’s up to a solar farm to locate itself where it will be as ‘constraint-free’ as possible. But is it really the low-cost solution to have so much already built solar constrained off? Equally, if it wasn’t network-constrained maybe there would be more economic curtailment.
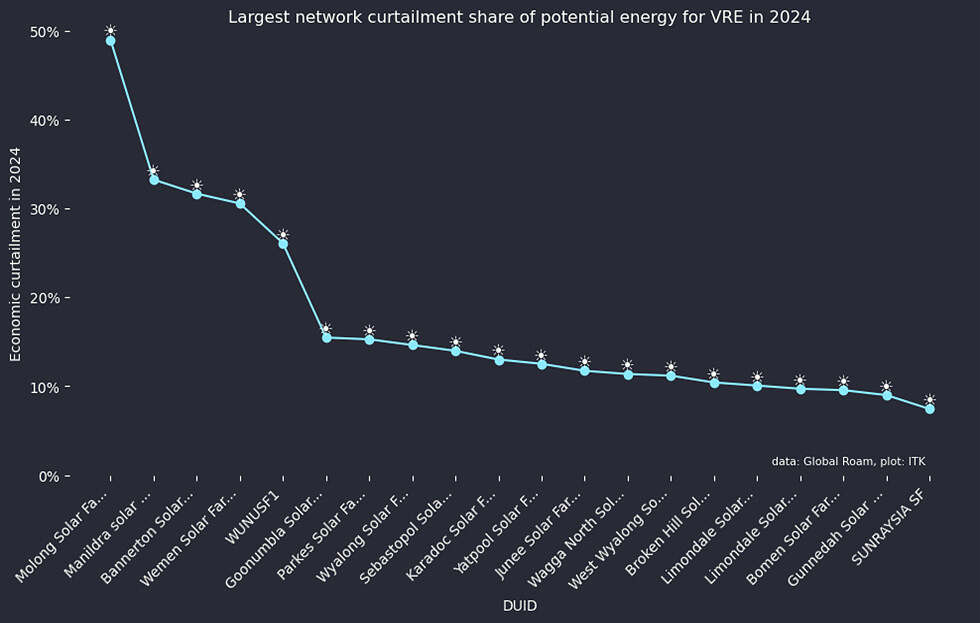
Network curtailed semi-scheduled VRE units.
Source: GSD2024
A quick look at revenue and price
There is nothing much of great analytical value in looking at the top revenue earners except to note that all but one are wind farms and that Tilt energy has the two best. Were I to show a cut by State I would find that Victorian assets tend to fare worse because Victorian spot prices are low and Queensland wind assets do well because right now there isn’t that much wind fully operational in Qld.
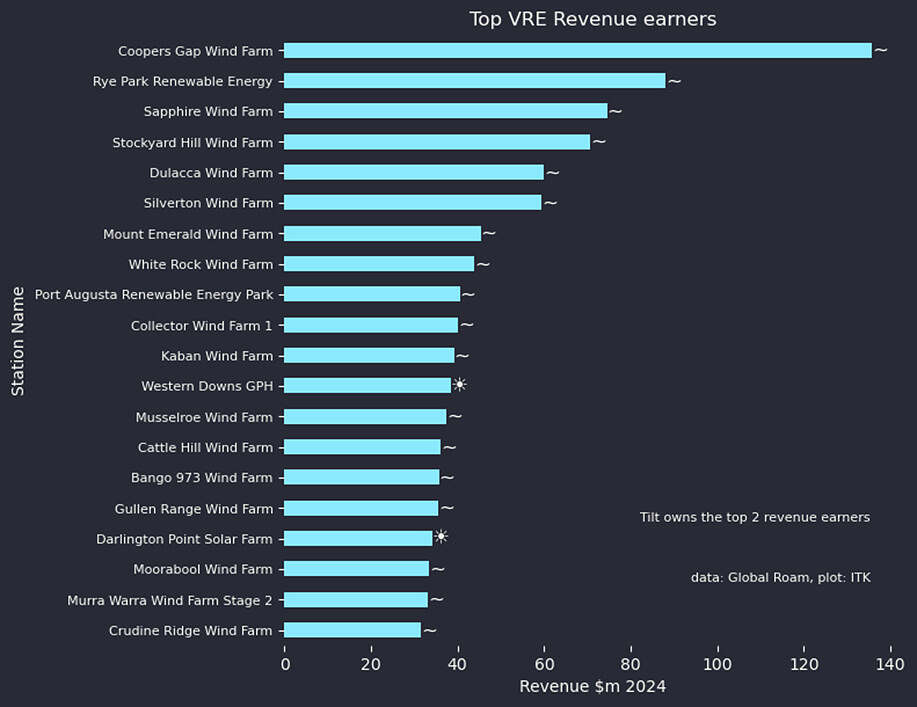
Top semi-scheduled VRE revenue earners.
Source: GSD2024
And the best prices (pre MLF and calculated as revenue for the year divided by production) are all wind farms bar one. Its a bit cheeky including Macintyre as in 2024 it had only just started commissioning.
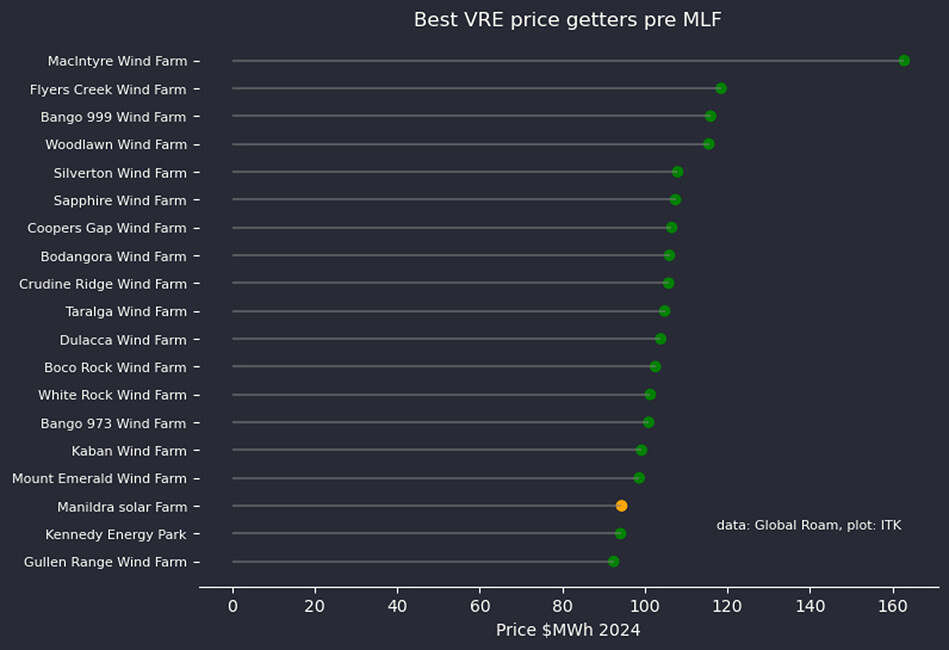
Top semi-scheduled VRE price getters.
Source: GSD2024
You could argue that if wind farms continued to achieve prices up around $100/MWh and were still receiving RECs and these numbers are post-constraints (even before MLF), then the economics are good. Of course, the wind farms achieving good prices are all in QLD and NSW where the wind share of generation is quite low. The question remains open of what happens when penetration increases to say South Australian levels.
My sense is that binary price outcomes present a trading opportunity and that battery technology is emerging to produce a more normalised price distribution. In the fullness of time, that’s how I expect things may turn out. It’s not just a random hope, over the past year we here at ITK have been beavering away at a half-hourly spot pricing model out to 2035 and easily extendible. As we have worked on the model building in more price bands we have seen that we can get away from binary prices and to some extent missing money. The way forward is not yet an expressway but I still don’t see any showstoppers, particularly with the aid of tools like the GSD.
About our Guest Author
 |
David Leitch is Principal at ITK Services. He has 33 years of experience in investment banking research at major investment banks in Australia. He was consistently rated in the top 3 for utility analysis between 2006 and 2016.
David has been a client of ours, and a fan of NEMreview, since 2007. He has been a long-time contributor of analysis over on RenewEconomy, and very occasionally contributes to WattClarity! You can find David on LinkedIn here. |
Leave a comment