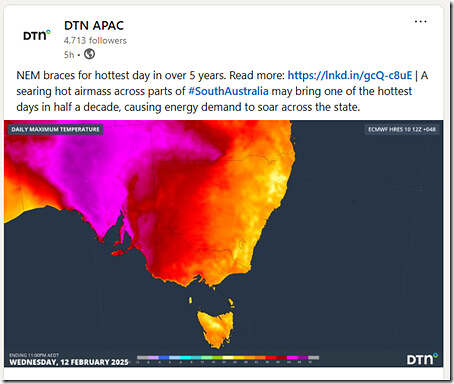
I’ve a few things left to do today, but it was impossible not to become ‘distracted’ when seeing a headline from DTN (formerly Weatherzone) stating ‘NEM braces for hottest day in 5 years’:
Note in the text that follows they clarify that this is with respect to South Australia for Wednesday 12th February 2025 (and a big hint was in the image) – with the LinkedIn teaser passing through to the longer article ‘NEM braces for the hottest day in over 5 years’ on their website.
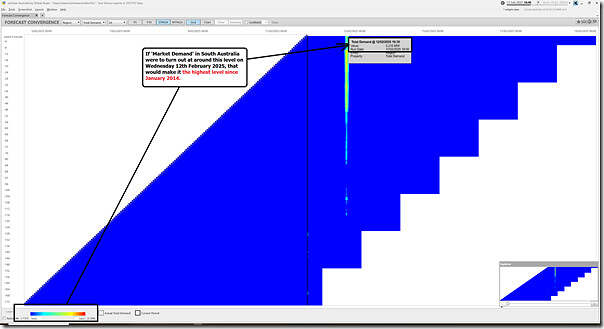
So the next thing I did, after skimming the article, was reach for the ‘Forecast Convergence’ widget in ez2view to look at forecasts for ‘Market Demand’ in South Australia:
Perhaps a bit like a broken record(?) we repeat that this widget allows one to ‘look up a vertical’ in order to ‘see that other dimension of time’.
What’s particularly interesting here is that:
1) I have manually set the colour range to focus only on levels of demand above 3,000MW
… noting that the all-time maximum was 3,402MW way back on 31st January 2011.
2) We see that the colours only occur for tomorrow evening:
(a) With the colours generally becoming more pronounced up the column
(b) Though there was an adjustment downwards in the forecasts earlier today
(c) The current forecasts suggest that the ‘Market Demand’ might exceed 3,200MW
3) If this were to occur, then it would be the highest demand level since back on 16th January 2014.
(a) which we recorded in this article back at that time.
(b) so more than 11 years ago.
(c) noting that I have not looked at other measures that others use, like Operational Demand.


Looks like a record today over 3700MW!!
I suspect you’re looking at another measure (perhaps ‘Operational Demand’), George?
But, regardless of the measure, as noted in ‘‘Market Demand’ soars in South Australia on Wednesday evening 12th February 2025’ a very high end result!